개요
과도기 간격 전략은 가격 변동 간격에 기반한 단선 거래 전략이다. 이는 가격이 일정 시간 동안 형성되는 변동 간격을 사용하여 시장의 추세를 판단하고, 간격이 깨지면 상장/무소한다.
전략 원칙
이 전략은 지난 N 루트 K 라인의 최고 가격과 최저 가격을 계산하여 가격의 변동 영역을 구성한다. 최신 K 라인이 이 영역을 침투하면 트렌드가 전환되어 거래 신호가 발생한다고 판단한다.
구체적으로, 전략은 계속적으로 마지막 N근 K선 ((조정 가능한 변수 N) 의 최고 가격과 최저 가격을 추적합니다.
- 최저값 = 지난 N 근 K 선의 최저점
- 최대값 = 지난 N 루트 K 선의 최고점
그리고 이 모든 것은 가격의 변동이 가능한 영역을 형성합니다.
최신 K 라인의 종전 가격이 가장 높은 가격보다 높을 때, 범위를 돌파하고, 다중 신호를 생성합니다. 최신 K 라인의 종전 가격이 가장 낮은 가격보다 낮을 때, 범위를 돌파하고, 하위 신호를 생성합니다.
또한, 정책에는 색 필터와 엔티티 필터가 추가되었다. 색 필터는 K선 엔티티의 색에 따라 신호를 필터링하고, 엔티티 필터는 K선 엔티티의 크기에 따라 신호를 필터링한다. 이것은 가짜 신호를 필터링 할 수 있다.
전략적 이점
이 전략은 다음과 같은 장점을 가지고 있습니다.
- 가격 범위를 파악하고, 트렌드 전환점을 판단하고, 정확한 추가 하락을 수행합니다.
- 색상 필터와 실체 필터, 가짜 신호를 필터링할 수 있다
- 정책 논리는 간단하고 명확하며, 이해하기 쉽고 변수를 조정할 수 있습니다.
- 더 많은 변수를 조정하여 전략을 최적화 할 수 있습니다.
위험 분석
이 전략에는 몇 가지 위험도 있습니다.
- 잘못된 매개 변수 설정으로 인해 거래가 너무 빈번하고 거래 비용이 너무 높을 수 있습니다.
- 부적절한 범위를 설정하여 너무 많은 범위를 뚫는 가짜 신호가 발생할 수 있습니다.
- 가격 변동이 심한 경우, 가격 범위 예측이 효과적이지 않습니다.
- 가격 폭락을 처리할 수 없는 상황
이 위험은 간격 변수를 조정하고 신호 필터링 조건을 최적화하여 줄일 수 있습니다.
최적화 방향
이 전략은 다음과 같은 방향으로 최적화될 수 있습니다.
- 고정 N-K 선이 아닌 가격 범위를 동적으로 조정하는 방법
- 손실을 줄이기 위해 스톱 로직을 추가합니다.
- 필터 파라미터를 최적화하여 신호 품질을 향상시킵니다.
- 가격 격차 처리 논리를 추가합니다.
- 여러 시간 주기의 판단 신호를 결합하여 덫에 걸리지 않도록 한다.
요약하다
전환구역 전략은 전체적으로 비교적 간단하고 실용적인 단선 거래 전략이다. 가격구역을 통해 트렌드 전환점을 판단하여 시장 기회를 신속하게 잡을 수 있다. 동시에 주의해야 할 몇 가지 위험이 있습니다. 매개 변수를 조정하고 최적화하면 이 전략을 더욱 개선하여 수익 효과를 높일 수 있다.
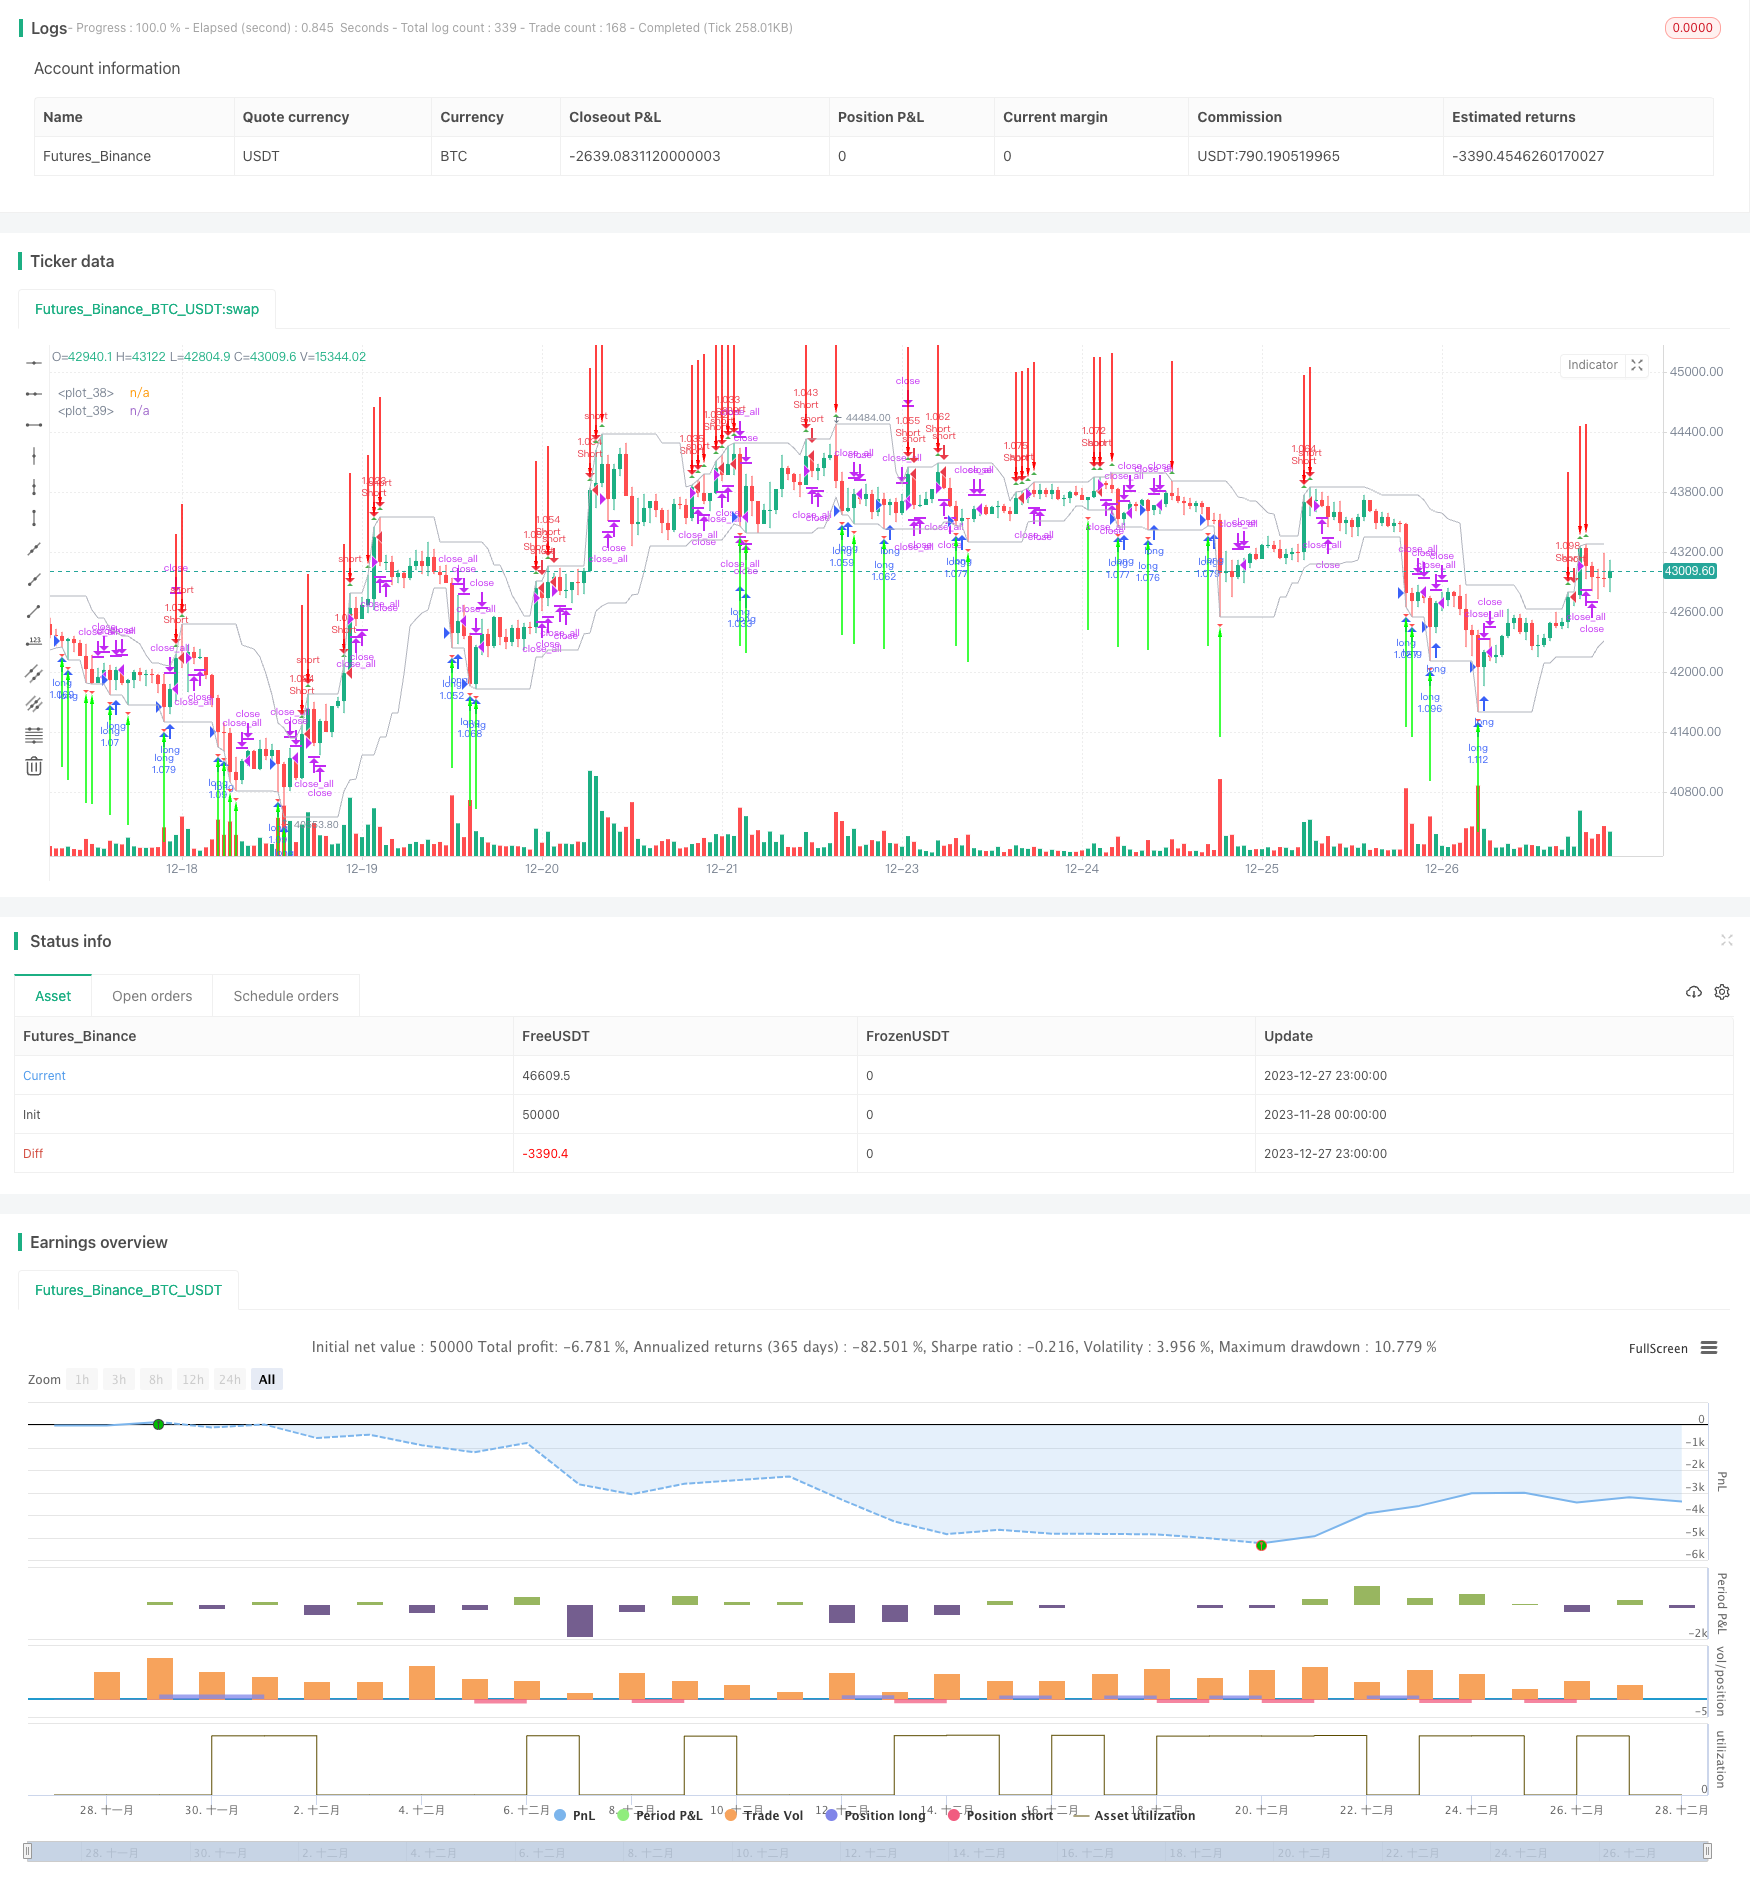
/*backtest
start: 2023-11-28 00:00:00
end: 2023-12-28 00:00:00
period: 1h
basePeriod: 15m
exchanges: [{"eid":"Futures_Binance","currency":"BTC_USDT"}]
*/

//Noro
//2018

//@version=2
strategy("Noro's Transient Zones Strategy v1.0", shorttitle = "TZ str 1.0", overlay=true, default_qty_type = strategy.percent_of_equity, default_qty_value = 100, pyramiding = 0)

//Settings
needlong = input(true, defval = true, title = "Long")
needshort = input(true, defval = true, title = "Short")
capital = input(100, defval = 100, minval = 1, maxval = 10000, title = "Capital, %")

usecol = input(true, defval = true, title = "Use Color-Filter")
usebod = input(true, defval = true, title = "Use Body-Filter")

h_left = input(title = "H left", defval = 10)
h_right = -1
sample_period = input(title = "Sample bars for % TZ",  defval = 5000)
show_ptz = input(title = "Show PTZ", type = bool, defval = true)
show_channel = input(title = "Show channel", type = bool, defval = true)

fromyear = input(2018, defval = 2018, minval = 1900, maxval = 2100, title = "From Year")
toyear = input(2100, defval = 2100, minval = 1900, maxval = 2100, title = "To Year")
frommonth = input(01, defval = 01, minval = 01, maxval = 12, title = "From Month")
tomonth = input(12, defval = 12, minval = 01, maxval = 12, title = "To Month")
fromday = input(01, defval = 01, minval = 01, maxval = 31, title = "From day")
today = input(31, defval = 31, minval = 01, maxval = 31, title = "To day")

//By Jurij w/ TZ percent occurrence by SPYderCrusher

//barCount = nz(barCount[1]) + 1
//check history and realtime PTZ
h_left_low = lowest(h_left)
h_left_high = highest(h_left)
newlow = low <= h_left_low
newhigh = high >= h_left_high
plotshape(newlow and show_ptz, style=shape.triangledown, location=location.belowbar, color=red)
plotshape(newhigh and show_ptz, style=shape.triangleup, location=location.abovebar, color=green)
channel_high = plot(show_channel ? h_left_low : 0, color=silver)
channel_low = plot (show_channel ? h_left_high : 0, color=silver)

//check true TZ back in history
central_bar_low = low[h_right + 1]
central_bar_high = high[h_right + 1]
full_zone_low = lowest(h_left + h_right + 1)
full_zone_high = highest(h_left + h_right + 1)
central_bar_is_highest = central_bar_high >= full_zone_high
central_bar_is_lowest = central_bar_low <= full_zone_low
plotarrow(central_bar_is_highest ? -1 : 0, offset=-h_right-1)
plotarrow(central_bar_is_lowest ? 1 : 0, offset=-h_right-1)

//Color Filter
bar = close > open ? 1 : close < open ? -1 : 0

//Body Filter
nbody = abs(close - open)
abody = sma(nbody, 10)
body = nbody > abody / 3 or usebod == false

//Signals
up1 = central_bar_is_lowest and body and (bar == -1 or usecol == false)
dn1 = central_bar_is_highest and body and (bar == 1 or usecol == false)
exit = ((strategy.position_size > 0 and close > open) or (strategy.position_size < 0 and close < open)) and body

//Trading
lot = strategy.position_size == 0 ? strategy.equity / close * capital / 100 : lot[1]

if up1
    if strategy.position_size < 0
        strategy.close_all()

    strategy.entry("long", strategy.long, needlong == false ? 0 : lot, when=(time > timestamp(fromyear, frommonth, fromday, 00, 00) and time < timestamp(toyear, tomonth, today, 23, 59)))

if dn1
    if strategy.position_size > 0
        strategy.close_all()

    strategy.entry("Short", strategy.short, needshort == false ? 0 : lot, when=(time > timestamp(fromyear, frommonth, fromday, 00, 00) and time < timestamp(toyear, tomonth, today, 23, 59)))

if time > timestamp(toyear, tomonth, today, 23, 59) or exit
    strategy.close_all()