BankNifty 슈퍼트렌드 거래 전략

개요
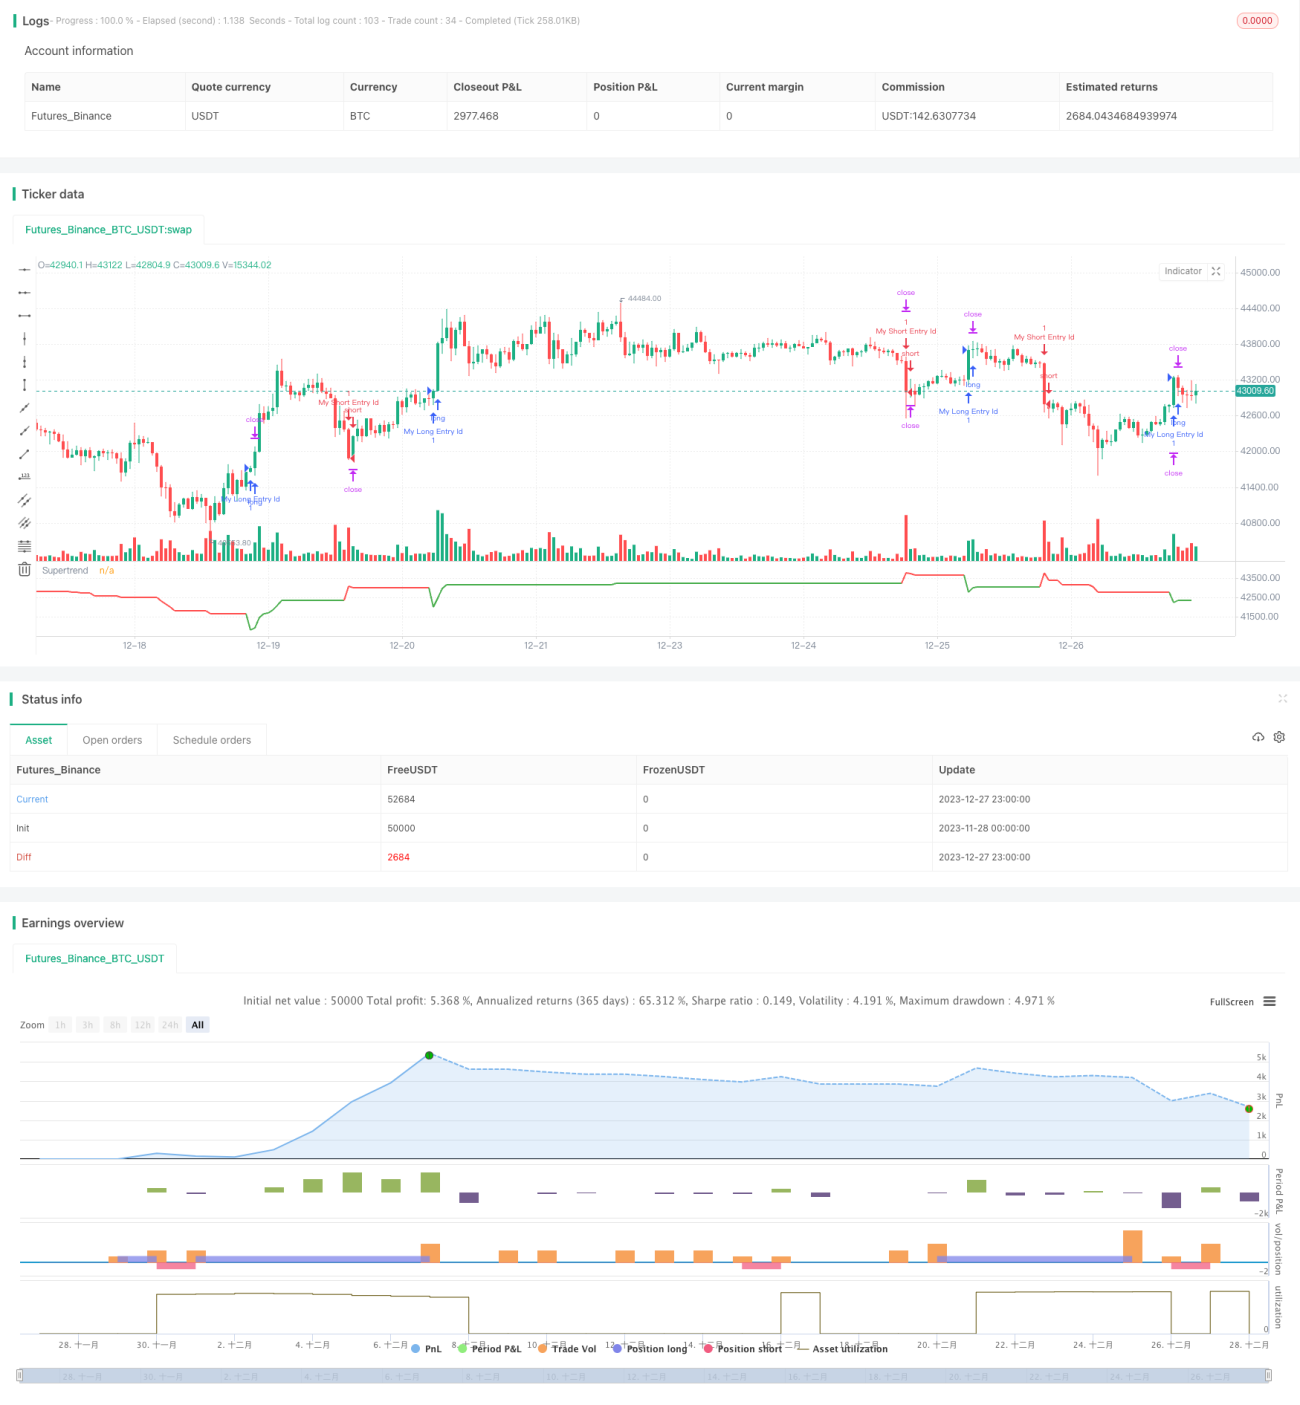
본 전략은 BankNifty 5분 캔들을 기반으로 한 슈퍼 트렌드 지표 거래 전략입니다. 이 전략은 주로 슈퍼 트렌드 지표를 활용하여 추세를 식별하고, 거래 시간 및 리스크 관리 규칙을 결합하여 거래를 실행합니다.
전략 원리
이 전략은 먼저 거래 시간 및 날짜 범위 등의 입력 변수를 정의합니다. 거래 시간은 인도 거래 시간으로 설정되며, 오전 9:15부터 오후 3:10까지입니다.
그런 다음 슈퍼 트렌드 지표와 그 방향을 계산합니다. 슈퍼 트렌드 지표는 추세의 방향을 식별할 수 있습니다.
각 거래 시간이 시작될 때, 전략은 3개의 캔들이 형성될 때까지 기다린 후 진입을 고려합니다. 이는 가짜 돌파를 걸러내기 위함입니다.
롱 신호는 슈퍼 트렌드 지표의 방향이 아래에서 위로 변경될 때 발생하며, 숏 신호는 슈퍼 트렌드 지표의 방향이 위에서 아래로 변경될 때 발생합니다.
진입 후에는 손절매가 설정되며, 고정 손절매 포인트와 트레일링 스탑로스 비율은 입력 변수를 통해 조정할 수 있습니다.
거래 시간이 종료되면, 전략은 모든 미결제 포지션을 청산합니다.
전략 장점
본 전략은 지표를 활용하여 추세를 식별하는 간단한 거래 전략입니다. 다음과 같은 장점이 있습니다:
- 슈퍼 트렌드 지표를 활용하여 추세 방향을 판단함으로써 추세를 효과적으로 식별할 수 있습니다.
- 거래 시간을 결합하여 시장 변동성이 가장 큰 개장 및 마감 시간을 피할 수 있습니다.
- 트레일링 스탑로스를 설정하여 수익을 고정할 수 있습니다.
- 입력 변수를 통해 자유롭게 조정할 수 있는 매개변수가 많아 적응성이 뛰어납니다.
전략 위험
이 전략에는 다음과 같은 몇 가지 위험이 있습니다:
- 슈퍼 트렌드 지표는 지연이 발생할 수 있어 최적의 진입 시점을 놓칠 수 있습니다.
- 단일 지표만으로 판단할 경우 가짜 돌파의 영향을 받기 쉬워 승률이 높지 않을 수 있습니다.
- 전체 시장 추세를 고려하지 않아 시장과의 디버전스가 발생할 수 있습니다.
- 손절매 포인트 설정이 부적절할 경우 예상보다 큰 손실이 발생할 수 있습니다.
슈퍼 트렌드 지표의 매개변수를 최적화하거나 다른 지표를 추가하여 이러한 위험을 줄일 수 있습니다.
전략 최적화 방향
본 전략은 다음과 같은 측면에서 최적화할 수 있습니다:
- 다른 지표를 추가하여 조합 거래 전략을 구성하면 전략의 안정성을 높일 수 있습니다.
- 전체 시장 흐름에 대한 판단을 추가하여 시장과의 디버전스를 방지할 수 있습니다.
- 슈퍼 트렌드 지표의 매개변수를 최적화하여 가장 적합한 길이와 인자를 찾습니다.
- 손절매 전략을 조정합니다. 예를 들어 추세 진행에 따라 손절매 포인트를 점진적으로 조정합니다.
- 다양한 거래 상품을 테스트하여 이 전략에 가장 적합한 상품을 찾습니다.
요약
본 전략은 BankNifty 5분 캔들을 기반으로 한 슈퍼 트렌드 지표 거래 전략입니다. 슈퍼 트렌드 지표를 활용하여 추세 방향을 판단하고, 거래 시간 및 리스크 관리 규칙을 결합하여 거래를 실행합니다. 복잡한 퀀트 전략에 비해 본 전략은 규칙이 간단하고 명확하여 이해하고 구현하기 쉽습니다. 예시 전략으로서 향후 최적화 및 개선을 위한 기반과 방향을 제공합니다. 지속적인 개선과 향상을 통해 이 전략이 신뢰할 수 있고 안정적인 수익을 내는 퀀트 트레이딩 전략이 되기를 바랍니다.
/*backtest
start: 2023-11-28 00:00:00
end: 2023-12-28 00:00:00
period: 1h
basePeriod: 15m
exchanges: [{"eid":"Futures_Binance","currency":"BTC_USDT"}]
*/

//@version=5
strategy("BankNifty 5min Supertrend Based Strategy, 09:15 Entry with Date Range and Risk Management")

// Session and date range input variables- 1