개요
이 전략은 볼밴드 지표와 평균 실제 파도 (ATR) 지표의 사용과 결합하여, 추적 손실 기능을 갖춘 돌파 거래 전략을 형성한다. 가격이 지정된 표준 차이의 볼밴드를 통과했을 때 경로 상향 또는 경로 하향을 할 때 거래 신호를 발산한다. 동시에, ATR 지표를 사용하여 손실 지점과 정지 지점을 계산하여 손실 비율을 제어한다. 또한, 전략에는 시간 필터링 및 변수 최적화 등의 기능이 있다.
전략 원칙
첫 번째 단계는 중간, 상단, 하단 라인을 계산한다. 중간 라인은 가격의 간단한 이동 평균 SMA이며, 상단, 하단 라인은 가격 표준 차이의 정수배이다. 가격이 하단 라인에서 위로 돌파 할 때, 더 많은 것을하고, 상단 라인에서 아래로 돌파 할 때, 공백을 만든다.
두 번째 단계는 ATR 지수를 계산한다. ATR 지표는 가격의 평균 변동량을 반영한다. ATR 값에 따라 긴 포지션 중지 손실 지점과 짧은 포지션 중지 손실 지점을 설정한다.
세 번째 단계: 시간 필터를 사용해서, 중요한 뉴스 사건의 급격한 변동을 피하기 위해 지정된 시간 동안만 거래하십시오.
네 번째 단계, 트레일링 스톱 메커니즘. 최신 ATR 위치에 따라 실시간으로 스톱 스톱을 조정하여 더 많은 수익을 잠금합니다.
우위 분석
볼밴드 지표는 가격의 중심을 직접 반영하여 단일 이동 평균보다 더 효과적입니다.
ATR 상쇄는 단위 수익/손실 비율을 통제할 수 있게 해줍니다.
트레일링 스톱은 시장의 변동에 따라 자동으로 조정되어 더 많은 수익을 확보할 수 있습니다.
정책 요소가 풍부하고, 개인화 포트폴리오를 사용자 정의 할 수 있습니다.
위험 분석
“대시장 흔들림 조정이 있을 때 소액 손실이 발생할 수 있습니다”.
“아시아의 모든 국가들은 이 문제를 해결하기 위해 노력해야 한다.
밤과 중요한 뉴스 시간에 거래하는 것은 위험하기 때문에 주의해야 합니다.
대책:
- 위험 관리 원칙을 엄격히 준수하고 단편적 손실을 통제합니다.
- 이 모든 것들은 “전선”을 이용해서 승률을 높일 수 있습니다.
- 시간 필터를 사용해서 위험한 시간을 피하십시오.
최적화 방향
- 다양한 변수 조합을 테스트하여 최적화 구성
- OBV와 같은 열 지표를 추가할 때
- 기계 학습 모듈의 최적화를 추가합니다.
요약하다
이 전략은 종합적으로 볼밴드 지표를 사용하여 트렌드 중심과 돌파 방향을 판단하고, ATR 지표는 스톱 스톱 손실을 계산하여 수익을 보장하고, 후속 스톱 손실이 수익을 잠금합니다. 전략의 장점은 매우 사용자 정의 가능하며, 위험 제어 가능하며, 짧은 라인 인트라데이 트레이딩에 적합합니다. 매개 변수 최적화 및 기계 학습은 전략의 승률과 수익성을 더욱 향상시킵니다.
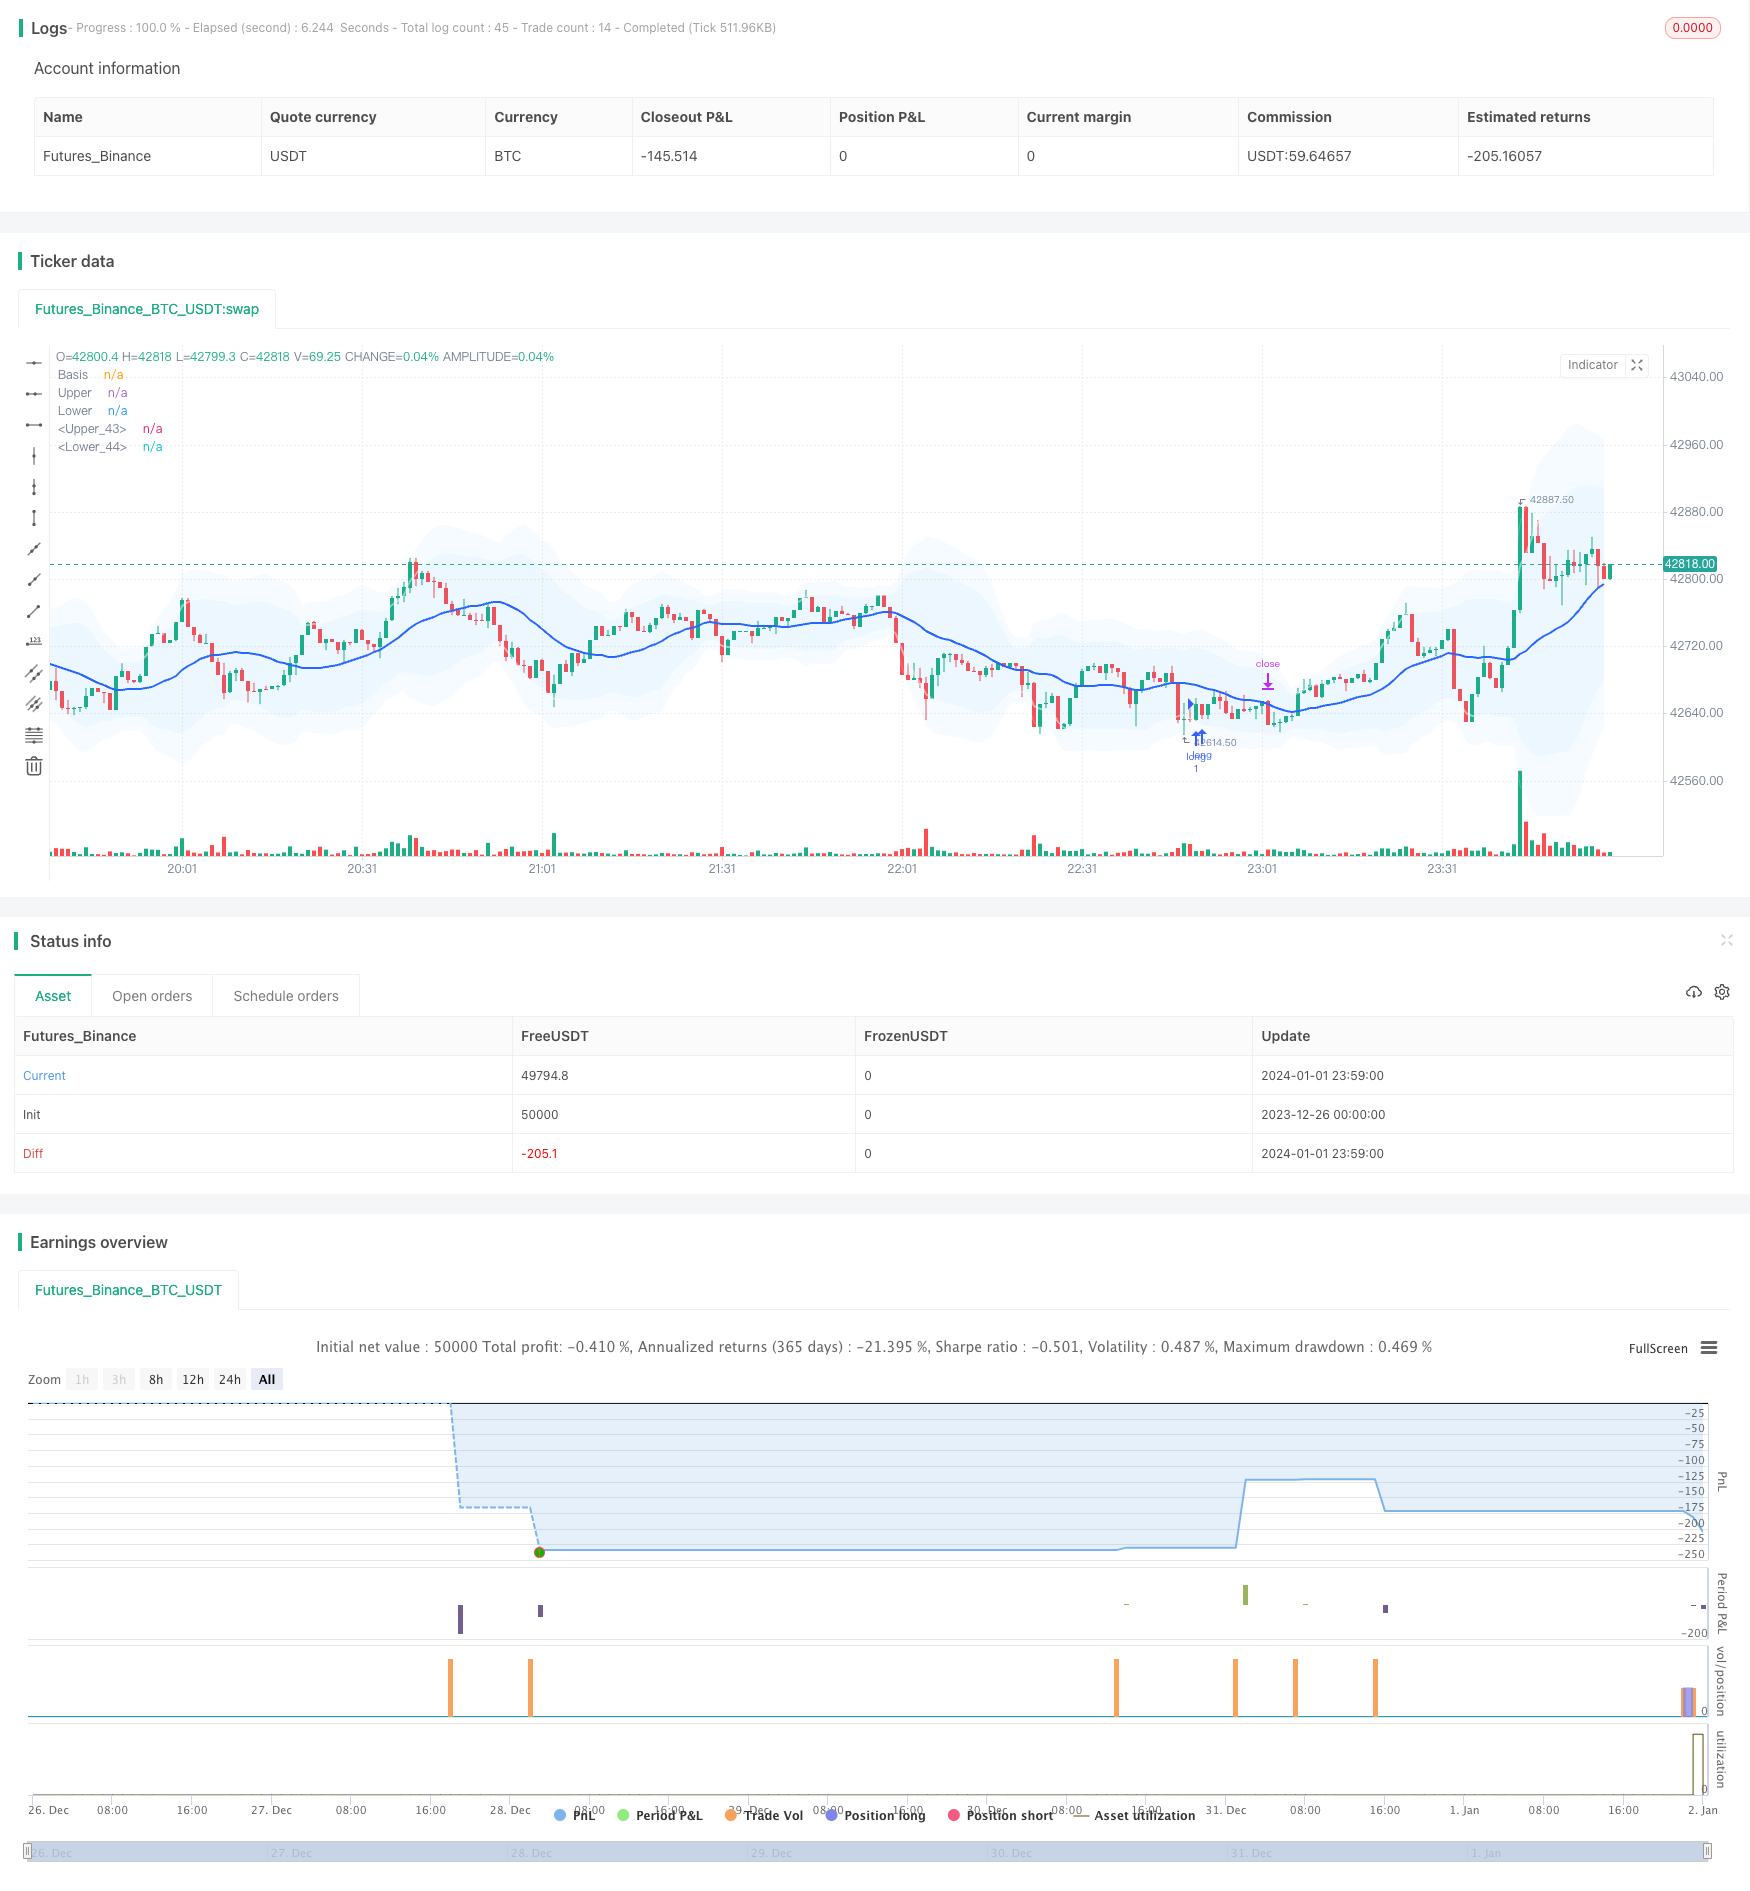
/*backtest
start: 2023-12-26 00:00:00
end: 2024-01-02 00:00:00
period: 1m
basePeriod: 1m
exchanges: [{"eid":"Futures_Binance","currency":"BTC_USDT"}]
*/

// This source code is subject to the terms of the Mozilla Public License 2.0 at https://mozilla.org/MPL/2.0/
// © sadeq_haddadi

//@version=5

strategy('Bollinger Bands + ATR / trail- V2', overlay=true ) // Interactive Brokers rate)


//date and time
startDate   = input(title="Start Date", defval=timestamp("01 Aug 2023 00:00 +0000"), tooltip="Date & time to begin analysis",group = 'Time Filter')
endDate     = input(title="End Date", defval=timestamp("1 Jan 2099 00:00 +0000"), tooltip="Date & time to stop analysis")
timeSession = input(title="Time Session To Analyze", defval="0300-1700", tooltip="Time session to analyze")
inSession(sess) => true

// indicators

length = input.int(20, minval=1,group = 'Bollinger Band')
maType = input.string("SMA", "Basis MA Type", options = ["SMA", "EMA", "SMMA (RMA)", "WMA", "VWMA"])
src = input(close, title="Source")
mult1 = input.float(2.0, minval=0.001, maxval=50, title="StdDev1")
mult2 = input.float(3.0, minval=0.001, maxval=50, title="StdDev2")

ma(source, length, _type) =>
    switch _type
        "SMA" => ta.sma(source, length)
        "EMA" => ta.ema(source, length)
        "SMMA (RMA)" => ta.rma(source, length)
        "WMA" => ta.wma(source, length)
        "VWMA" => ta.vwma(source, length)

basis = ma(src, length, maType)
dev1 = mult1 * ta.stdev(src, length)
dev2 = mult2 * ta.stdev(src, length)
upper1 = basis + dev1
lower1 = basis - dev1
upper2 = basis + dev2
lower2 = basis - dev2
offset = input.int(0, "Offset", minval = -500, maxval = 500)
plot(basis, "Basis", color=#2962FF, offset = offset,linewidth=2)
p1 = plot(upper1, "Upper", color=color.new(color.white,50), offset = offset,linewidth=2)
p2 = plot(lower1, "Lower", color=color.new(color.white,50), offset = offset,linewidth=2)
p3 = plot(upper2, "Upper", color=color.new(color.white,80), offset = offset,linewidth=1)
p4 = plot(lower2, "Lower", color=color.new(color.white,80), offset = offset,linewidth=1)

fill(p1, p2, title = "Background", color=color.rgb(33, 150, 243, 95))
fill(p3, p4, title = "Background", color=color.rgb(33, 150, 243, 95))

show_crosses = input(false, "Show Cross the Bands?")

plotshape(show_crosses and ta.crossover(close, upper2)  ? src : na, "S", style = shape.triangledown, location =location.abovebar, color = color.yellow, size = size.tiny)
plotshape(show_crosses and ta.crossunder(low, lower2) ? src : na ,"L", style = shape.triangleup, location =  location.belowbar, color = color.purple, size = size.tiny)

second_entry = input(true, "Show second deviation entry point?")

//atr

length_ATR = input.int(title="Length", defval=5, minval=1,group = 'ATR')
smoothing = input.string(title="Smoothing", defval="RMA", options=["RMA", "SMA", "EMA", "WMA"])
m = input.float(1, "Multiplier")
src1 = input(high)
src2 = input(low)
pline = input.bool(title = 'show ATR lines ?', defval=false)


ma_function(source, length_ATR) =>
	if smoothing == "RMA"
		ta.rma(source, length_ATR)
	else
		if smoothing == "SMA"
			ta.sma(source, length_ATR)
		else
			if smoothing == "EMA"
				ta.ema(source, length_ATR)
			else
				ta.wma(source, length_ATR)

a = ma_function(ta.tr(true), length_ATR) * m
x = ma_function(ta.tr(true), length_ATR) * m + src1
x2 = src2 - ma_function(ta.tr(true), length_ATR) * m

PP1 = plot(pline ? x :na , title = "ATR Short Stop Loss", color= color.new(color.red,20) )
PP2 = plot(pline ? x2:na , title = "ATR Long Stop Loss",  color=color.new(color.green,20) )

Tp_to_Sl = input.float(1.5, "TP/SL")
candle_size =  input.float(10, "candle/pip")
distance_source =  input.float(1.5, "distance to midline/pip")
//strategy

buyCondition = low[2] < lower1 and  ta.crossover(close[1], lower1)  and strategy.position_size == 0 and (close[1] - open[1]) < candle_size * 0.0001 and close > open and ( basis - close) > distance_source * 0.0001

sellCondition = high[2] > upper1 and ta.crossunder(close[1], upper1)  and strategy.position_size == 0 and (open[1] - close[1]) < candle_size * 0.0001 and close < open  and (close - basis) > distance_source * 0.0001
//
buyCondition2 = low[2] < lower2 and  ta.crossover(close[1], lower2)  and (close[1] - open[1]) < candle_size * 0.0001 and close > open and ( basis - close) > distance_source * 0.0001
sellCondition2 = high[2] > upper2 and ta.crossunder(close[1], upper2)   and (open[1] - close[1]) < candle_size * 0.0001 and close < open  and (close - basis) > distance_source * 0.0001

plotshape(second_entry and  sellCondition2 ? src : na, "S", style = shape.triangledown, location =location.abovebar, color = color.rgb(241, 153, 177), size = size.tiny)
plotshape(second_entry and buyCondition2 ? src : na ,"L", style = shape.triangleup, location =  location.belowbar, color = color.rgb(177, 230, 168), size = size.tiny)
//
since_buy  =ta.barssince(buyCondition)
since_sell =ta.barssince(sellCondition)
entry_price = ta.valuewhen(buyCondition or sellCondition, src, 0)

sl_long = ta.valuewhen(buyCondition, x2[1], 0)
sl_short = ta.valuewhen(sellCondition, x[1], 0)
buyprofit = entry_price + (Tp_to_Sl*( entry_price - sl_long))
sellprofit= entry_price + (Tp_to_Sl*( entry_price - sl_short))

//alert_massage = "new strategy position is {{strategy.position_size}}"
//prof = ta.crossover(high,upper1)
//buyexit=ta.valuewhen(prof,upper1,0)

if buyCondition and inSession(timeSession)

    strategy.entry( id = "long", direction = strategy.long , alert_message='Open Long Position' )

if sellCondition and inSession(timeSession)

    strategy.entry(id= "short", direction = strategy.short, alert_message='Open Short Position')

//trail-stop loss
use_trailing = input.bool(title = 'use trailing stop loss?', defval=true)
pricestop_long=0.00
pricestop_short=100000.00
if (strategy.position_size > 0)

    if use_trailing == false
        pricestop_long := sl_long
    else
        pricestop_long := math.max (x2, pricestop_long[1]) //trail - long

if (strategy.position_size < 0)

    if use_trailing == false
        pricestop_short := sl_short
    else
        pricestop_short := math.min (x, pricestop_short[1])  // trail - short

if strategy.position_size > 0

    strategy.exit(id = 'close', limit =  buyprofit , stop = pricestop_long  )

if strategy.position_size < 0

    strategy.exit(id = 'close', limit = sellprofit  , stop = pricestop_short  )

alertcondition(buyCondition or sellCondition, 'Enter_position')