개요
이 전략은 쌍평균선의 교차점을 계산하여 가격 트렌드를 판단하고, 특정 변수 제한과 결합하여 구매 및 판매 신호를 발산한다. 크게 세 부분으로 나다. 첫째, 빠른 평균선과 느린 평균선의 교차점을 계산하여 가격 트렌드를 판단한다. 둘째, 잘못된 거래를 피하기 위해 특정 변수 제한과 결합한다. 셋째, 스톱 로스를 사용하여 위험을 통제한다.
전략 원칙
이 전략의 핵심은 빠른 평균선과 느린 평균선을 계산하는 것이다. 빠른 평균선 파라미터는 평균선 주기 중 절반으로, 반응 가격 변화에 더 민감하다. 느린 평균선 파라미터는 평균선 주기이며, 반응 가격 변화에 더 평평하다. 빠른 평균선 상에서 느린 평균선을 통과하면 가격이 상승 추세로 간주되며, 빠른 평균선 아래에서 느린 평균선을 통과하면 가격이 하향 추세로 간주된다.
또한, 전략은 잘못된 거래를 방지하기 위해 특정 파라미터를 설정한다. 결정적 ?? 값이 설정되어 있다면, 급속한 평균선 차이는 특정 범위를 초과 할 때만 거래 신호를 발송한다. 신뢰 파라미터는 변동 필터로 사용되며, 가격 변동이 특정 수준에 도달 할 때만 신호를 발송한다.
마지막으로, 전략은 중지 중지 손실을 사용하여 위험을 제어한다. openprofit은 중지 손실보다 작으면 포지션을 종료하고, 중지 점 이상의 포지션을 종료하고, 단일 손실을 효과적으로 제어한다.
우위 분석
이 전략의 가장 큰 장점은 평평선 지표가 가격 경향과 변동 특성을 판단하는 데 있습니다. 쌍평평선 교차 된 가격 경향은 고전적으로 효과적인 기술 지표 방법이며, 매개 변수가 최적화 된 후 트렌드를 정확하게 잡을 수 있습니다. 변동성 지표의 신뢰는 불안정한 시장을 효과적으로 필터링하여 빈번한 잘못된 거래를 피할 수 있습니다.
또한, 결정적 마이너스, 스톱 스톱 손실과 같은 파라미터 설정은 거래 위험을 크게 줄이고, 상하를 쫓는 것을 피할 수 있습니다.
위험 분석
이 전략의 주요 위험은 쌍평균선 지표가 잘못된 신호를 발산할 가능성이 있다는 것이다. 빠른 평균선과 느린 평균선은 모두 중화 이동 평균이며, 갑작스러운 사건에 대한 반응이 느리고, 단기 가격 반전을 놓칠 수 있다. 이 때 신뢰기준에 의존하는 이중 필터링이 필요하다.
또한, 스톱포드 스톱포드 설정이 잘못되면 위험도 증가한다. 스톱포드 너무 높거나 너무 낮은 것은 예상보다 더 많은 손실을 초래할 수 있다. 이것은 다양한 품종 특성과 변동률에 따라 합리적인 매개 변수를 설정해야 한다.
최적화 방향
이 전략은 다음과 같은 부분에서 최적화될 수 있습니다.
평평선 주기를 최적화하여 각기 다른 주기의 가격 변동을 더 잘 모델링 할 수 있도록 적응 평평선을 설정합니다.
스톱 스톱 손실의 동적 추적 장치를 설정하여 동적 변화의 스톱 스톱 손실 지점을 가능하게하기 위해 실황을 실시간으로 계산합니다.
기계학습 모델을 추가하여 가격 트렌드 방향을 판단하고, 더 많은 역사적 데이터를 사용하여 현재 가격 방향을 판단하고, 잘못된 신호를 줄입니다.
요약하다
이 전략은 전체적으로 고전적인 간단하고 효과적인 트렌드 거래 전략이다. 양평선 교차 판단 트렌드를 채택하고, 파라미터 설정을 위험 제어, 구성성이 강하며, 다종 거래에 적합하다. 기계 학습과 같은 더 지능적인 판단 수단을 도입할 수 있다면 전체적인 효과가 더 좋아서 추가 연구할 가치가 있다.
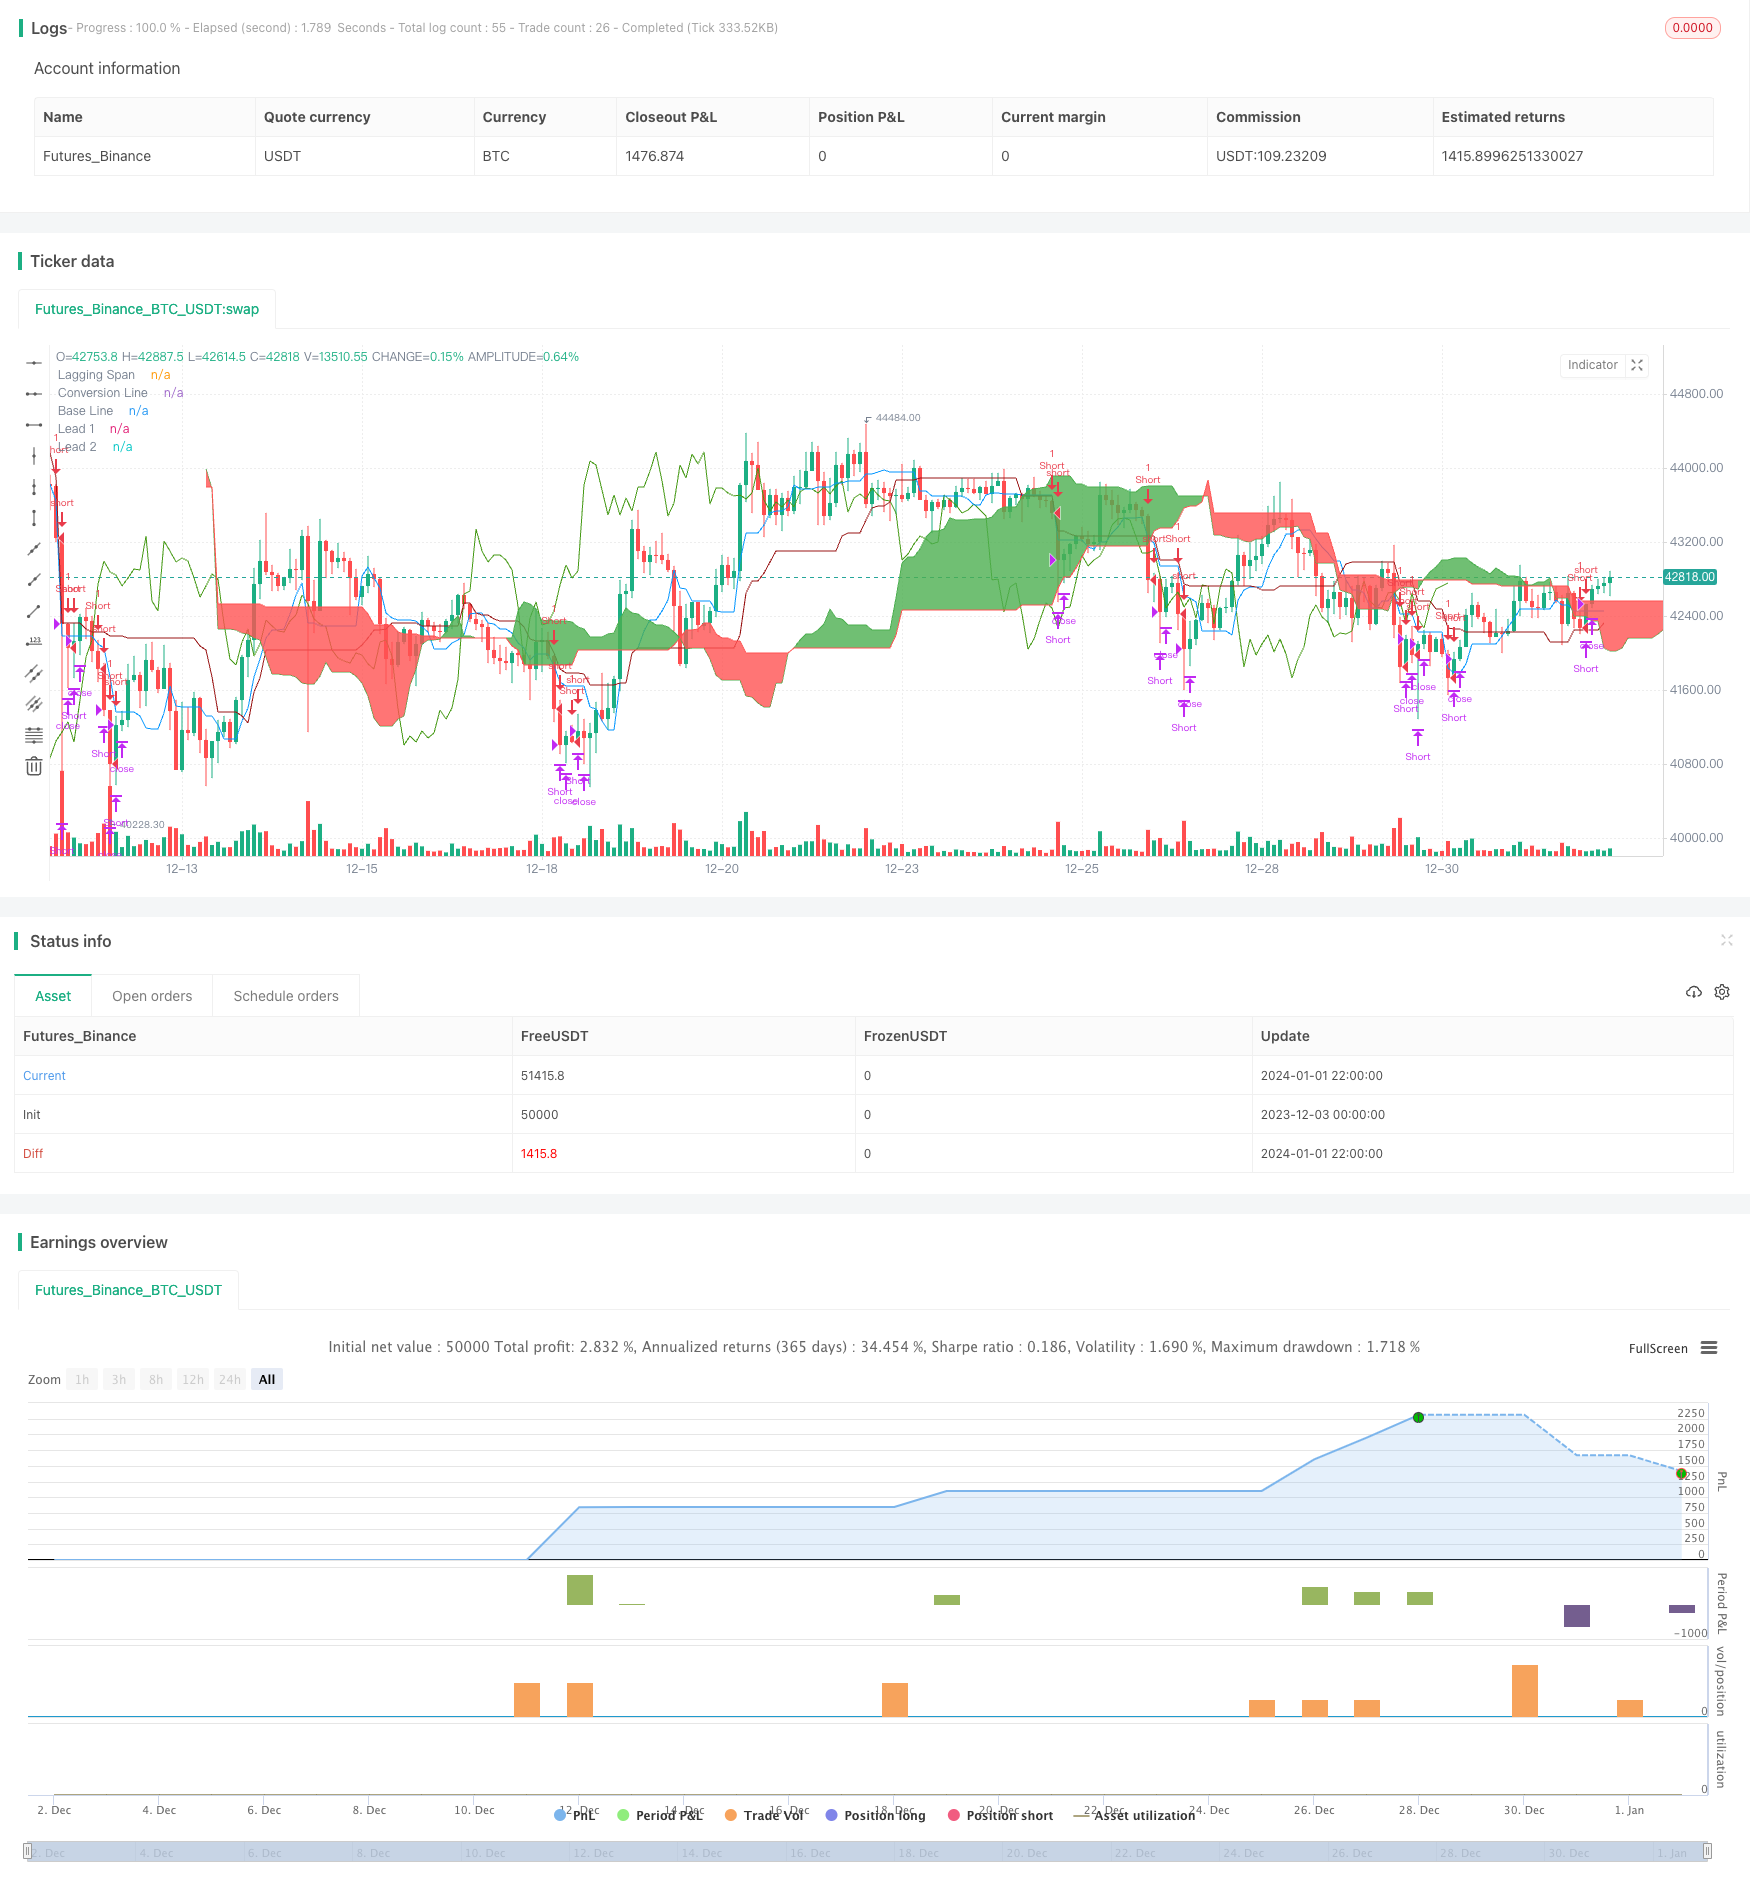
/*backtest
start: 2023-12-03 00:00:00
end: 2024-01-02 00:00:00
period: 2h
basePeriod: 15m
exchanges: [{"eid":"Futures_Binance","currency":"BTC_USDT"}]
*/

//@version=2
// Any timeFrame ok but good on 15 minute & 60 minute , Ichimoku + Daily-Candle_cross(DT) + HULL-MA_cross + MacD combination 420 special blend
strategy("Trade Signal", shorttitle="Trade Alert", overlay=true )
keh=input(title="Double HullMA",defval=14, minval=1)
dt = input(defval=0.0010, title="Decision Threshold (0.001)", type=float, step=0.0001)
SL = input(defval=-10.00, title="Stop Loss in $", type=float, step=1)
TP = input(defval=100.00, title="Target Point in $", type=float, step=1)
ot=1
n2ma=2*wma(close,round(keh/2))
nma=wma(close,keh)
diff=n2ma-nma
sqn=round(sqrt(keh))
n2ma1=2*wma(close[1],round(keh/2))
nma1=wma(close[1],keh)
diff1=n2ma1-nma1
sqn1=round(sqrt(keh))
n1=wma(diff,sqn)
n2=wma(diff1,sqn)
b=n1>n2?lime:red
c=n1>n2?green:red
d=n1>n2?red:green
confidence=(request.security(syminfo.tickerid, '5', close[1])-request.security(syminfo.tickerid, '60', close[1]))/request.security(syminfo.tickerid, '60', close[1])
conversionPeriods = input(9, minval=1, title="Conversion Line Periods")
basePeriods = input(26, minval=1, title="Base Line Periods")
laggingSpan2Periods = input(52, minval=1, title="Lagging Span 2 Periods")
displacement = input(26, minval=1, title="Displacement")
donchian(len) => avg(lowest(len), highest(len))
conversionLine = donchian(conversionPeriods)
baseLine = donchian(basePeriods)
leadLine1 = avg(conversionLine, baseLine)
leadLine2 = donchian(laggingSpan2Periods)
LS=close, offset = -displacement
MACD_Length = input(9)
MACD_fastLength = input(12)
MACD_slowLength = input(26)
MACD = ema(close, MACD_fastLength) - ema(close, MACD_slowLength)
aMACD = ema(MACD, MACD_Length)
closelong = n1<n2 and close<n2 and confidence<dt or strategy.openprofit<SL or strategy.openprofit>TP
if (closelong)
    strategy.close("Long")
closeshort = n1>n2 and close>n2 and confidence>dt or strategy.openprofit<SL or strategy.openprofit>TP
if (closeshort)
    strategy.close("Short")
longCondition = n1>n2 and strategy.opentrades<ot and confidence>dt and close>n2 and leadLine1>leadLine2 and open<LS and MACD>aMACD
if (longCondition)
    strategy.entry("Long",strategy.long)
shortCondition = n1<n2 and strategy.opentrades<ot and confidence<dt and close<n2 and leadLine1<leadLine2 and open>LS and MACD<aMACD
if (shortCondition)
    strategy.entry("Short",strategy.short)

//alerts
alertcondition(closelong, title='Close Buy Position', message='Close Buy Position')
alertcondition(closeshort, title='Close Short Position', message='Close Short Position')
alertcondition(longCondition, title='Buy Signal', message='Buy Signal Alert')
alertcondition(shortCondition, title='Sell Signal', message='Sell Signal Alert')

//a1=plot(n1,color=c)
//a2=plot(n2,color=c)plot(cross(n1, n2) ? n1 : na, style = circles, color=b, linewidth = 4)
//plot(cross(n1, n2) ? n1 : na, style = line, color=d, linewidth = 4)
plot(conversionLine, color=#0496ff, title="Conversion Line")
plot(baseLine, color=#991515, title="Base Line")
plot(close, offset = -displacement, color=#459915, title="Lagging Span")
p1=plot (leadLine1, offset = displacement, color=green,  title="Lead 1")
p2=plot (leadLine2, offset = displacement, color=red,  title="Lead 2")
fill(p1, p2, color = leadLine1 > leadLine2 ? green : red)
// remove the "//" from before the plot script if want to see the indicators on chart