개요
양이동 전략은 거래량의 변화를 분석하여 시장 참가자의 감정의 빈도 변화를 판단한다. 거래량을 다단 거래량과 빈도 거래량으로 나누고, 그들의 가중 이동 평균을 계산하여, 다단 거래량이 우수할 때 여러 개의 신호를 발생시키고, 빈도 거래량이 우수할 때 빈도 신호를 발생시킨다.
전략 원칙
이 전략은 먼저 종식 가격과 개시 가격의 관계에 따라 각 K 선의 거래량을 다단 거래량과 공백 거래량으로 나다. 종식 가격이 개시 가격보다 크면 전체 K 선의 거래량은 다단 거래량이다. 종식 가격이 개시 가격보다 작으면 ((최고의 가격-개시 가격) / ((최고의 가격-최저 가격) 의 비율에 따라 K 선의 다단 거래량을 계산하고 나머지는 공백 거래량이다.
다음으로 마지막 n 루트 K 선의 다중 헤드 거래량과 빈 헤드 거래량의 가중 이동 평균을 각각 계산한다. 다중 헤드 거래량의 이동 평균이 빈 헤드 거래량의 이동 평균보다 크며, 둘의 차이는 다중 헤드 거래량의 비율이 미리 설정된 문턱보다 크면, 다중 헤드 신호가 생성된다. 빈 헤드 신호의 생성 규칙은 비슷하다.
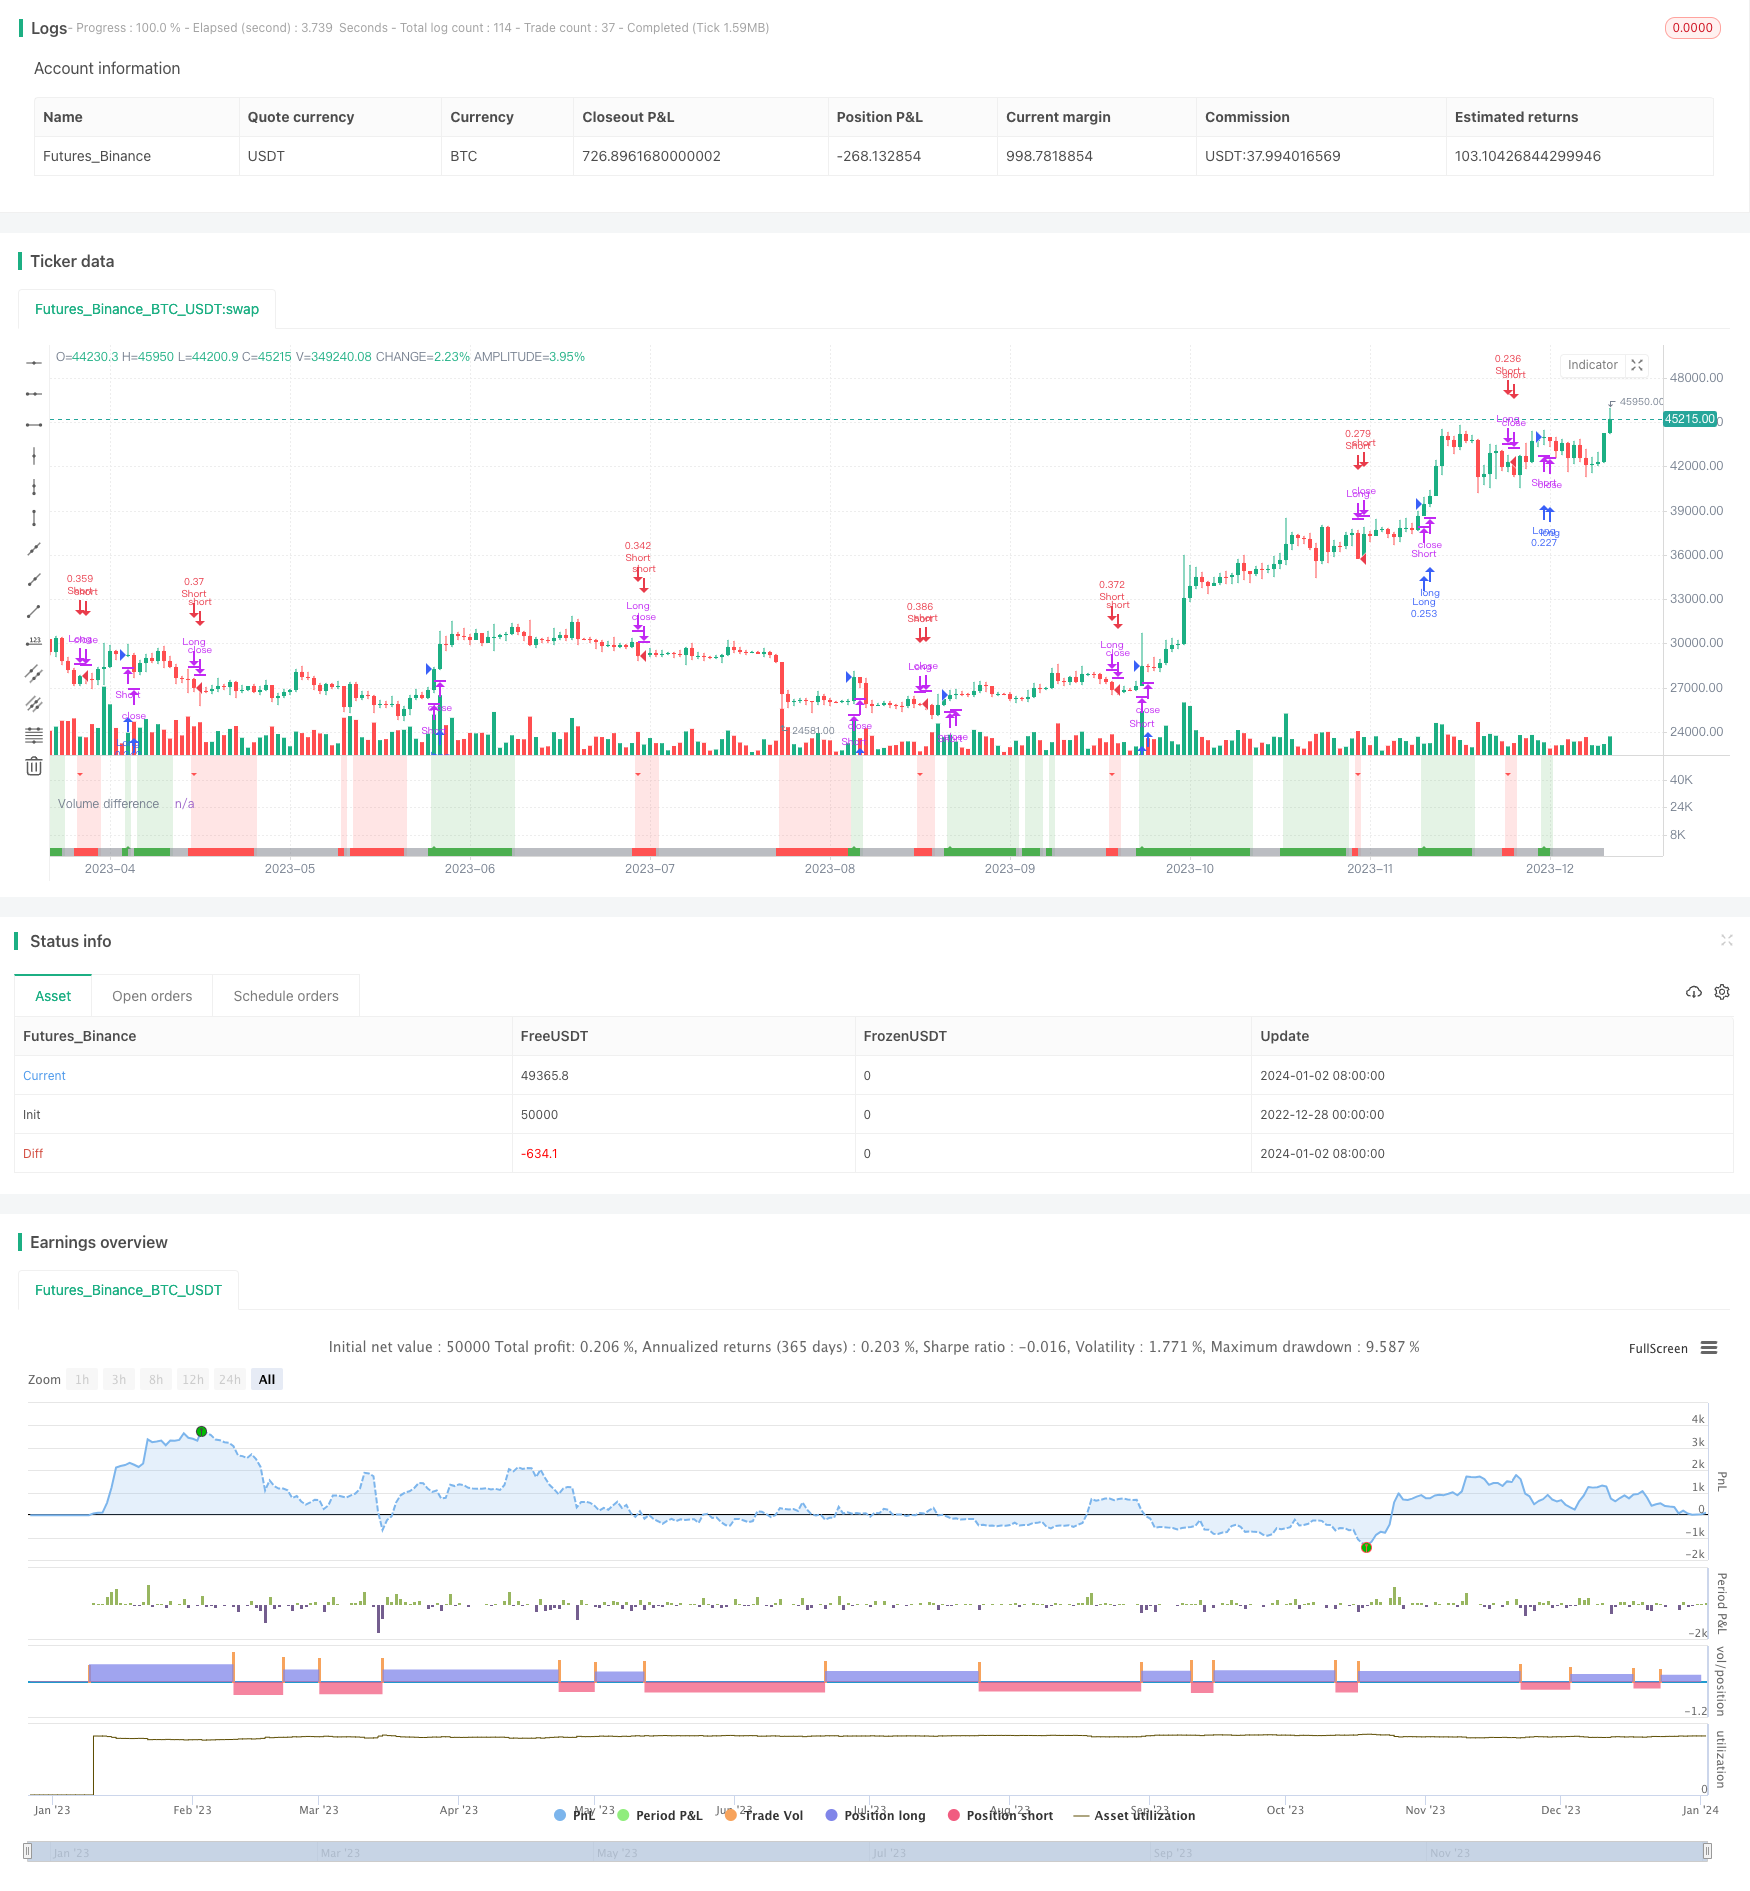
또한 거래량 평균값을 설정하여 회수 지역을 식별한다. 공백 거래량이 눈에 띄는 차이가 없다면 현재 회수 상태에 있음을 알려줍니다.
우위 분석
- 거래량 정보를 사용하여 시장 참여자의 감정을 판단하고, 신호를 생성하는 데 이론적 근거가 있습니다.
- 중요한 신호를 놓치지 않도록 자동으로 조정 영역을 인식합니다.
- 다양한 거래 종류와 시간 주기에 맞는 사용자 정의 가능한 매개 변수
- 다중 헤드 및 공백 신호를 개별적으로 판단할 수 있고, 단방향 신호만 따라갈 수 있습니다.
위험 분석
- 거래량 데이터가 조작될 가능성이 있다
- 모든 품종에 적합하지 않을 수 있으며 최적화가 필요합니다.
- 정렬 인식 파라미터가 잘못 설정되어 신호를 놓칠 수 있습니다.
- 짧은 기간 동안 잘못된 신호가 발생할 수 있습니다.
매개 변수 최적화, 다른 지표의 조합 등의 방법으로 위험을 줄일 수 있다.
최적화 방향
- 거래량을 계산하는 다른 방법을 테스트합니다.
- EMA, SMMA 등과 같은 다른 이동 평균을 시도해 보세요.
- 평균을 계산하는 최적의 주기 변수
- 정렬된 거래량 차이 변수를 최적화
- 다른 기술 지표와 결합하여 필터링 신호
요약하다
양력 드라이브 전략은 거래량의 다공간 분포를 지능적으로 판단하여 시장 정서 및 추세 변화를 자동으로 판단하여 단독으로 사용할 수 있으며 다른 전략과 결합 할 수 있습니다. 매개 변수 최적화 및 지표 조합은 전략의 안정성과 수익성을 더욱 향상시킬 수 있습니다.
/*backtest
start: 2022-12-28 00:00:00
end: 2024-01-03 00:00:00
period: 1d
basePeriod: 1h
exchanges: [{"eid":"Futures_Binance","currency":"BTC_USDT"}]
*/

// This source code is subject to the terms of the Mozilla Public License 2.0 at https://mozilla.org/MPL/2.0/
// © Shuttle_Club
//@version=5

strategy('Volume fight strategy', default_qty_type=strategy.cash, default_qty_value=10000, currency='USD', commission_value=0.04, calc_on_order_fills=false, calc_on_every_tick=false, initial_capital=10000)

direction = input.string('ANY', 'Direction', options=['LONG', 'SHORT', 'ANY'], tooltip='Select the direction of trade.\n\nВыберите направление торговли.')
ma = input.int(11, 'Search_range', minval=1, tooltip='The range of estimation of the predominance of bullish or bearish volume (quantity bars). The smaller the TF, the higher the range value should be used to filter out false signals.\n\nДиапазон оценки преобладания бычьего или медвежьего объема (количество баров). Чем меньше ТФ, тем выше следует использовать значение диапазона, чтобы отфильтровать ложные сигналы.')
delta = input.float(15, 'Smoothing_for_flat,%', step=0.5, minval=0, tooltip='Smoothing to reduce false signals and highlight the flat zone. If you set the percentage to zero, the flat zones will not be highlighted, but there will be much more false signals, since the indicator becomes very sensitive when the smoothing percentage decreases.\n\nСглаживание для уменьшения ложных сигналов и выделения зоны флета. Если выставить процент равным нулю, то зоны флета выделяться не будут, но будет гораздо больше ложных сигналов, так как индикатор становится очень чувствительным при снижении процента сглаживания')
bgshow = input.bool(true, 'Show background zones', tooltip='Show the color background of the current trading zone.\n\nПоказывать цветовой фон текущей торговой зоны.')
all_signal_show = input.bool(false, 'Show each setup in zone', tooltip='Show every signals into trading zone.\n\nПоказывать каждый сигнал внутри торговой зоны.')

/////   CALCULATION
bull_vol = open < close ? volume : volume * (high - open) / (high - low)  //determine the share of bullish volume
bear_vol = open > close ? volume : volume * (open - low) / (high - low)  //determine the share of bearish volume
avg_bull_vol = ta.vwma(bull_vol, ma)  //determine vwma
avg_bear_vol = ta.vwma(bear_vol, ma)
diff_vol = ta.sma(avg_bull_vol / volume - 1 - (avg_bear_vol / volume - 1), ma)  //normalize and smooth the values
vol_flat = math.abs(avg_bull_vol + avg_bear_vol) / 2  //determine average value for calculation flat-filter

/////   SIGNALS
up = int(na), up := nz(up[1])
dn = int(na), dn := nz(dn[1])
bull = avg_bull_vol > avg_bear_vol and vol_flat / avg_bull_vol < 1 - delta / 100  //determine up zones
bear = avg_bull_vol < avg_bear_vol and vol_flat / avg_bear_vol < 1 - delta / 100  //determine dn zones

if bull
    up += 1, dn := 0
    dn
if bear
    dn += 1, up := 0
    up
if not bull and not bear and all_signal_show
    up := 0, dn := 0
    dn

/////   PLOTTING
plotshape(bull and up == 1, 'UP', location=location.bottom, style=shape.triangleup, color=color.new(color.green, 0), size=size.tiny)
plotshape(bear and dn == 1, 'DN', location=location.top, style=shape.triangledown, color=color.new(color.red, 0), size=size.tiny)
bgcolor(title='Trading zones', color=bgshow and avg_bull_vol > avg_bear_vol and vol_flat / avg_bull_vol < 1 - delta / 100 ? color.new(color.green, 85) : bgshow and avg_bull_vol < avg_bear_vol and vol_flat / avg_bear_vol < 1 - delta / 100 ? color.new(color.red, 85) : na)
plot(diff_vol, 'Volume difference', style=plot.style_area, color=avg_bull_vol > avg_bear_vol and vol_flat / avg_bull_vol < 1 - delta / 100 ? color.new(color.green, 0) : avg_bull_vol < avg_bear_vol and vol_flat / avg_bear_vol < 1 - delta / 100 ? color.new(color.red, 0) : color.new(color.gray, 50))

strategy.close('Short', comment='close', when=bull and up == 1)
strategy.close('Long', comment='close', when=bear and dn == 1)
strategy.entry('Long', strategy.long, when=direction != 'SHORT' and bull and up == 1)
strategy.entry('Short', strategy.short, when=direction != 'LONG' and bear and dn == 1)

if bull and up==1
    alert('Bullish movement! LONG trading zone', alert.freq_once_per_bar_close)
if bear and dn==1
    alert('Bearish movement! SHORT trading zone', alert.freq_once_per_bar_close)