개요
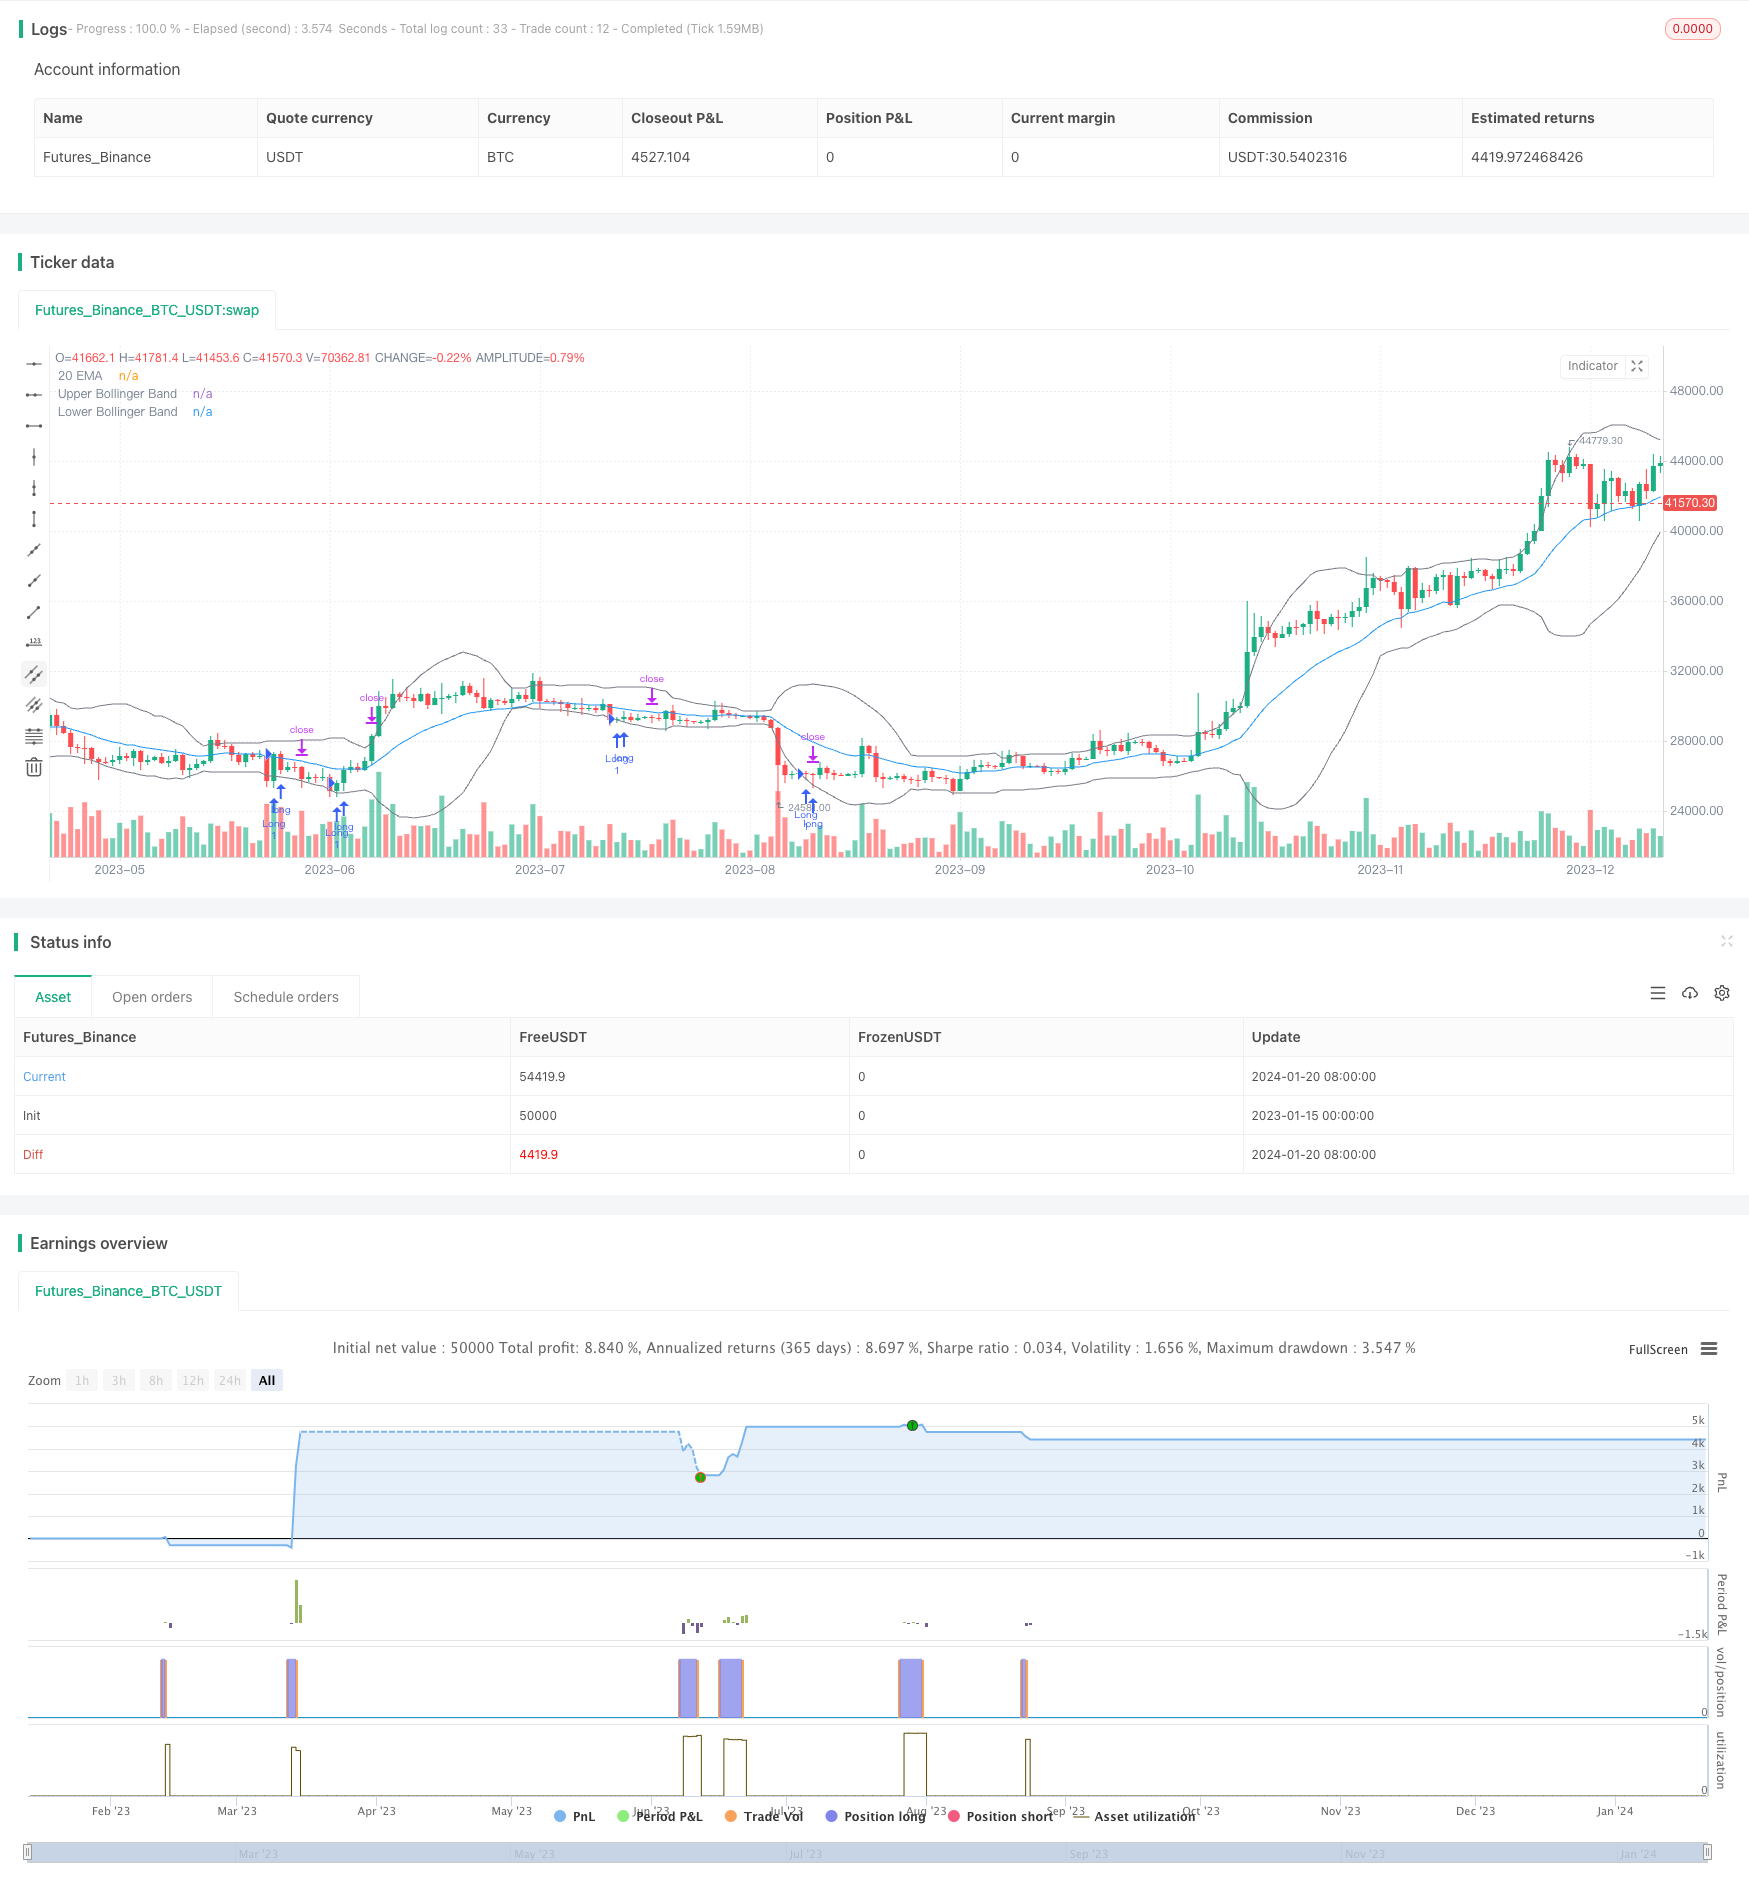
이 전략은 부린 띠 통로의 회귀 돌파 전략에 기초한다. 가격이 부린 띠 통로의 하향 궤도를 넘어갈 때, 장거리 입장을 취한다.
전략 원칙
이 전략은 20주기의 린 띠 통로를 사용한다. 린 띠 통로는 중도, 상도, 하도로 구성된다. 중도는 20주기의 간단한 이동 평균이며, 상도는 중도 더하기 표준 차이의 2배로 구성되며, 하도는 중도 빼기 표준 차이의 2배로 구성된다.
가격이 하락할 때, 가격이 초매 상태에 들어간 것을 나타냅니다. 이 때 장점 입장이 수행됩니다. 입장 후, 중지 가격은 입구 때 K 선의 최저 가격으로 설정되며, 정지 목표는 브린 밴드입니다. 이렇게, 전략은 가격이 초매 상태에서 평행선으로 돌아오는 과정을 쫓아 수익을 창출하는 것입니다.
전략적 강점 분석
이 전략은 다음과 같은 장점을 가지고 있습니다.
- 부린 벨트 채널을 이용하여 시장의 과매매 현상을 판단하는 데에는 시간적 효과가 있습니다.
- ‘docname’의 추종을 피하기 위해 거래 전략으로 돌아갑니다.
- 정지지점 설정이 합리적이고 위험 조절에 도움이 됩니다.
위험 분석
이 전략에는 몇 가지 위험도 있습니다.
- 부린띠는 가격 동향을 완벽하게 판단할 수 없으며, 하락한 가격이 반드시 반발하지 않을 수 있습니다.
- 대시장이 계속 하락하면 Floating P/L이 먼저 스톱로드를 유발할 수 있습니다.
- 정지 지점은 상반도에 가깝고, 정지 비용이 너무 높을 위험이 있다.
전략 최적화 방향
이 전략은 다음과 같은 부분에서 최적화될 수 있습니다.
- 브린 띠 변수를 최적화하여 최적의 변수 조합을 찾습니다.
- 다른 지표 필터 신호를 추가하여 진입 정확도를 향상시킵니다.
- 스톱스트로드 전략을 최적화하여 수익률을 높여라
요약하다
이 전략은 전체적인 아이디어는 명확하고 어느 정도 동작성이 있다. 그러나 브린띠를 이용하여 과매매를 판단하는 시간효율은 높지 않으며, 가격 경향을 완벽하게 판단할 수 없다. 또한, 중지 중지 손실 메커니즘도 최적화되어야 한다. 이후에는 보다 정확한 지표, 최적화 파라미터 및 중지 중지 손실 메커니즘을 개선하는 측면에서 최적화하여 전략 수익성을 향상시킬 수 있다.
전략 소스 코드
/*backtest
start: 2023-01-15 00:00:00
end: 2024-01-21 00:00:00
period: 1d
basePeriod: 1h
exchanges: [{"eid":"Futures_Binance","currency":"BTC_USDT"}]
*/

// This source code is subject to the terms of the Mozilla Public License 2.0 at https://mozilla.org/MPL/2.0/
// © Ronsword
//@version=5

strategy("bb 2ND target", overlay=true)

// STEP 1. Create inputs that configure the backtest's date range
useDateFilter = input.bool(true, title="Filter Date Range of Backtest",
     group="Backtest Time Period")
backtestStartDate = input(timestamp("1 Jan 1997"),
     title="Start Date", group="Backtest Time Period",
     tooltip="This start date is in the time zone of the exchange " +
     "where the chart's instrument trades. It doesn't use the time " +
     "zone of the chart or of your computer.")
backtestEndDate = input(timestamp("1 Sept 2023"),
     title="End Date", group="Backtest Time Period",
     tooltip="This end date is in the time zone of the exchange " +
     "where the chart's instrument trades. It doesn't use the time " +
     "zone of the chart or of your computer.")

// STEP 2. See if the current bar falls inside the date range
inTradeWindow = true

// Bollinger Bands inputs
length = input.int(20, title="Bollinger Bands Length")
mult = input.float(2.0, title="Multiplier")
src = input(close, title="Source")
basis = ta.sma(src, length)
dev = mult * ta.stdev(src, length)
upper = basis + dev
lower = basis - dev

// EMA Settings
ema20 = ta.ema(close, 20)
plot(ema20, color=color.blue, title="20 EMA")

// Entry condition
longEntryCondition = ta.crossover(close, lower)

// Define stop loss level as the low of the entry bar
var float stopLossPrice = na
if longEntryCondition
    stopLossPrice := low

// Top Bollinger Band itself is set as the target
topBandTarget = upper

// Enter long position when conditions are met
if inTradeWindow and longEntryCondition
    strategy.entry("Long", strategy.long, qty=1)

// Set profit targets
strategy.exit("ProfitTarget2", from_entry="Long", limit=topBandTarget)

// Set stop loss
strategy.exit("StopLoss", stop=stopLossPrice)

// Plot Bollinger Bands with the same gray color
plot(upper, color=color.gray, title="Upper Bollinger Band")
plot(lower, color=color.gray, title="Lower Bollinger Band")