개요
이 전략은 무작위 지표 RSI, 이동 평균 SMA, 그리고 중장 이동 평균 WMA를 결합하여 구매/판매 신호를 찾습니다. 이는 동시에 5분 및 1시간 시간 프레임에서 트렌드 방향을 판단합니다. 안정된 트렌드에서, 빠른 라인 RSI가 느린 라인을 넘어서거나 넘어서면 거래 신호가 발생합니다.
전략 원칙
이 전략은 먼저 1시간 5분 두 시간 프레임에서 각각 144주기 중화 이동 평균 (WMA) 과 5주기 단순 이동 평균 (SMA) 을 계산한다. 5분 SMA가 WMA 위에 있을 때만 다면 시장으로 간주된다. 그 다음 전략은 RSI의 다공간 지표, 그리고 그에 따른 K선과 D선을 계산한다. K선이 오버 바이 지역 아래의 D선을 통과하면 매출 신호가 발생하고, K선이 오버 바이 지역 상의 D선을 통과하면 매출 신호가 발생한다.
우위 분석
이것은 매우 효과적인 트렌드 추적 전략이다. 그것은 동시에 두 시간 프레임 판단 트렌드를 결합하고, 매우 효과적으로 잘못된 신호를 감소시킨다. 또한, 그것은 RSI, SMA 및 WMA를 포함한 여러 지표의 필터링을 결합하여 신호를 더 신뢰할 수 있게 한다. RSI가 KDJ를 구동하도록 함으로써, 그것은 또한 일반 KDJ 전략에서 쉽게 발생하는 가짜 신호 문제를 수정한다. 또한, 이 전략에는 수익을 잠금하기 위해 스톱 및 손실을 중지하는 설정이 있으며, 위험을 효과적으로 제어 할 수 있다.
위험 분석
이 전략의 가장 큰 위험은 트렌드 판단 오류에 있다. 시장의 전환점에서 단기 및 장기 평균이 동시에 상승 또는 하락하여 잘못된 신호를 생성할 수 있다. 또한, 불안정한 시장에서 RSI는 더 많은 얽혀있는 거래 신호를 생성할 수 있다. 그러나 이러한 위험은 SMA 및 WMA 주기와 RSI 파라미터를 적절히 조정하여 감소시킬 수 있다.
최적화 방향
이 전략은 다음과 같은 부분에서 최적화될 수 있습니다. 1) 다양한 길이의 SMA, WMA, RSI를 테스트하여 최적의 변수 조합을 찾습니다. 2) MACD, 브린 라인 등과 같은 다른 지표 판단을 추가하여 신호 신뢰성을 검증합니다. 3) 손실을 막는 전략을 최적화하고, 고정 비율의 손실을 테스트하고, 잔액 슬라이드 포인트 손실을 멈추고, 손실을 추적하는 방법 4) 자금 관리 모듈에 가입하여 개별 투자 규모와 전반적인 리스크 을 제어합니다. 5) 기계 학습 알고리즘을 추가하여 대량의 테스트를 통해 가장 좋은 성능을 보이는 변수를 찾아내는 것
요약하다
이 전략은 이동 평균과 무작위 지표의 장점을 최대한 활용하여 신뢰할 수 있는 트렌드 추적 시스템을 구축합니다. 여러 시간 프레임과 지표의 검증을 통해 중·장선 트렌드의 방향을 성공적으로 잡을 수 있습니다. 동시에 손해 중지 설정은 시장의 흔들림에 어느 정도 견딜 수 있습니다. 그러나 더 많은 지표의 결합 테스트, 기계 학습 방법을 도입하여 최적의 변수를 찾는 것과 같은 개선의 여지가 있습니다.
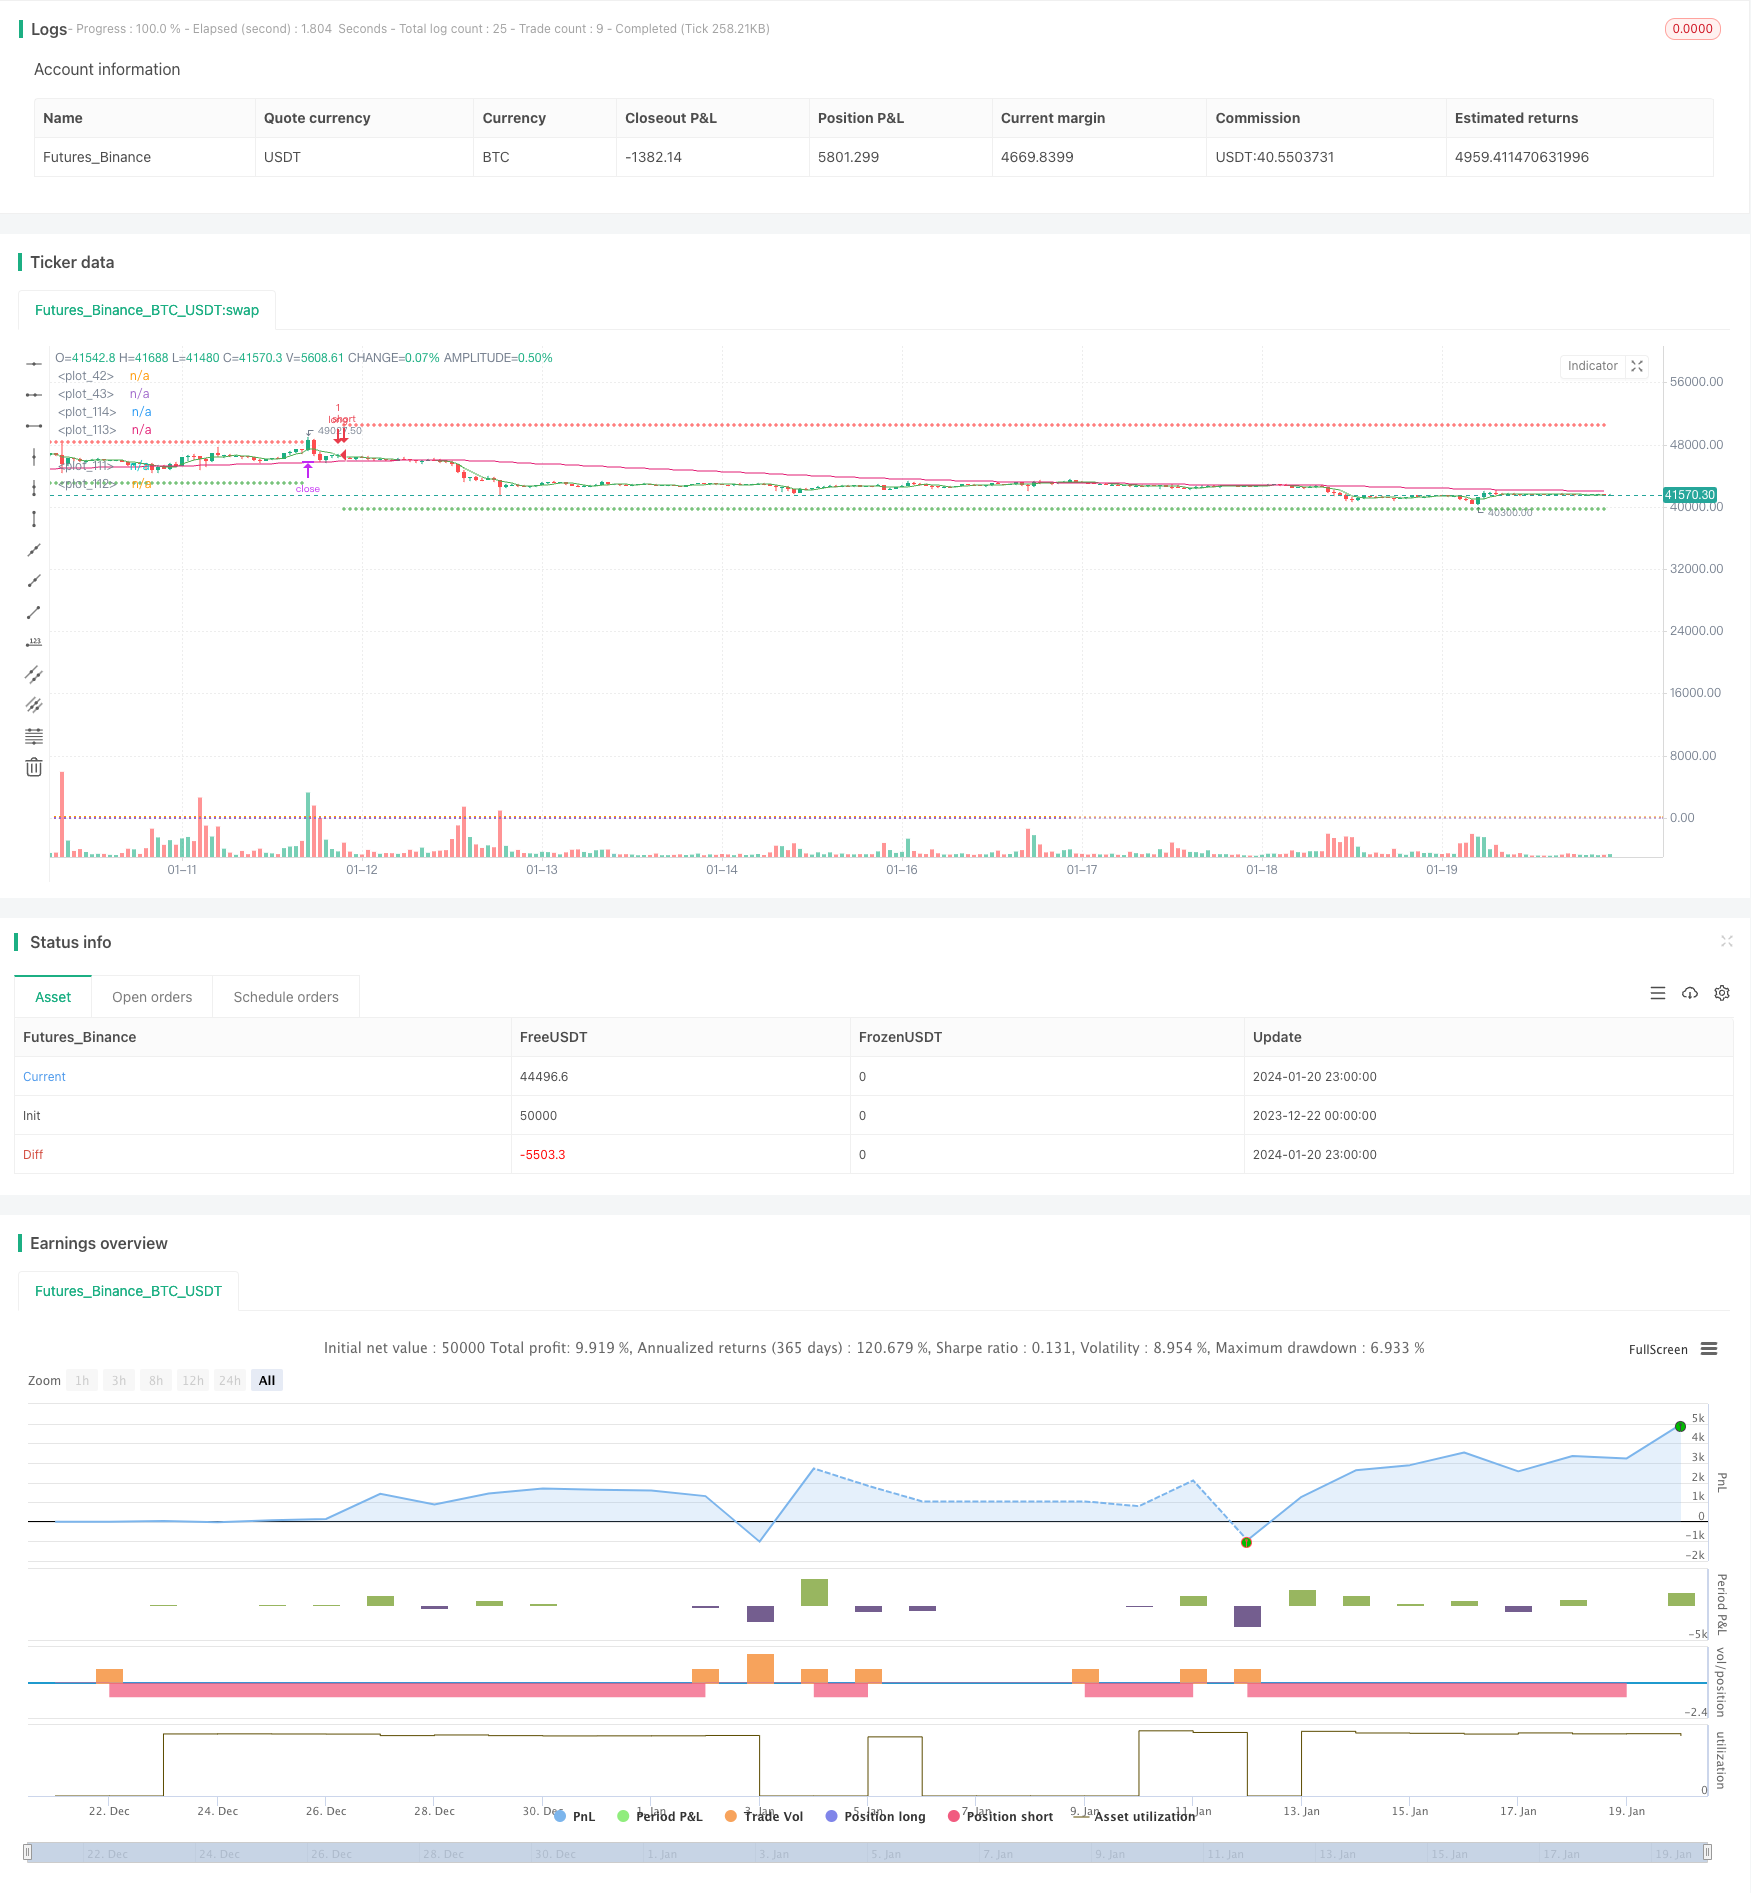
/*backtest
start: 2023-12-22 00:00:00
end: 2024-01-21 00:00:00
period: 1h
basePeriod: 15m
exchanges: [{"eid":"Futures_Binance","currency":"BTC_USDT"}]
*/

// This source code is subject to the terms of the Mozilla Public License 2.0 at https://mozilla.org/MPL/2.0/
// © bufirolas

// Works well with a wide stop with 20 bars lookback
// for the SL level and a 2:1 reward ratio Take Profit .
// These parameters can be modified in the Inputs section of the strategy panel.

// "an entry signal it's a cross down or up on
// the stochastics. if you're in a downtrend
// on the hourly time frame you
// must also be in a downtrend on the five
// minute so the five period has to be below the 144
// as long as the five period is still trading below
// the 144 period on both the hourly and the five minutes
// we are looking for these short signals crosses down
// in the overbought region of the stochastic. Viceversa for longs"

//@version=4
strategy("Stoch + WMA + SMA strat", overlay=true)

//SL & TP Inputs
i_SL=input(true, title="Use Swing Lo/Hi Stop Loss & Take Profit")
i_SwingLookback=input(20, title="Swing Lo/Hi Lookback")
i_SLExpander=input(defval=10, step=1, title="SL Expander")
i_TPExpander=input(defval=30, step=1, title="TP Expander")
i_reverse=input(false, title="Reverse Trades")
i_TStop =input(false, title="Use Trailing Stop")

//Strategy Inputs
src4 = input(close, title="RSI Source")
stochOS=input(defval=20, step=5, title="Stochastics Oversold Level")
stochOB=input(defval=80, step=5, title="Stochastics Overbought Level")

//Stoch rsi Calculations
smoothK = input(3, minval=1)
smoothD = input(3, minval=1)
lengthRSI = input(14, minval=1)
lengthStoch = input(14, minval=1)
rsi1 = rsi(src4, lengthRSI)
k = sma(stoch(rsi1, rsi1, rsi1, lengthStoch), smoothK)
d = sma(k, smoothD)
h0 = hline(80, linestyle=hline.style_dotted)
h1 = hline(20, linestyle=hline.style_dotted)

//MA
wmalen=input(defval=144, title="WMA Length")
WMA = security(syminfo.tickerid, "60", wma(close, wmalen))
SMA = security(syminfo.tickerid, "60", sma(close, 5))
minWMA = wma(close, wmalen)
minSMA = sma(close, 5)

//Entry Logic
stobuy = crossover(k, d) and k < stochOS
stosell = crossunder(k, d) and k > stochOB
mabuy = minSMA > minWMA
daymabuy = SMA > WMA

//SL & TP Calculations
SwingLow=lowest(i_SwingLookback)
SwingHigh=highest(i_SwingLookback)
bought=strategy.position_size != strategy.position_size[1]
LSL=valuewhen(bought, SwingLow, 0)-((valuewhen(bought, atr(14), 0)/5)*i_SLExpander)
SSL=valuewhen(bought, SwingHigh, 0)+((valuewhen(bought, atr(14), 0)/5)*i_SLExpander)
lTP=(strategy.position_avg_price + (strategy.position_avg_price-(valuewhen(bought, SwingLow, 0)))+((valuewhen(bought, atr(14), 0)/5)*i_TPExpander))
sTP=(strategy.position_avg_price - (valuewhen(bought, SwingHigh, 0) - strategy.position_avg_price))-((valuewhen(bought, atr(14), 0)/5)*i_TPExpander)
islong=strategy.position_size > 0
isshort=strategy.position_size < 0

//TrailingStop
dif=(valuewhen(strategy.position_size>0 and strategy.position_size[1]<=0, high,0))
 -strategy.position_avg_price
trailOffset     = strategy.position_avg_price - LSL
var tstop = float(na)
if strategy.position_size > 0
    tstop := high- trailOffset - dif
    if tstop<tstop[1]
        tstop:=tstop[1]
else
    tstop := na
StrailOffset     = SSL - strategy.position_avg_price
var Ststop = float(na)
Sdif=strategy.position_avg_price-(valuewhen(strategy.position_size<0
 and strategy.position_size[1]>=0, low,0))
if strategy.position_size < 0
    Ststop := low+ StrailOffset + Sdif
    if Ststop>Ststop[1]
        Ststop:=Ststop[1]
else
    Ststop := na

//Stop Selector
SL= islong ? LSL : isshort ? SSL : na
if i_TStop
    SL:= islong ? tstop : isshort ? Ststop : na
TP= islong ? lTP : isshort ? sTP : na


//Entries
if stobuy and mabuy and daymabuy
    strategy.entry("long", long=not i_reverse?true:false)
if stosell and not mabuy and not daymabuy
    strategy.entry("short", long=not i_reverse?false:true)


//Exit
if i_SL
    strategy.exit("longexit", "long", stop=SL, limit=TP)
    strategy.exit("shortexit", "short", stop=SL, limit=TP)

//Plots
plot(i_SL ? SL : na, color=color.red, style=plot.style_cross)
plot(i_SL ? TP : na, color=color.green, style=plot.style_cross)
plot(minWMA)
plot(minSMA, color=color.green)