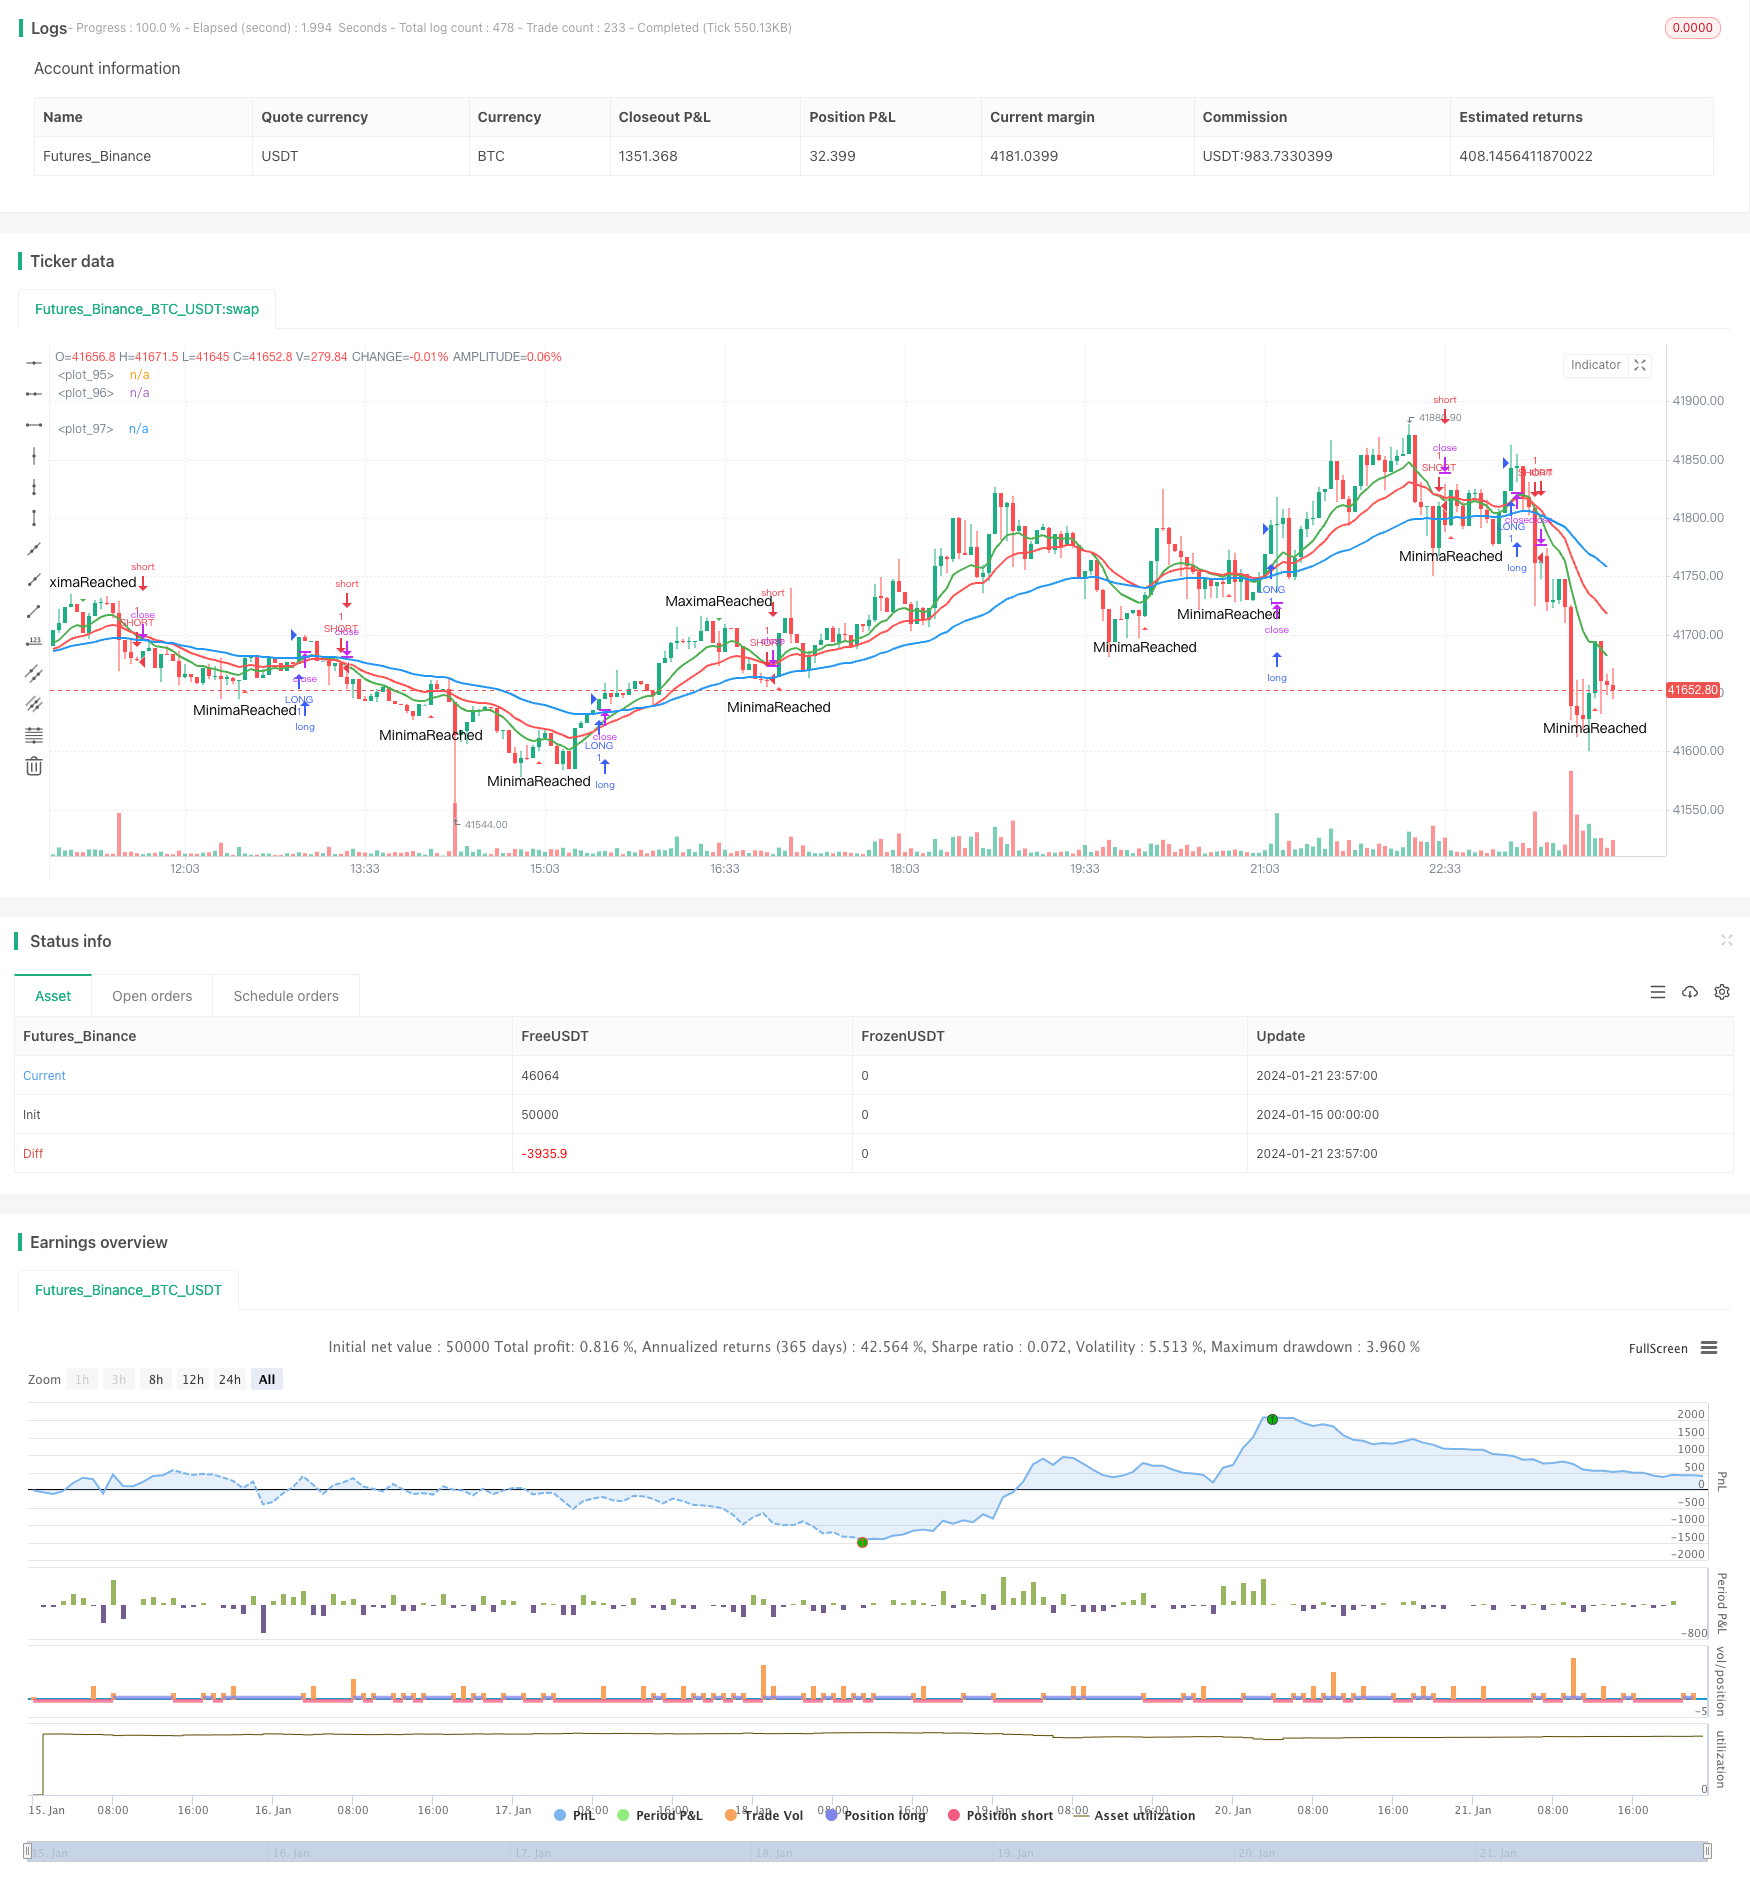
개요
이 전략은 서로 다른 주기의 EMA 평균선의 교차를 기반으로 트렌드 방향을 판단하고, 이에 따라 다중 하위 거래 신호를 구축한다. 주로 2개의 평균선을 사용한다. 각각 10일선과 20일선이다. 10일선이 위아래로 20일선을 통과할 때, 하위 거래한다. 10일선이 아래에서 위아래로 20일선을 통과할 때, 더 많은 거래한다. 이 전략은 중간에 있는 짧은 거래 전략이다.
전략 원칙
이 전략은 2개의 EMA 평균선을 사용한다. 10일선과 20일선이다. EMA 평균선은 가격의 트렌드 방향을 잘 반영한다. 단기 EMA 라인이 아래에서 위쪽으로 긴 EMA 라인을 통과하면 가격 움직임이 하향에서 상승하는 것을 나타냅니다.
이 전략은 변동의 극대값과 극소값을 동시에 결합하여 거래 신호의 일부를 필터링한다. 거래 신호는 가격 변동이 특정 범위에 도달한 후에만 발송된다. 이것은 일부 가짜 신호를 어느 정도 필터링 할 수 있다.
구체적으로, 이 전략은 가격의 극한값과 극한값이 도달하는 시간을 추적하여 가격 트렌드가 형성되었는지 판단합니다. 극한값 또는 극한값이 특정 시간을 달성한 후에야 진정한 거래 신호가 발송됩니다.
전략적 강점 분석
이 전략에는 다음과 같은 장점이 있습니다.
- EMA 평균선을 사용하여 트렌드 방향을 판단하여 시장 움직임을 효과적으로 추적할 수 있습니다.
- 다양한 주기의 EMA 평균선과 결합하여 중간과 짧은 선에서 거래 기회를 잡을 수 있습니다.
- 극한 필터링을 통해 일부 잡음을 필터링하여 거래 기회를 놓치지 않도록하십시오.
- 전략 논리는 간단하고 명확하며 이해하기 쉽고 수정할 수 있습니다.
- 다양한 품종과 거래 선호도에 따라 변수를 조정할 수 있으며, 적응력이 강합니다.
전략적 위험 분석
이 전략에는 몇 가지 위험도 있습니다.
- EMA 평균선 자체는 지연성이 있으며, 단기 가격 반전을 놓칠 수 있습니다.
- 노이즈 신호 필터링이 완전하지 않으며, 일부 잘못된 거래가 있을 수 있습니다.
- 다른 시장 환경에 맞게 매개 변수를 적절히 조정해야 합니다.
위험은 다음과 같은 방법으로 줄일 수 있습니다.
- 다른 지표와 결합하여 신호 확인을 하여 EMA 평균선 지연 문제를 피하십시오.
- 극도 필터링 조건을 최적화하여 신호의 신뢰성을 향상시킵니다.
- 피드백 결과에 따라 변수를 조정하고, 최적화 전략
전략 최적화 방향
이 전략은 다음과 같은 방향으로 더 개선될 수 있습니다.
- 다른 기술 지표 포트폴리오를 추가하여 거래 신호의 정확도를 향상시킵니다. 예를 들어 MACD, KD 등.
- EMA 평균선의 파라미터를 최적화하여 특정 품종에 더 잘 적응하도록 한다.
- 가격 변동에 대한 판단을 개선하기 위해 극대에서 극소까지의 변수를 최적화하십시오.
- 한 거래의 최대 손실을 제어하기 위해 Stop Loss 전략이 추가되었습니다.
- 이 전략은 다양한 품종을 대상으로 테스트를 실시하여 그 적합성을 평가합니다.
요약하다
이 EMA 교차 전략은 전체적으로 간단하고 실용적인 트렌드 추적 전략이다. 이 전략은 EMA 평균을 사용하여 큰 트렌드 방향을 판단하고, 가격 변동 필터 신호와 결합하여 거래 결정을 형성한다. 이 전략은 쉽게 이해하고 파라미터를 조정할 수 있으며, 중간에 짧은 라인 거래를 적용할 수 있다.
/*backtest
start: 2024-01-15 00:00:00
end: 2024-01-22 00:00:00
period: 3m
basePeriod: 1m
exchanges: [{"eid":"Futures_Binance","currency":"BTC_USDT"}]
*/

//@version=2
strategy("PierceMAStrat", overlay=true)

lenMA0 = input(title="Length 0",defval=2)
lenMA1=input(title="Length 1",defval=10)
lenMA2=input(title="Length 2", defval=20)
lenMA3 = input(title = "Length3", defval =50)


emaLen0 = ema(close, lenMA0)
emaLen1 = ema(close, lenMA1)
emaLen2 = ema(close, lenMA2)
emaLen3 = ema(close, lenMA3)


ascent = if emaLen1[1] < emaLen1[0]
    true
else
    false

descent = if emaLen1[1] > emaLen1[0]
    true
else
    false

TimeSinceAscensionStart = if ascent == true
    barssince(descent == true)
else
    0


StartUp = if TimeSinceAscensionStart < 1
    true
else
    false

StartDown = if TimeSinceAscensionStart < 1
    false
else
    true


AscentBarCounter = barssince(StartUp == true)

DescentBarCounter = barssince(StartDown == true)

MaxAscent = if AscentBarCounter[1] > AscentBarCounter[0] and AscentBarCounter[1] > 10
    true
else
    false

MaxDescent = if DescentBarCounter[1] > DescentBarCounter[0] and DescentBarCounter[1] > 5
    true
else
    false

longCond = if crossover(emaLen1, emaLen2) and barssince(MaxDescent == true) > 3
    true
else
    false
shortCond = if crossunder(emaLen1, emaLen2) and barssince(MaxAscent == true) > 3
    true
else
    false


//longCond = (crossover(emaLen1, emaLen2) and (emaLen2 > emaLen3))
//shortCond = crossunder(emaLen1, emaLen2) and (emaLen2 < emaLen3)


if longCond == true
    strategy.entry("LONG", strategy.long)

if shortCond == true
    strategy.entry("SHORT", strategy.short)


plotshape(series=MaxAscent, title="MaximaReached", style=shape.triangledown, location=location.abovebar, color=green, text="MaximaReached", size=size.small)
plotshape(series=MaxDescent, title="MinimaReached", style=shape.triangleup, location=location.belowbar, color=red, text="MinimaReached", size=size.small)
//plotshape(series=StartUp, title="StartUp", style=shape.triangleup, location=location.belowbar, color=red, text="StartUp", size=size.tiny)
//plotshape(series=StartDown, title="StartDown", style=shape.triangleup, location=location.belowbar, color=green, text="StartDown", size=size.tiny)

//plotshape(series=(crossover(emaLen1, emaLen3)), title="GBXOVER", style=shape.triangleup, location=location.belowbar, color=green, text="GBXO", size=size.small)
//plotshape(series=(crossover(emaLen2, emaLen3)), title="RBXOVER", style=shape.triangledown, location=location.abovebar, color=orange, text="RBXO", size=size.small)
//plotshape(series=(crossover(emaLen1, emaLen2)), title="GRXOVER", style=shape.triangledown, location=location.abovebar, color=teal, text="GRXO", size=size.small)
//plotshape(series=(crossunder(emaLen1, emaLen2)), title="GRXUNDER", style=shape.triangledown, location=location.abovebar, color=purple, text="GRXU", size=size.small)
//plotshape(series=(crossunder(emaLen1, emaLen3)), title="GBXOVER", style=shape.triangleup, location=location.belowbar, color=yellow, text="GBXU", size=size.small)
//plotshape(series=(crossunder(emaLen2, emaLen3)), title="RBXOVER", style=shape.triangledown, location=location.abovebar, color=yellow, text="RBXU", size=size.small)

//plotshape(convergence, color=lime, style=shape.arrowup, text="CROSS")
plot(emaLen1, color=green, transp=0, linewidth=2)
plot(emaLen2, color=red, transp=30, linewidth=2)
plot(emaLen3, color=blue, transp=30, linewidth=2)