개요
이 전략은 동력 지표와 공포 지표의 교차를 계산하여 시장 움직임을 판단하고, 두 지표가 특정 교차가 발생했을 때 판매 신호를 발산하여 큰 하락세를 포착한다.
전략 원칙
- 50주기 동력 지표를 계산한다. 그것은 50주기 전의 가격에 대한 변화를 나타낸다.
- 22주기의 공포 지수 수정값을 계산한다. 이는 최고 가격과 최저 가격의 비율을 통해 시장의 공포 정서를 나타낸다.
- 동력 지표가 공포 지수를 넘으면, 시장이 하락 압박을 받고 있음을 나타냅니다.
- 동력 지표가 위험 영역으로 계속 떨어지면, 강력한 판매 신호를 냅니다.
우위 분석
- 시장 거래 감정 지표인 공포 지수를 이용하면 시장 구조적 변화를 효과적으로 판단할 수 있다.
- 동력 지표는 가격 변화의 속도와 강도를 판단할 수 있으며, 시장 추세 변화를 판단하는 데 도움을 준다.
- 두 가지 다른 유형의 지표가 결합되면, 급격한 사건을 식별하는 정확도가 향상될 수 있습니다.
- 매개 변수를 조정함으로써 다양한 시장 환경에 유연하게 적응할 수 있다.
위험 분석
- 공포 지수와 동력 지수를 교차하는 것은 매번 큰 하락을 보장하지 않습니다. 최종 결정을 결정하는 데 필요한 다른 지표의 통합이 필요합니다.
- 매각 후 손실을 효과적으로 통제할 수 없는 스톱로스 설정이 없습니다.
- 반전 및 재출장 문제를 고려하지 않습니다. 전략은 갑작스러운 하락을 잡기 위해만 적합합니다.
최적화 방향
- 판매 후 손실을 제어하기 위해 스톱 손실을 설정하십시오.
- 다른 지표 판단을 늘리고 신호의 신뢰성을 높인다. 예를 들어 거래량, 블린 라인 등이다.
- 다시 시장에 진입할 수 있는 신호를 추가하여 전략이 장기간 지속될 수 있도록 한다.
- 최적화된 변수를 찾아서 최적의 변수 조합을 찾습니다.
요약하다
이 전략은 동력 지표와 공포 지표의 교차를 통해 시장 하락 경고를 낸다. 그것은 시장의 갑작스러운 하락을 효과적으로 포착할 수 있다. 그러나 이 전략은 단선 응용에만 적합하며, 탈퇴 메커니즘과 위험 제어가 없다.
전략 소스 코드
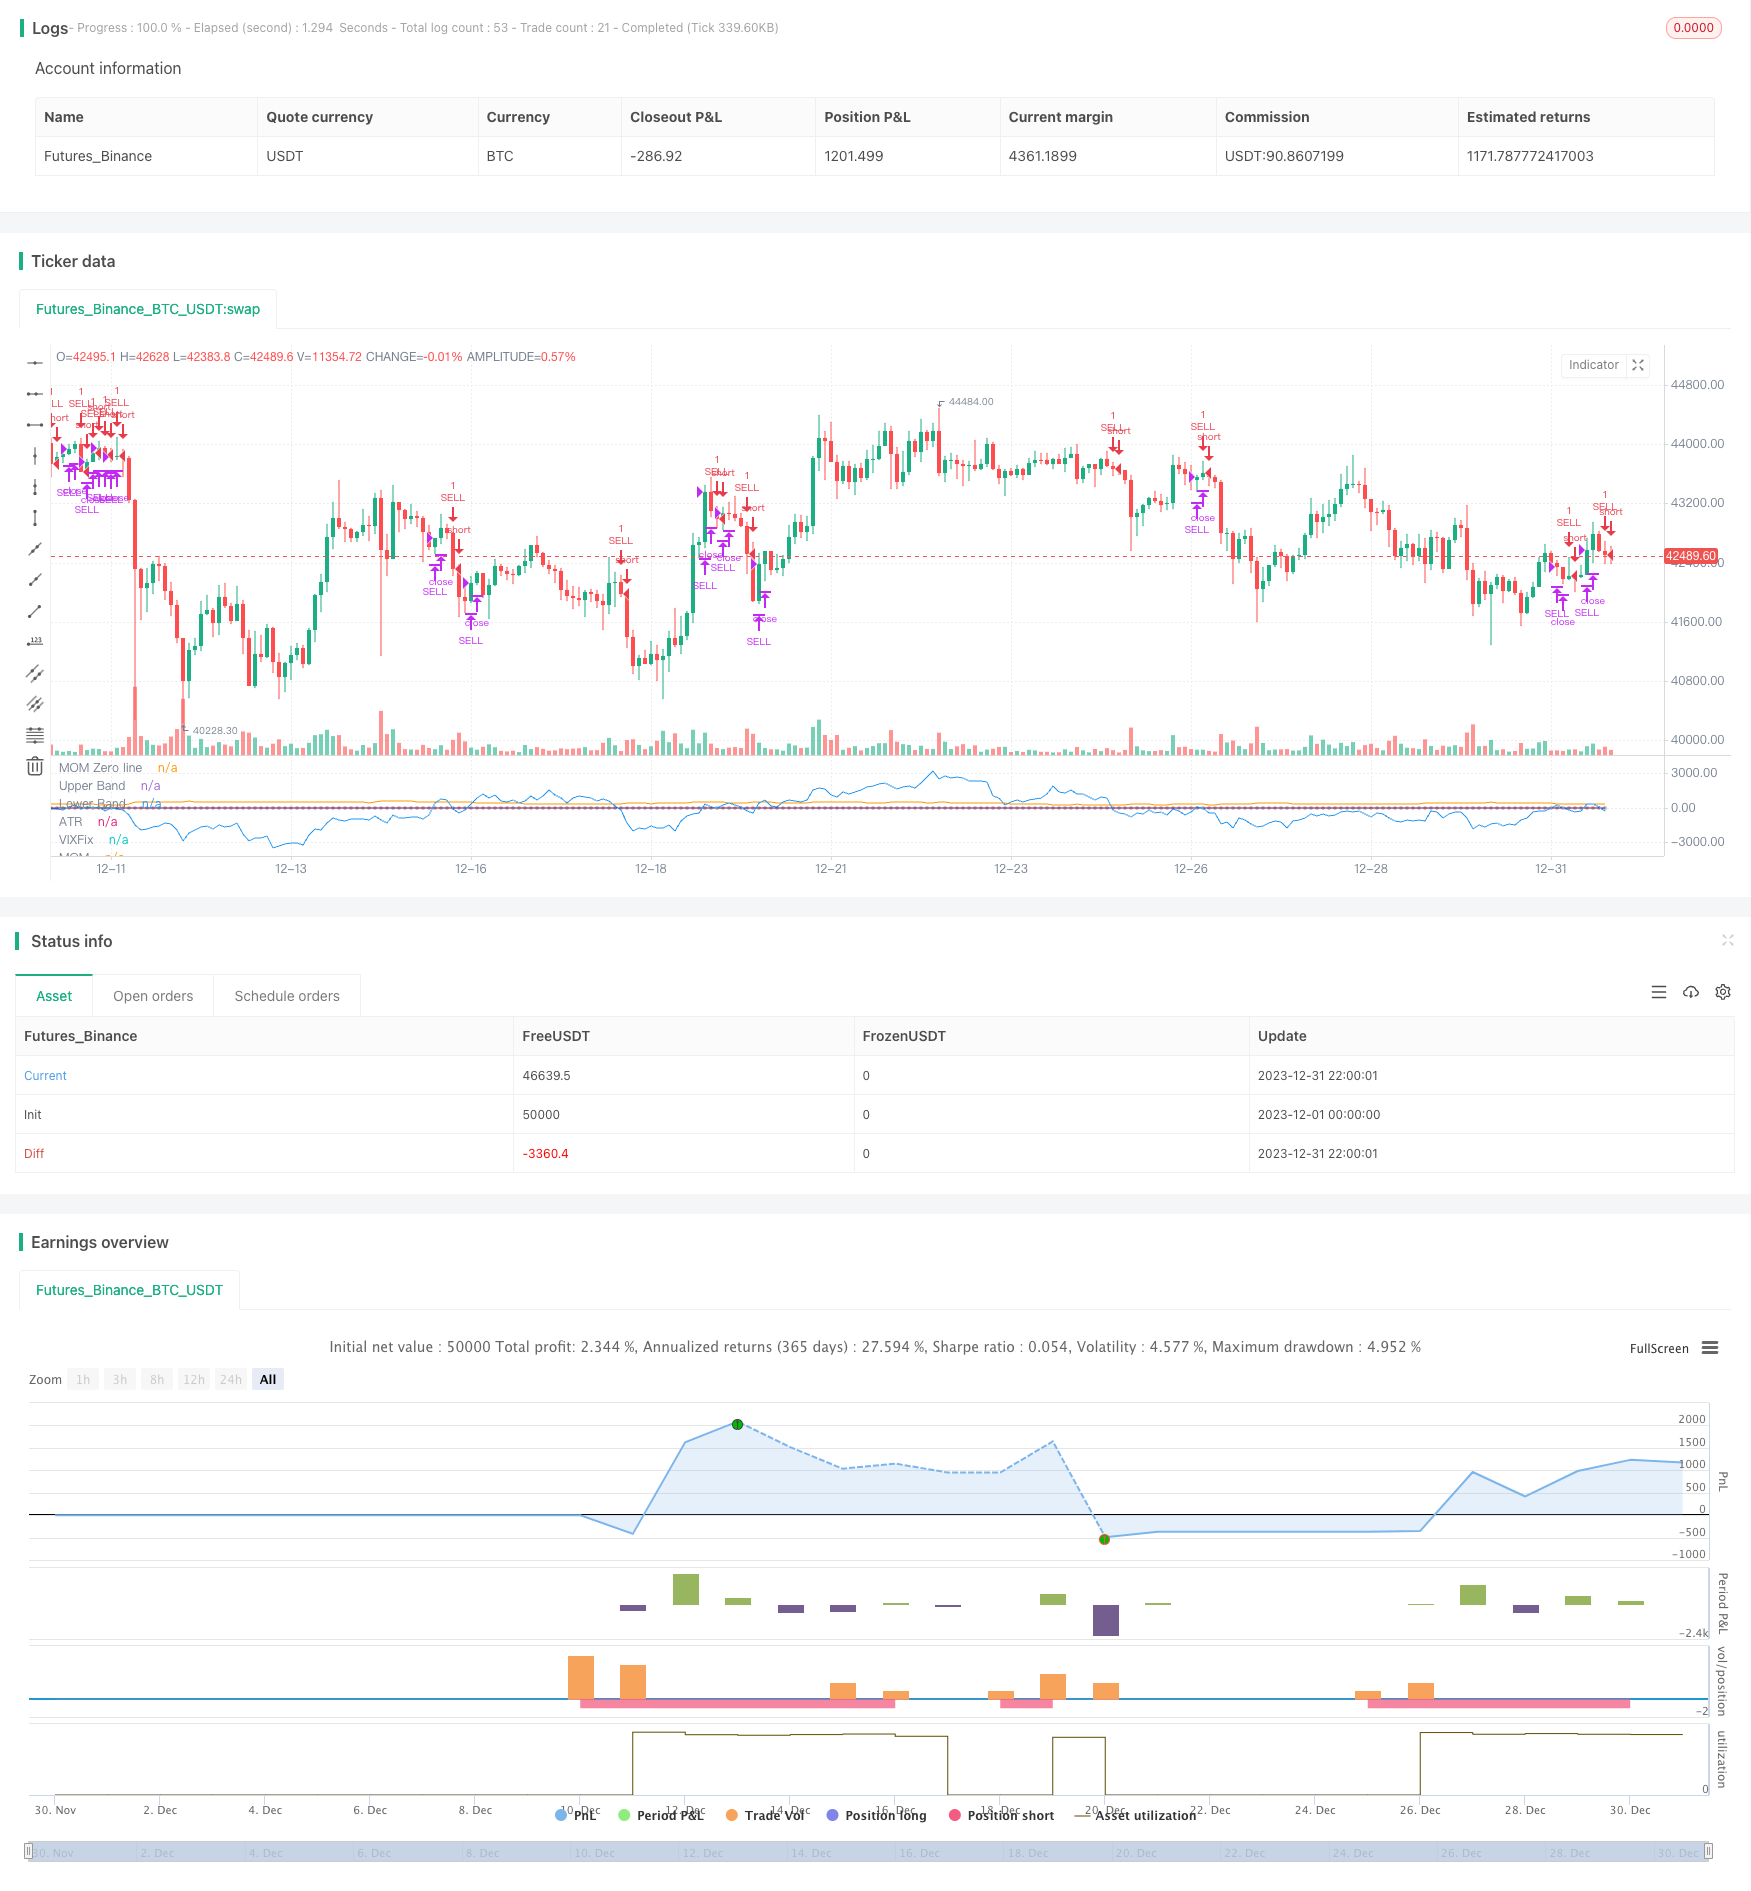
/*backtest
start: 2023-12-01 00:00:00
end: 2023-12-31 23:59:59
period: 2h
basePeriod: 15m
exchanges: [{"eid":"Futures_Binance","currency":"BTC_USDT"}]
*/

// This source code is subject to the terms of the Mozilla Public License 2.0 at https://mozilla.org/MPL/2.0/
// © gary_trades

//THIS SCRIPT HAS BEEN BUIL TO BE USED AS A S&P500 SPY CRASH INDICATOR (should not be used as a strategy).
//THIS SCRIPT HAS BEEN BUILT AS A STRATEGY FOR VISUALIZATION PURPOSES ONLY AND HAS NOT BEEN OPTIMISED FOR PROFIT.
//The script has been built to show as a lower indicator and also gives visual SELL signal on top when conditions are met. BARE IN MIND NO STOP LOSS, NOR ADVANCED EXIT STRATEGY HAS BEEN BUILT.
//As well as the chart SELL signal an alert has also been built into this script.
//The script utilizes a VIX indicator (marron line) and 50 period Momentum (blue line) and Danger/No trade zone(pink shading).
//When the Momentum line crosses down across the VIX this is a sell off but in order to only signal major sell offs the SELL signal only triggers if the momentum continues down through the danger zone.
//To use this indicator to identify ideal buying then you should only buy when Momentum line is crossed above the VIX and the Momentum line is above the Danger Zone.
//This is best used as a daily time frame indicator

//@version=4
strategy(title="S&P Bear Warning", shorttitle="Bear Warning" )

//Momentum
len = input(50, minval=1, title="Length")
src = input(close, title="Source")
bandUpper = input( 5)
bandLower = input(-5)
// ————— Control plotting of each signal. You could use the same technique to be able to turn acc/dist on/off.
showVixFix = input(true)
showMomentum = input(true)

mom = src - src[len]
myAtr = atr(14)
plot(showMomentum ? mom : na, color=color.blue, title="MOM")
plot(showMomentum ? 0 : na, color=color.silver, title="MOM Zero line", style=plot.style_circles, transp=100)
plot(showMomentum ? myAtr : na, color=color.orange, title="ATR", transp=90)

//VIX
VIXFixLength = input(22,title="VIX Fix Length")
VIXFix = (highest(close,VIXFixLength)-low)/(highest(close,VIXFixLength))*100
plot(showVixFix ? VIXFix : na, "VIXFix", color=color.maroon)

band1 = plot(showVixFix ? bandUpper : na, "Upper Band", color.red, 1, plot.style_line, transp=90)
band0 = plot(showVixFix ? bandLower : na, "Lower Band", color.red, 1, plot.style_line, transp=90)
fill(band1, band0, color=color.red, transp=85, title="Background")

//Identify Triggers
//Back Test Range
start = timestamp("America/New_York", 2000, 1, 1, 9,30)
end   = timestamp("America/New_York", 2020, 7, 1, 0, 0)

//Momentum
Long1 = mom > bandUpper
Short1 = mom < bandLower

//VIX
Long2  = crossover(mom, VIXFix)
Short2 = crossunder(mom, VIXFix)

//Warning Alert
SellAlert = Short1
alertcondition(SellAlert, title="Sell SPY", message="Warning Selling off {{ticker}}, price= {{close}}")

//Entry and Exit
if true
    strategy.entry("SELL", false, when = Short1)

strategy.close("SELL", when = Long2)