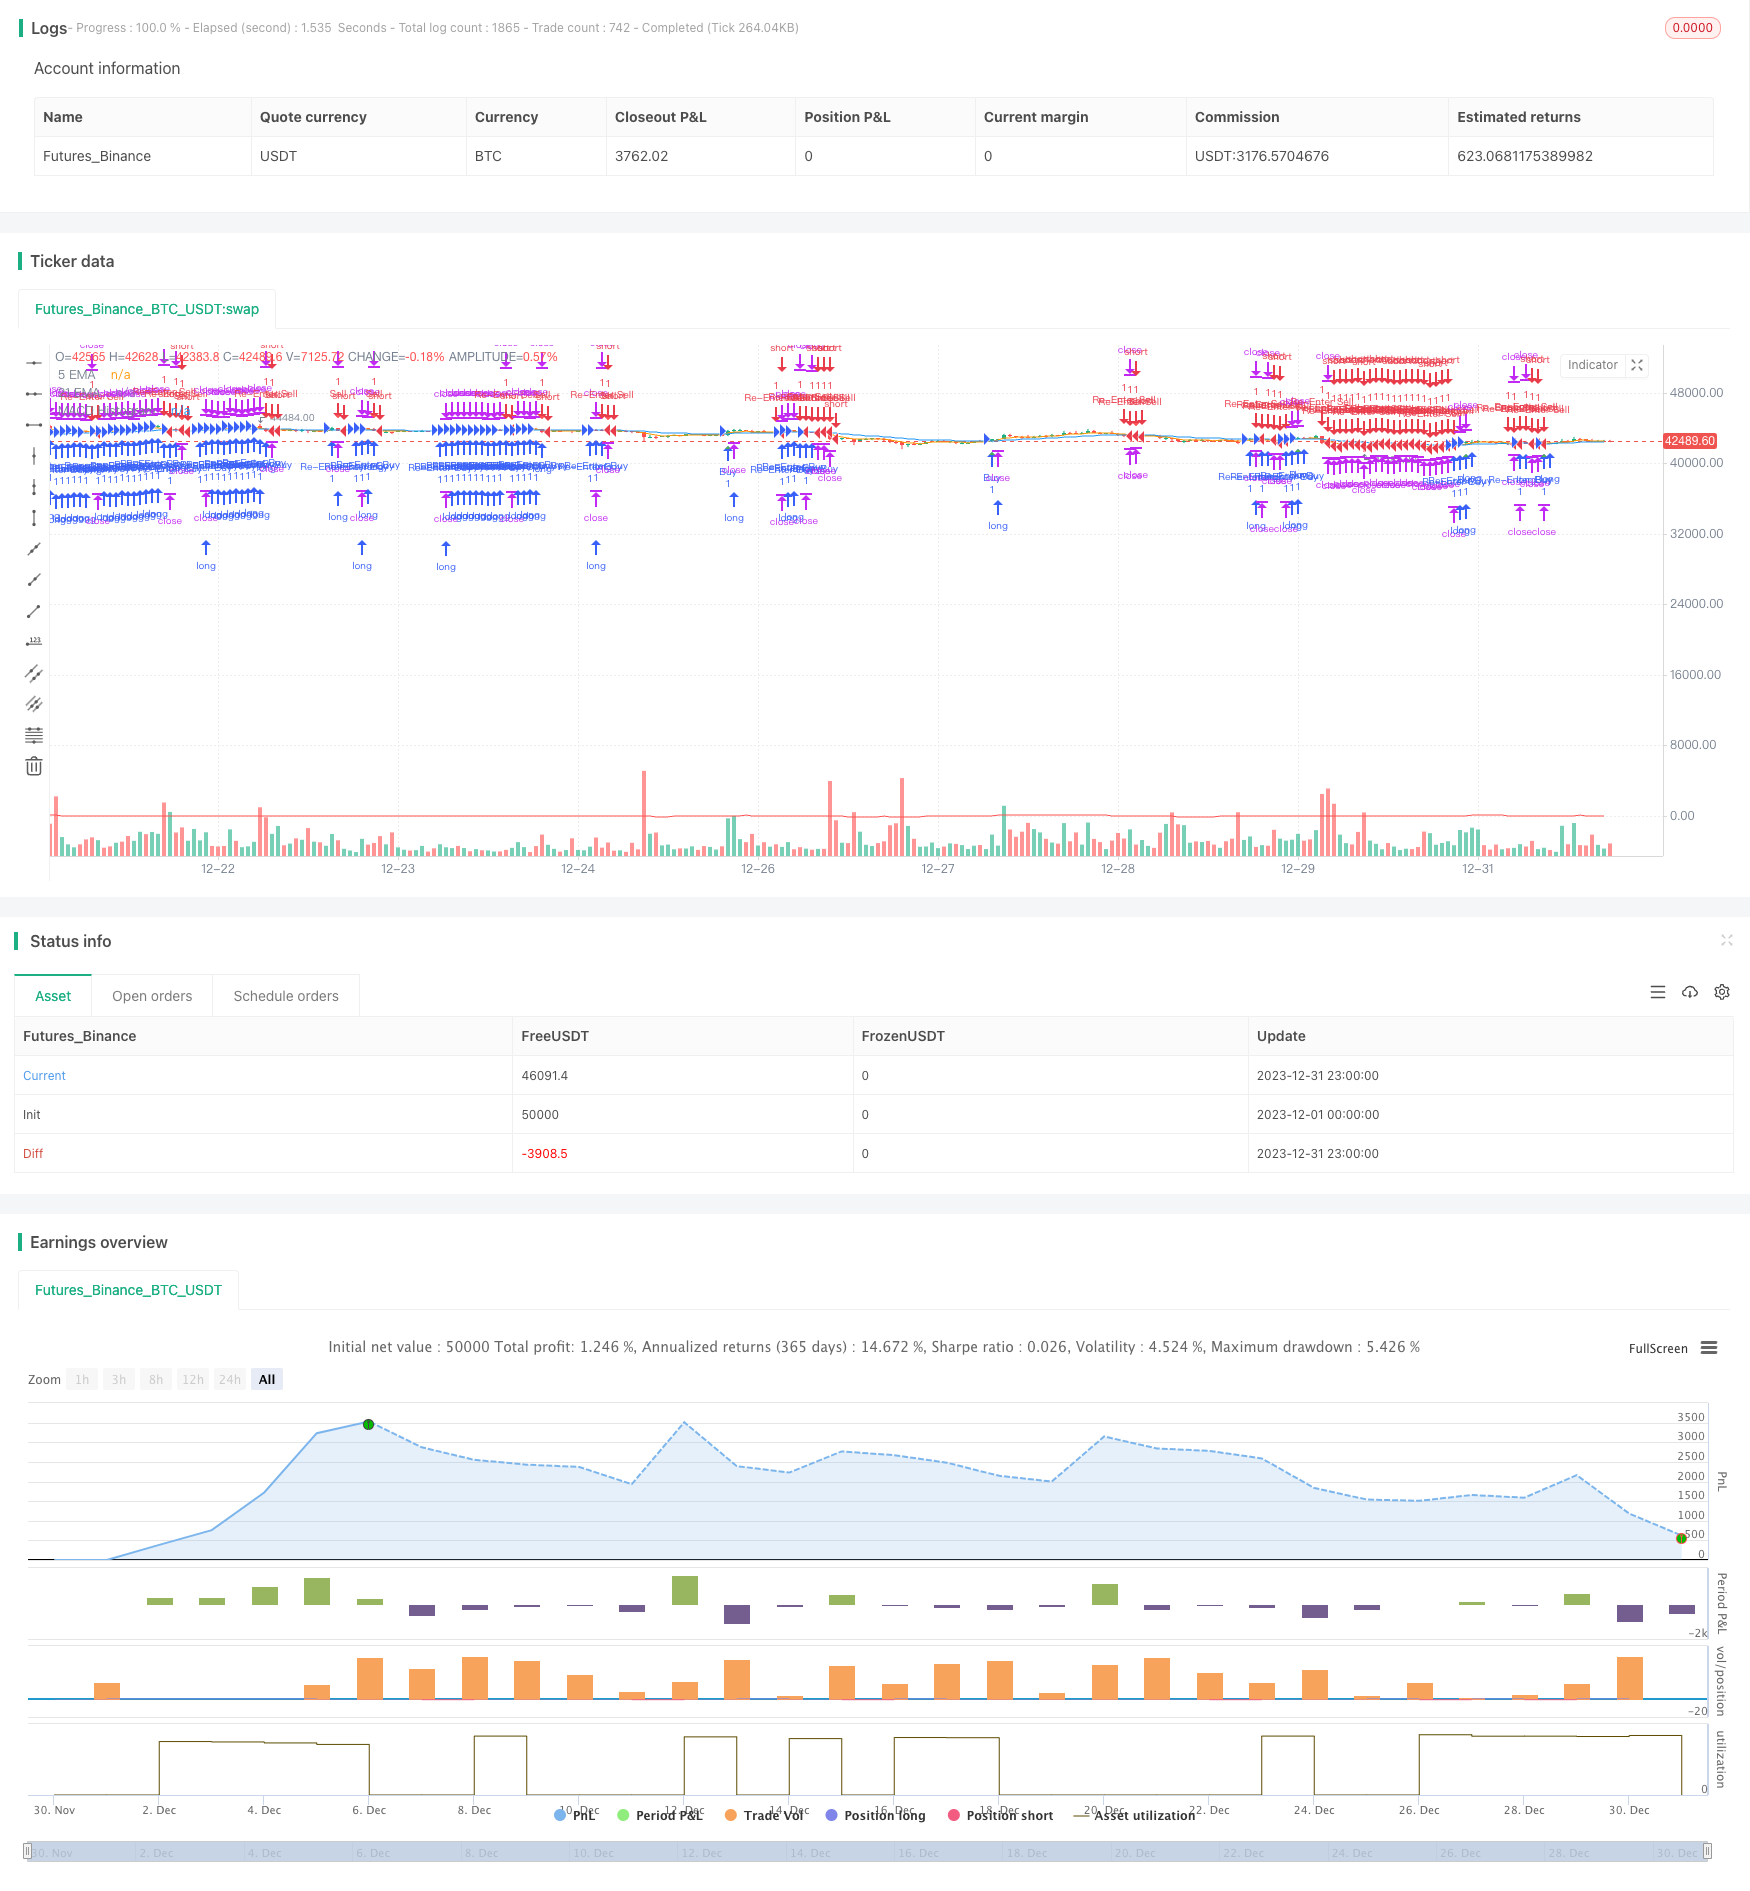
개요
이 전략은 EMA 채널과 MACD를 기반으로 한 단선 거래 전략이라고 불린다. EMA 채널과 MACD 지표를 결합하여 트렌드를 식별하고 거래 신호를 제공합니다.
전략 원칙
이 전략은 5일 EMA와 21일 EMA를 사용하여 EMA 통로를 형성한다. 5일 EMA 위를 21일 EMA를 통과하면, 거래가 다면으로 들어간다고 간주하고, 5일 EMA 아래를 21일 EMA를 통과하면, 거래가 공방으로 들어간다고 간주한다. MACD 지표의 직선 도표는 가짜 신호를 필터링하는 데 사용할 수 있다. MACD 직선 도표가 0보다 큰 경우에만 구매 신호가 발송되며, MACD 직선 도표가 0보다 작은 경우에만 판매 신호가 발송된다. 신호가 발송되면 고정 스톱 손실 및 정지 주문을 한다.
우위 분석
이 전략은 트렌드 식별과 지표 필터링을 결합하여 짧은 선의 방향을 효과적으로 식별할 수 있습니다. 주요 트렌드 방향을 판단하기 위해 EMA 통로를 사용하여 MACD 지표 필터링을 사용하여 가짜 신호를 필터링하면 수익 가능성을 크게 높일 수 있습니다. 고정된 손실 차단 메커니즘은 수익의 위험 / 이익 비율을 보장합니다. 전체적으로 이 전략은 짧은 선에 적합하며, 특히 동력이 강한 주식과 외환 품종에서 더 효과적입니다.
위험 분석
이 전략은 주로 짧은 선의 거래에 적용되며, 긴 선과 충격적인 상황에서는 효과가 좋지 않다. 긴 선의 수평형 시장에서 EMA 통로의 교차 신호는 자주 발생하지만, 대부분 가짜 신호이며, 이 때 MACD 직선 도표는 약간의 필터링 역할을 할 수 있지만 효과는 여전히 제한적이다. 또한, 고정된 스톱 스톱 메커니즘은 긴 선의 추세에서 가져오는 증가 수익을 잡기가 어렵게 만든다. 따라서 이 전략의 주요 위험이다.
최적화 방향
이 전략은 다음과 같은 부분에서 최적화될 수 있습니다.
- 특정 거래 품종에 대한 수익률을 극대화 할 수있는 EMA의 변수를 최적화하십시오.
- MACD의 매개 변수를 최적화하여 더 나은 필터링 효과를 얻습니다.
- 변동성 지표와 함께 시장의 변동성이 커질 때, 손실 범위를 확장합니다.
- 손실을 추적하는 메커니즘을 추가하여 손실을 가격에 가깝게하고, 수익을 보장하는 조건에서 불필요한 손실이 유발되는 가능성을 줄입니다.
요약하다
이 전략은 전체적으로 수익성이 높으며, 특히 단선 거래에 적합하며, 높은 주파수 거래를 추구하는 양적 거래 전략에서 좋은 선택이다. 그러나 거래자는 시장 상황에 따라 합리적으로 매개 변수를 조정하여 전략 수익을 극대화하면서 거래 위험을 제어해야합니다.
/*backtest
start: 2023-12-01 00:00:00
end: 2023-12-31 23:59:59
period: 1h
basePeriod: 15m
exchanges: [{"eid":"Futures_Binance","currency":"BTC_USDT"}]
*/

// This source code is subject to the terms of the Mozilla Public License 2.0 at https://mozilla.org/MPL/2.0/
// © moondevonyt

//@version=5
strategy("Scalping with EMA channel and MACD", overlay=true)

// Exponential moving average inputs
ema21 = ta.ema(close, 21)
ema5 = ta.ema(close, 5)

// MACD inputs
fastLength = 18
slowLength = 34
signalSmoothing = 12

[macdLine, signalLine, _] = ta.macd(close, fastLength, slowLength, signalSmoothing)
macdHistogram = macdLine - signalLine

// Buy and sell conditions
buyCondition = ta.crossover(ema5, ema21) and macdHistogram > 0
sellCondition = ta.crossunder(ema5, ema21) and macdHistogram < 0

// Re-entry conditions
reEntryBuyCondition = close > ema21
reEntrySellCondition = close < ema21

// Set stop loss and take profit
stopLoss = 8
takeProfit = 15

// Execute Strategy
if buyCondition
    strategy.entry("Buy", strategy.long)
    strategy.exit("Take Profit/Stop Loss", "Buy", stop=close - stopLoss, limit=close + takeProfit)
if reEntryBuyCondition
    strategy.entry("Re-Enter Buy", strategy.long)
    strategy.exit("Take Profit/Stop Loss", "Re-Enter Buy", stop=close - stopLoss, limit=close + takeProfit)

if sellCondition
    strategy.entry("Sell", strategy.short)
    strategy.exit("Take Profit/Stop Loss", "Sell", stop=close + stopLoss, limit=close - takeProfit)
if reEntrySellCondition
    strategy.entry("Re-Enter Sell", strategy.short)
    strategy.exit("Take Profit/Stop Loss", "Re-Enter Sell", stop=close + stopLoss, limit=close - takeProfit)

// Plotting EMAs and MACD
plot(ema21, color=color.blue, title="21 EMA")
plot(ema5, color=color.orange, title="5 EMA")
plot(macdHistogram, color=color.red, title="MACD Histogram")

// Plot buy and sell signals
plotshape(series=buyCondition, style=shape.triangleup, location=location.belowbar, color=color.green, size=size.small, title="Buy Signal")
plotshape(series=sellCondition, style=shape.triangledown, location=location.abovebar, color=color.red, size=size.small, title="Sell Signal")