개요
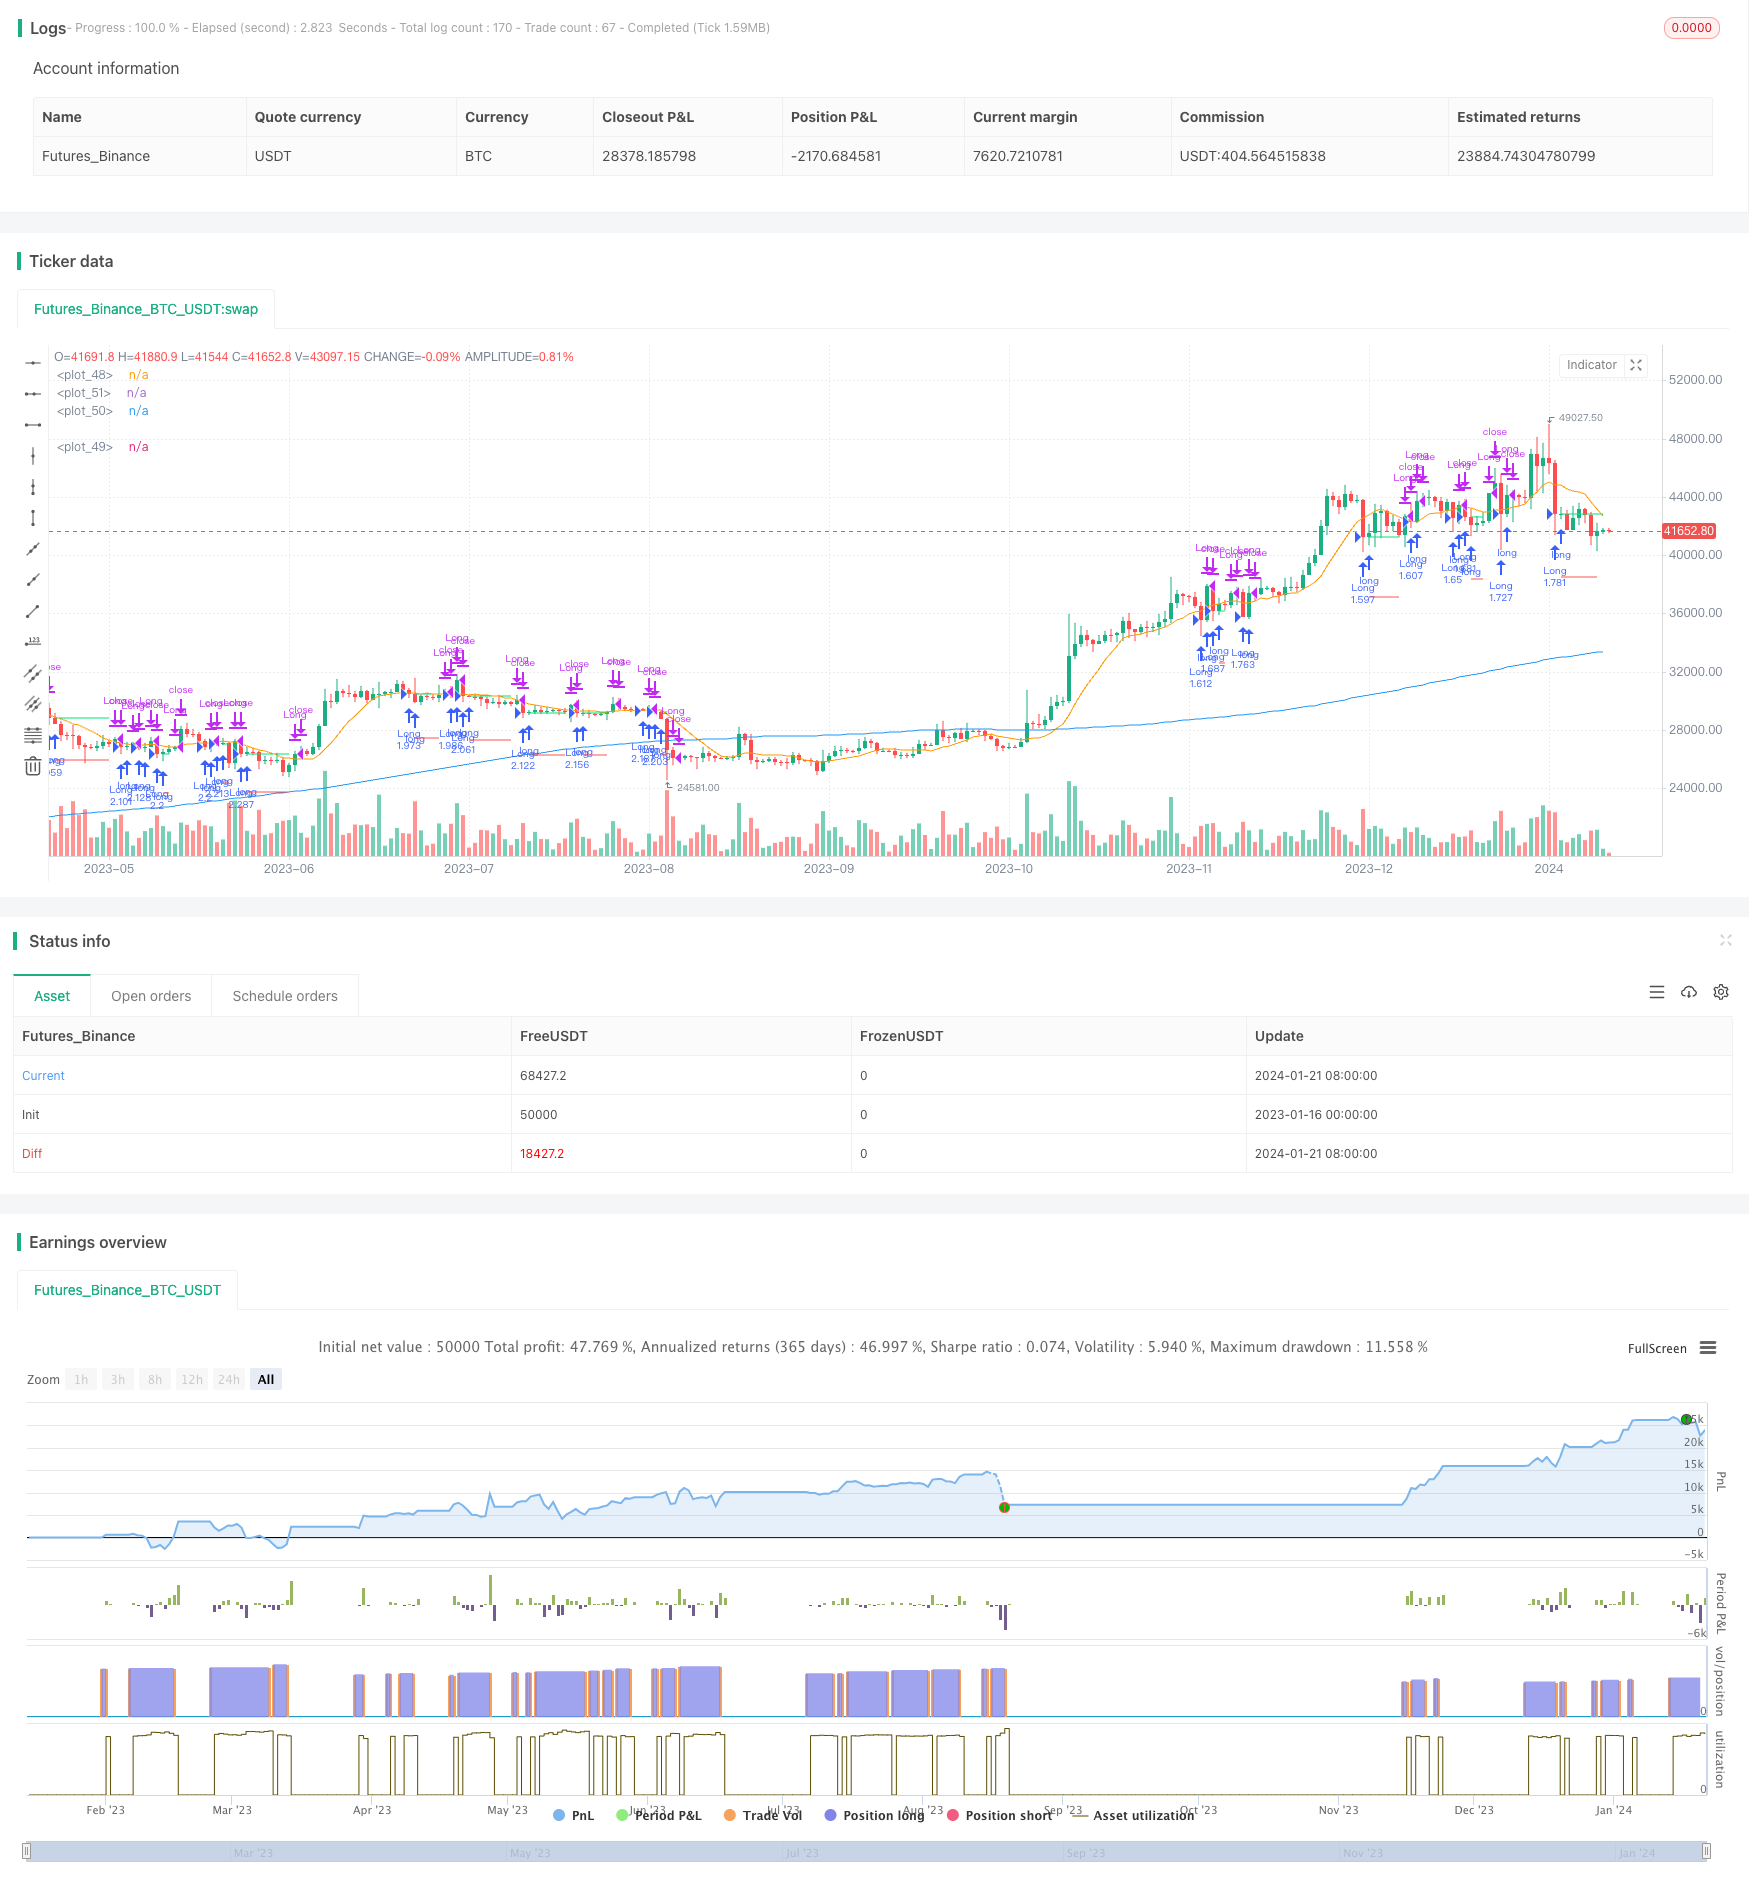
이 전략은 시장에서 잠재적인 회귀 기회를 식별하는 것을 목적으로 한다. 이 전략은 쌍평평선 시스템을 사용한다: 장기 이동 평균 ((MA1)) 과 단기 이동 평균 ((MA2)). 주요 목표는 마감 가격이 MA1보다 낮지만 MA2보다 높을 때 잠재적인 큰 추세에서 회귀 기회를 표시하여 더 많은 것을 수행하는 것이다.
전략 원칙
이 전략은 두 가지 이동 평균을 사용합니다: MA1 (오른쪽) 및 MA2 (단쪽) ᆞ 그 원칙은, 단기 가격의 회귀가 나타나면, 장기 추세의 지원을 테스트하면, 이것은 많은 기회를 가질 수 있다는 것입니다. 구체적으로, 마감 가격이 장기 지원 (MA1) 보다 높다면, 큰 추세는 여전히 좋은 것을 나타냅니다.
우위 분석
이 전략은 다음과 같은 장점을 가지고 있습니다.
- 간단한, 이해하기 쉬운, 변수 조정 유연한 구현
- 트렌드를 파악하고 역동적인 거래를 피하기 위한 쌍방평선 시스템
- 특정 시기의 시장 변형을 방지하는 사용자 정의 시간 필터
- 다양한 위험 선호에 맞게 포지션 크기를 조정할 수 있습니다.
- 손실 위험을 제한하기 위한 손해 방지 장치
위험 분석
이 전략에는 다음과 같은 위험도 있습니다.
- “이런 일이 벌어진다면, 우리는 더 이상 경제에 영향을 끼치지 않을 것입니다”.
- “지원 수준이 무너지고, 큰 흐름이 뒤집어진다”
- 시장의 급격한 변동과 이동 평균의 변동
- 잘못된 시간적 선택, 놓친 거래 기회
이에 따라, 다음과 같은 부분에서 최적화 및 개선이 가능합니다.
- 이동 평균 변수를 최적화하여 거래 신호 품질을 개선합니다.
- 최소화한 위험과 함께 수익을 얻을 수 있는 최적화된 스톱로스 레벨
- 시간 필터를 조정하여 최적의 거래 시점에 위치하십시오.
- 다양한 품종과 시장 환경을 테스트합니다.
최적화 방향
이 전략은 다음과 같은 부분에서 최적화될 수 있습니다.
- 이동 평균 변수를 최적화하여 최적의 변수 조합을 찾습니다.
- 추적 손해, 진동 손해와 같은 다양한 손해 방지 메커니즘을 테스트합니다.
- 거래량 필터, 변동률 필터와 같은 다른 필터를 추가합니다.
- 골드 포크 (Gold Forks) 또는 데드 포크 (Dead Forks) 와 같은 포지션 관리 메커니즘을 추가
- 자동 차단장치 추가
- 재검토를 수행하고, 최적의 변수를 결정하기 위해 핵심 지표를 계산합니다.
요약하다
이 전략은 전반적으로 간단하고 실용적인 단선 회전 전략이다. 이 전략은 쌍평선으로 회전 기회를 식별하고 이동 스톱을 설정하여 위험을 제어한다. 이 전략은 쉽게 이해하고 구현할 수 있으며, 파라미터를 조정할 수 있으며, 다양한 위험 선호도를 충족시킬 수 있다. 다음 단계에서는 이동 평균 파라미터, 스톱 메커니즘, 필터 등을 최적화하여 전략을 더 안정적으로 개선할 수 있다.
전략 소스 코드
/*backtest
start: 2023-01-16 00:00:00
end: 2024-01-22 00:00:00
period: 1d
basePeriod: 1h
exchanges: [{"eid":"Futures_Binance","currency":"BTC_USDT"}]
*/

// This source code is subject to the terms of the Mozilla Public License 2.0 at https://mozilla.org/MPL/2.0/
// © ZenAndTheArtOfTrading / www.PineScriptMastery.com
// @version=5
strategy("Simple Pullback Strategy",
     overlay=true,
     initial_capital=50000,
     default_qty_type=strategy.percent_of_equity,
     default_qty_value=100, // 100% of balance invested on each trade
     commission_type=strategy.commission.cash_per_contract,
     commission_value=0.005) // Interactive Brokers rate

// Get user input
i_ma1           = input.int(title="MA 1 Length", defval=200, step=10, group="Strategy Parameters", tooltip="Long-term MA")
i_ma2           = input.int(title="MA 2 Length", defval=10, step=10, group="Strategy Parameters", tooltip="Short-term MA")
i_stopPercent   = input.float(title="Stop Loss Percent", defval=0.10, step=0.1, group="Strategy Parameters", tooltip="Failsafe Stop Loss Percent Decline")
i_lowerClose    = input.bool(title="Exit On Lower Close", defval=false, group="Strategy Parameters", tooltip="Wait for a lower-close before exiting above MA2")
i_startTime     = input(title="Start Filter", defval=timestamp("01 Jan 1995 13:30 +0000"), group="Time Filter", tooltip="Start date & time to begin searching for setups")
i_endTime       = input(title="End Filter", defval=timestamp("1 Jan 2099 19:30 +0000"), group="Time Filter", tooltip="End date & time to stop searching for setups")

// Get indicator values
ma1 = ta.sma(close, i_ma1)
ma2 = ta.sma(close, i_ma2)

// Check filter(s)
f_dateFilter =true

// Check buy/sell conditions
var float buyPrice = 0
buyCondition    = close > ma1 and close < ma2 and strategy.position_size == 0 and f_dateFilter
sellCondition   = close > ma2 and strategy.position_size > 0 and (not i_lowerClose or close < low[1])
stopDistance    = strategy.position_size > 0 ? ((buyPrice - close) / close) : na
stopPrice       = strategy.position_size > 0 ? buyPrice - (buyPrice * i_stopPercent) : na
stopCondition   = strategy.position_size > 0 and stopDistance > i_stopPercent

// Enter positions
if buyCondition
    strategy.entry(id="Long", direction=strategy.long)

if buyCondition[1]
    buyPrice := open

// Exit positions
if sellCondition or stopCondition
    strategy.close(id="Long", comment="Exit" + (stopCondition ? "SL=true" : ""))
    buyPrice := na

// Draw pretty colors
plot(buyPrice, color=color.lime, style=plot.style_linebr)
plot(stopPrice, color=color.red, style=plot.style_linebr, offset=-1)
plot(ma1, color=color.blue)
plot(ma2, color=color.orange)