개요
이것은 부린 띠 지표에 기초하여 트렌드를 판단하고 ATR 지표를 사용하여 손실 중지 지점을 설정하는 트렌드 추적 전략이다. 이 전략은 먼저 시장의 트렌드를 판단하고, IRONMENT 라인에서, 평점 상태에서 손실 중지 지점을 설정한다.
전략 원칙
- 브린 띠의 상강, 하강을 계산한다.
- 마감 가격이 상반기보다 높거나 하반기보다 낮다는 것을 판단하고, 만약 그렇다면 트렌드 시장으로 판단하고, 각각 다단계 시장과 빈단계 시장으로 판단한다.
- 트렌드 시장의 경우, 환경 라인을 계산한다. 환경 라인은 ATR의 값을 빼기 최저 가격 ((다목 시장) 또는 ATR의 값을 더한 최상 가격 ((공석 시장) 을 기반으로 한다.
- 트렌드 시장이 아닌 경우, 환경 라인은 이전 K 라인의 환경 라인 값과 동일하게 유지된다.
- ENVIRONMENT 선을 비교하여 트렌드 방향을 판단한다. 상승이 다면, 하락이 공평하다.
- ENVIRONMENT 선의 방향이 바뀌면 구매/판매 신호가 발생한다.
- 설정 스톱 로드: 고정 스톱 로드 거리는 입시 가격의 100배; 부동 스톱 로드 거리는 입시 가격의 1.1배 (다중 머리) 또는 0.9배 (공백 머리) 이다.
우위 분석
- 시장의 흐름을 파악하고 가짜 돌파구를 줄일 수 있습니다.
- ENVIRONMENT 라인을 설정하여 을 피하십시오.
- 손해 차단장치 설정은 합리적이고, 수익을 보장하면서 위험을 통제할 수 있다.
위험 분석
- 잘못된 매개 변수 설정으로 인해 거래 기회를 놓칠 수 있습니다.
- 브린 벨트 지표는 지진 상황에서는 잘못된 판단의 가능성이 높습니다.
- 스톱다임이 너무 가까이 다가간다면 2차전 당할 수 있다.
최적화 방향
- 다양한 품종에 더 적합하도록 브린 띠의 매개 변수를 최적화한다.
- ENVIRONMENT 선의 계산 방법을 최적화하여 다른 지표들을 도입하는 것 등
- 테스트 및 최적화 중지 손해 제동의 파라미터 설정.
요약하다
이것은 부린띠 판단 트렌드를 이용하여 ENVIRONMENT 라인을 설정하여 스톱포드를 설정하는 전략이다. 핵심 장점은 트렌드 판단이 명확하고, 스톱포드 설정이 합리적이며, 위험을 효과적으로 제어할 수 있다는 것이다. 주요한 위험은 부린띠 추세 판단 오류와 스톱포드가 너무 가깝다는 것이다. 미래 최적화 방향은 파라미터 최적화, ENVIRONMENT 라인 계산 방법 최적화 및 스톱포드 최적화 등이다.
전략 소스 코드
/*backtest
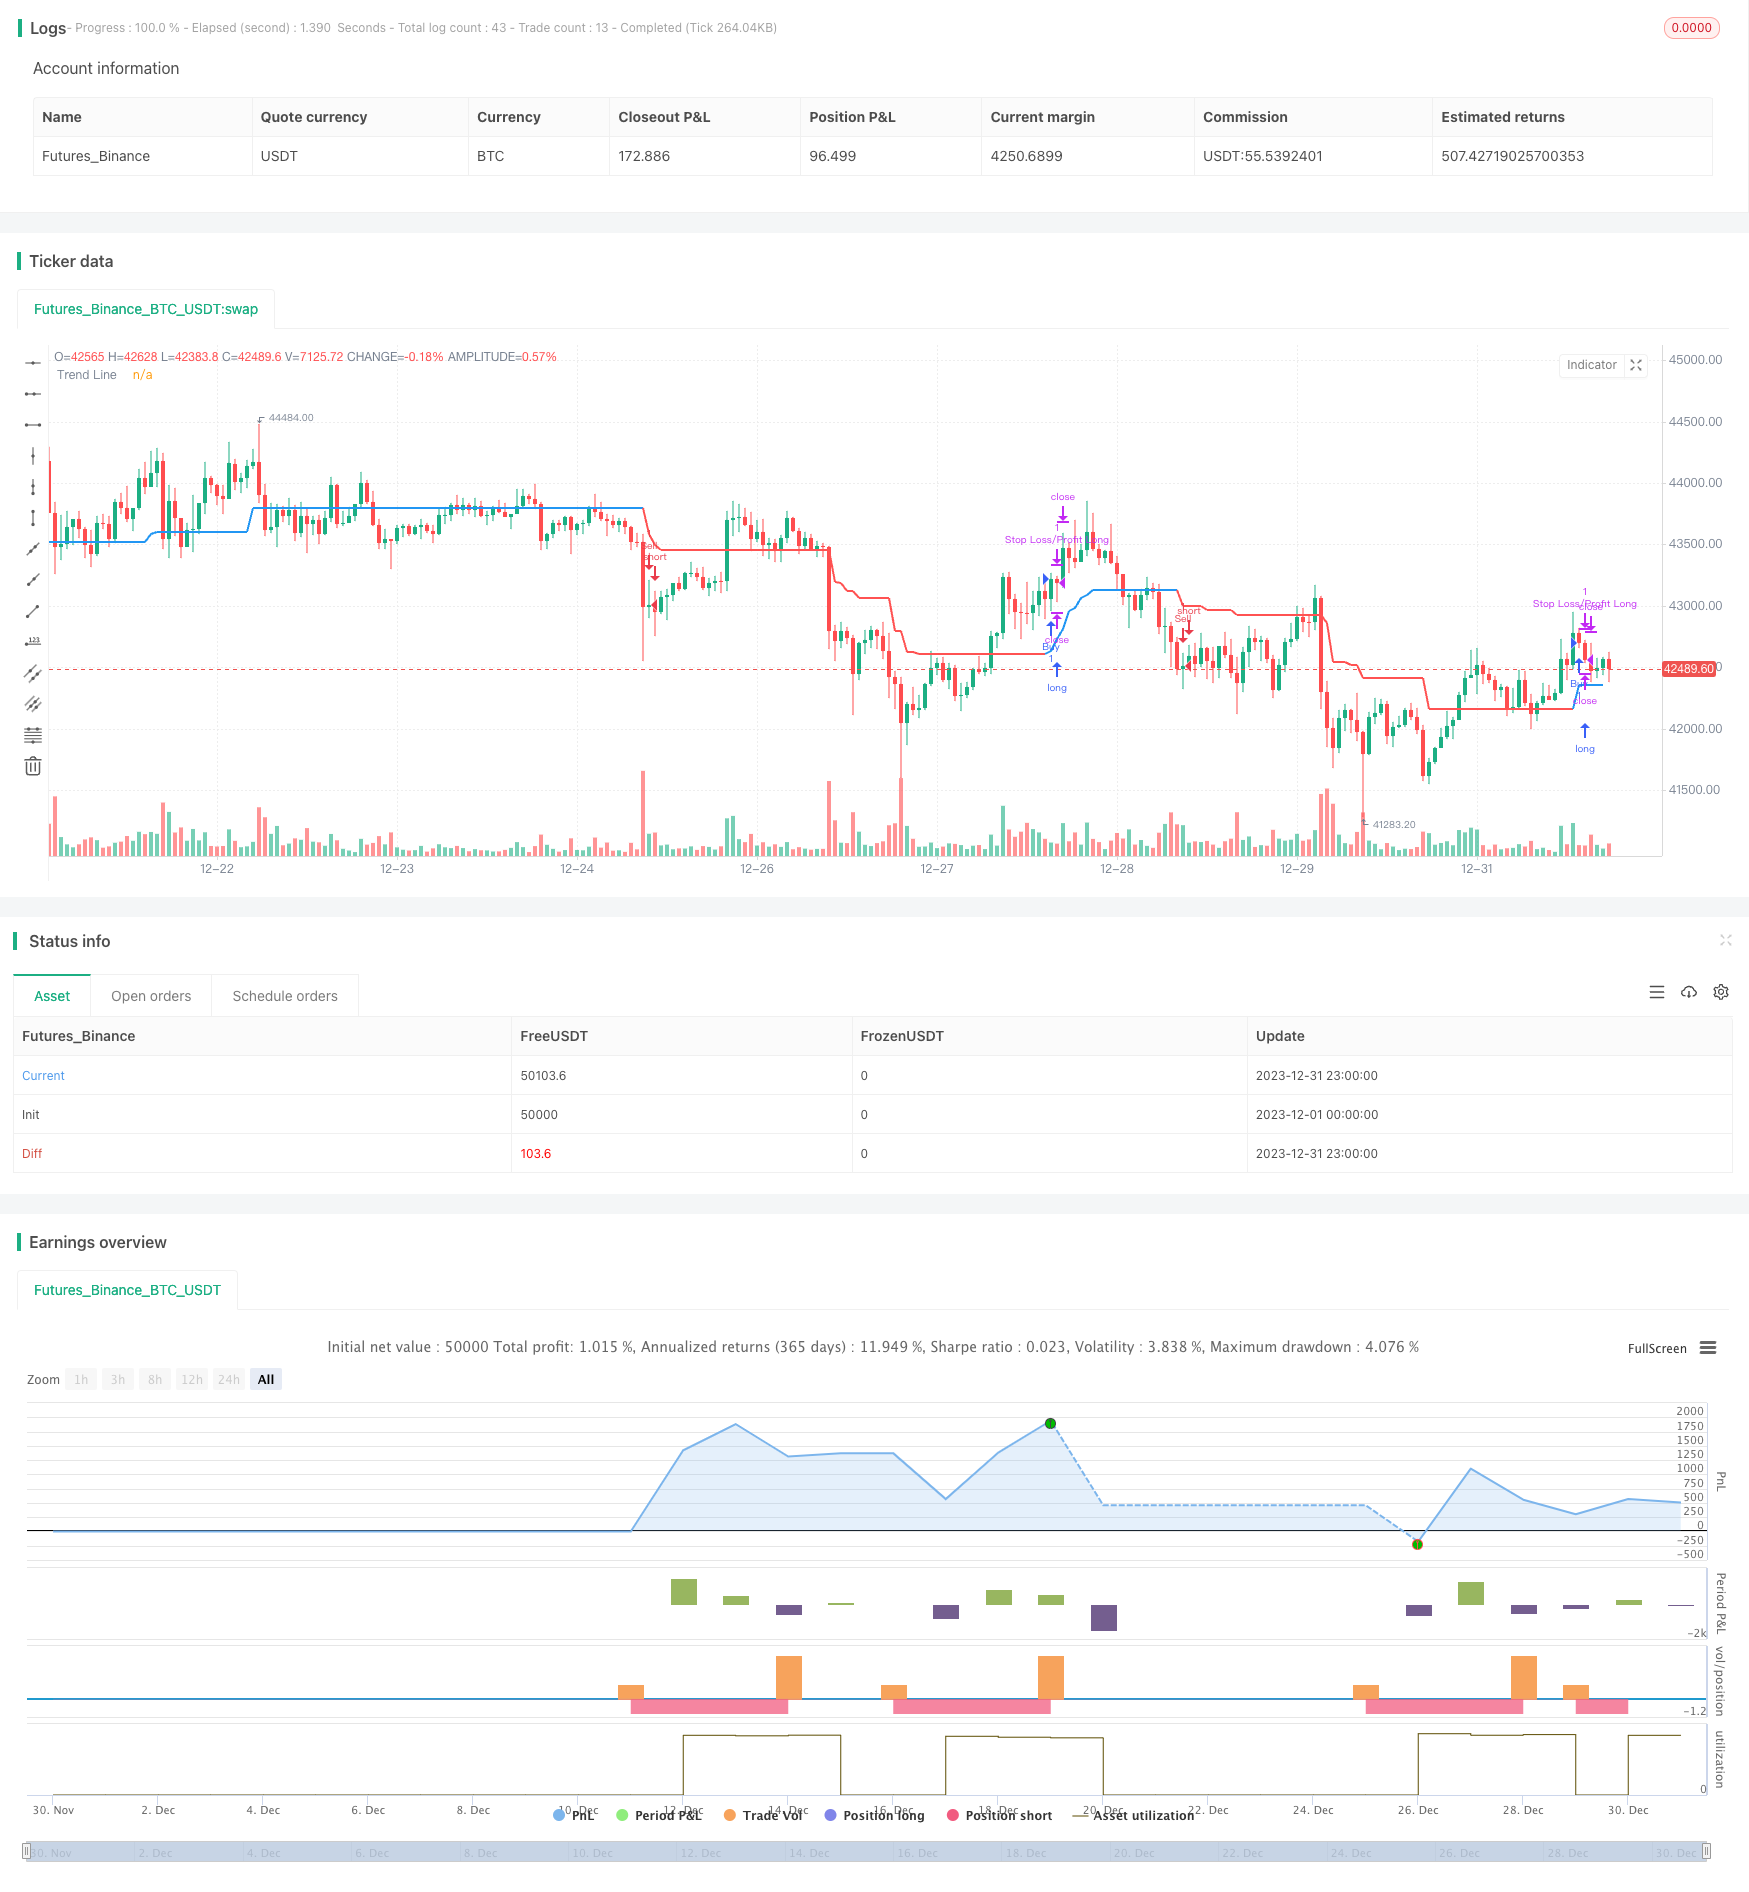
start: 2023-12-01 00:00:00
end: 2023-12-31 23:59:59
period: 1h
basePeriod: 15m
exchanges: [{"eid":"Futures_Binance","currency":"BTC_USDT"}]
*/
// This Pine Script™ code is subject to the terms of the Mozilla Public License 2.0 at https://mozilla.org/MPL/2.0/
// © zhuenrong
// © Dreadblitz
//@version=4
strategy(shorttitle="FLI", title="Follow Line Indicator", overlay=true)
//
BBperiod = input(defval = 21, title = "BB Period", type = input.integer, minval = 1)
BBdeviations = input(defval = 1.00, title = "BB Deviations", type = input.float, minval = 0.1, step=0.05)
UseATRfilter = input(defval = true, title = "ATR Filter", type = input.bool)
ATRperiod = input(defval = 5, title = "ATR Period", type = input.integer, minval = 1)
hl = input(defval = false, title = "Hide Labels", type = input.bool)
//
BBUpper=sma (close,BBperiod)+stdev(close, BBperiod)*BBdeviations
BBLower=sma (close,BBperiod)-stdev(close, BBperiod)*BBdeviations
//
TrendLine = 0.0
iTrend = 0.0
buy = 0.0
sell = 0.0
//
BBSignal = close>BBUpper? 1 : close<BBLower? -1 : 0
//
if BBSignal == 1 and UseATRfilter == 1
TrendLine:=low-atr(ATRperiod)
if TrendLine<TrendLine[1]
TrendLine:=TrendLine[1]
if BBSignal == -1 and UseATRfilter == 1
TrendLine:=high+atr(ATRperiod)
if TrendLine>TrendLine[1]
TrendLine:=TrendLine[1]
if BBSignal == 0 and UseATRfilter == 1
TrendLine:=TrendLine[1]
//
if BBSignal == 1 and UseATRfilter == 0
TrendLine:=low
if TrendLine<TrendLine[1]
TrendLine:=TrendLine[1]
if BBSignal == -1 and UseATRfilter == 0
TrendLine:=high
if TrendLine>TrendLine[1]
TrendLine:=TrendLine[1]
if BBSignal == 0 and UseATRfilter == 0
TrendLine:=TrendLine[1]
//
iTrend:=iTrend[1]
if TrendLine>TrendLine[1]
iTrend:=1
if TrendLine<TrendLine[1]
iTrend:=-1
//
buy:=iTrend[1]==-1 and iTrend==1 ? 1 : na
sell:=iTrend[1]==1 and iTrend==-1? 1 : na
//
plot(TrendLine, color=iTrend > 0?color.blue:color.red ,style=plot.style_line,linewidth=2,transp=0,title="Trend Line")
plotshape(buy == 1 and hl == false? TrendLine-atr(8) :na, text='💣', style= shape.labelup, location=location.absolute, color=color.blue, textcolor=color.white, offset=0, transp=0,size=size.auto)
plotshape(sell == 1 and hl == false ?TrendLine+atr(8):na, text='🔨', style=shape.labeldown, location=location.absolute, color=color.red, textcolor=color.white, offset=0, transp=0,size=size.auto)
//
alertcondition(sell == 1 ,title="Sell",message="Sell")
alertcondition(buy == 1 ,title="Buy",message="Buy")
alertcondition(buy == 1 or sell == 1 ,title="Buy/Sell",message="Buy/Sell")
if (buy==1)
strategy.entry("Buy", strategy.long)
if (sell==1)
strategy.entry("Sell", strategy.short)
// === Stop LOSS ===
if strategy.position_size>0
strategy.exit("Stop Loss/Profit Long","Buy", stop=strategy.position_avg_price*100, limit=strategy.position_avg_price*1.1)
if strategy.position_size<0
strategy.exit("Stop Loss/Profit Short","Sell", stop=strategy.position_avg_price*100, limit=strategy.position_avg_price*0.9)