이중 지수 이동 평균 교차 양적 거래 전략


생성 날짜: 2024-01-25 14:04:23 마지막으로 수정됨: 2024-01-25 14:04:23
복사: 0 클릭수: 659
avatar of ChaoZhang ChaoZhang
1
집중하다
1617
수행원

이중 지수 이동 평균 교차 양적 거래 전략

개요

이 전략의 이름은 쌍 지수 평균 횡단 계량화 거래 전략 . 이 전략은 쌍 지수 이동 평균 (Exponential Moving Average, EMA) 을 계산하고 교차 매수점을 판단하여, 양적 거래의 포지션 개설 원칙과 결합하여 자동화 거래를 구현한다.

전략 원칙

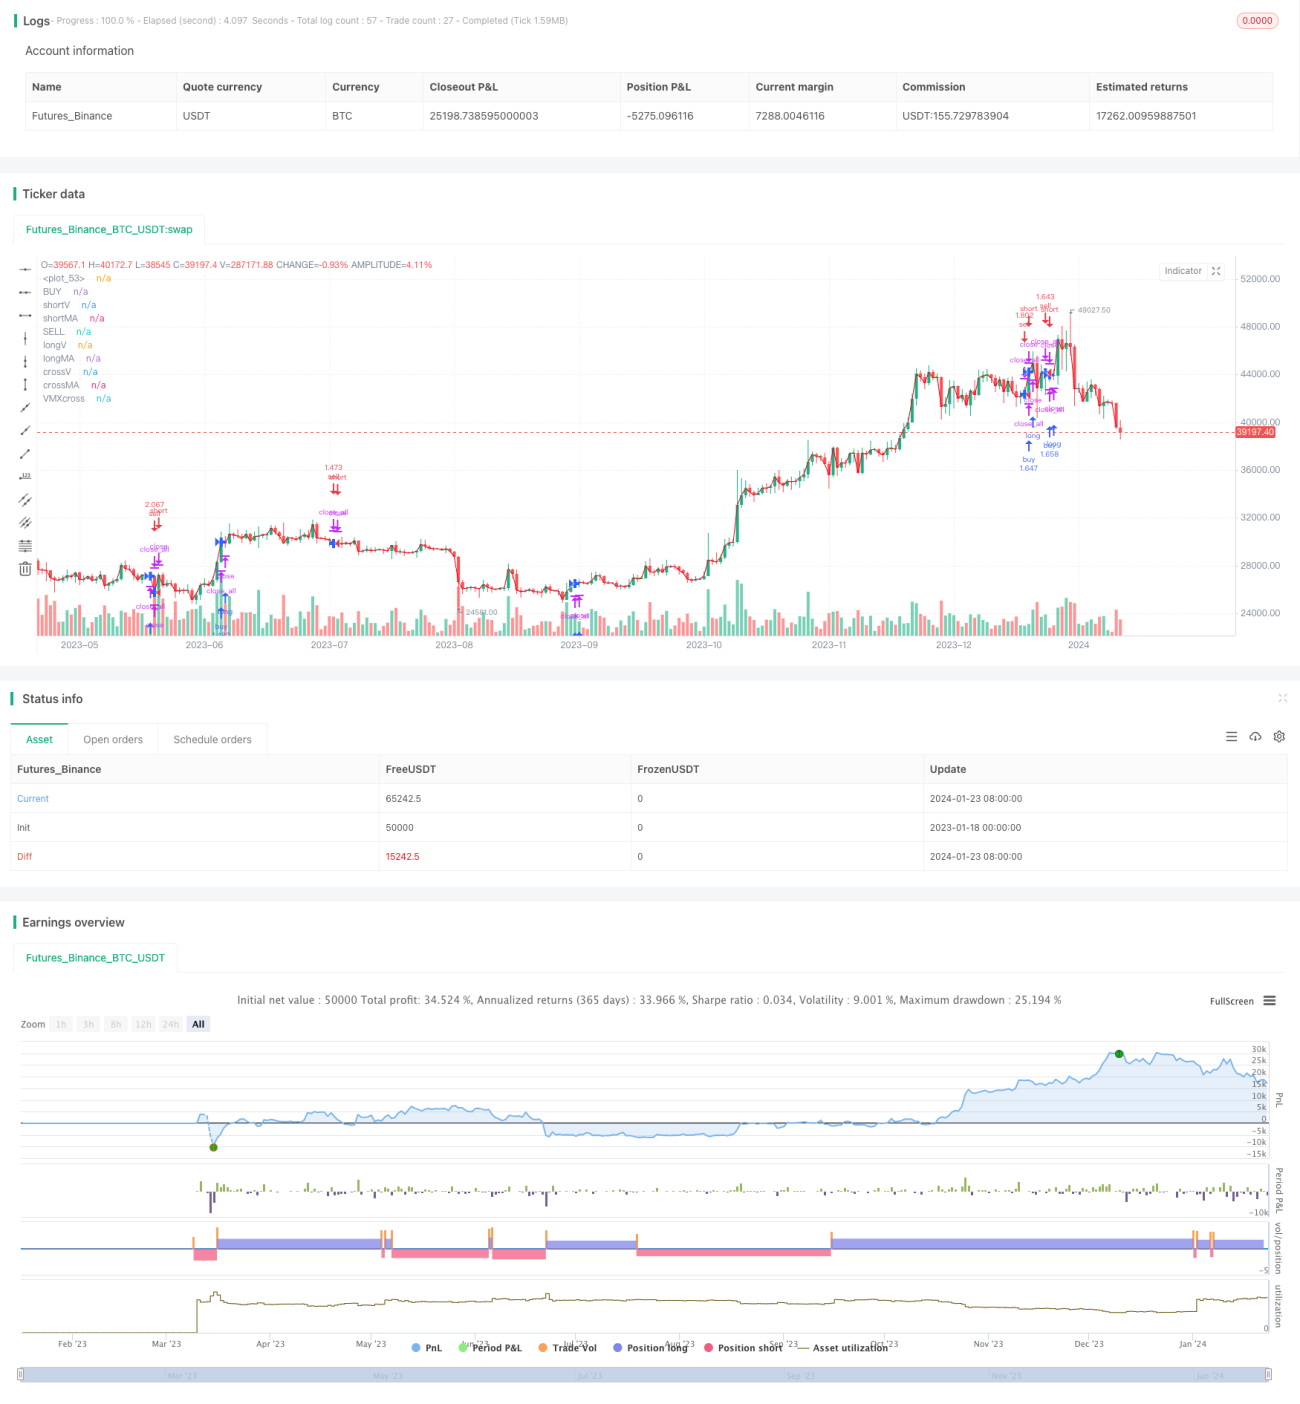
이 전략의 핵심 논리는 이중 지수 이동 평균을 기반으로 한다. 지표 1은 단기 20일 EMA, 지표 2는 장기 50일 EMA이다. 단기 EMA는 아래에서 긴 EMA를 통과하면 구매 신호를 발생시킨다. 단기 EMA는 위에서 아래로 긴 EMA를 통과하면 판매 신호를 발생시킨다. 이렇게 EMA의 다른 파라미터의 교차를 사용하여 시장의 매수점을 판단한다.

또한, 전략은 또한 Vortex의 양적 지표를 사용하여 트렌드를 판단하고 거래 신호를 생성합니다. Vortex 지표는 최고 가격과 어제의 종료 가격, 최저 가격과 어제의 종료 가격의 차이를 계산하여 상승과 하락의 방향을 판단합니다. 1일과 3일 주기입니다. Vortex 지표와 결합하면 일부 비 주요 트렌드를 필터링 할 수 있습니다.

거래 신호가 발생했을 때, 전략에 내장된 자금 관리 모듈에 따라 이익/손실 비율 원칙과 결합하여 위험 관리를 수행한다. 전략은 수익을 잠금하기 위해 중지 손실과 중지 위치를 설정하여 위험을 통제 할 수 있습니다.

우위 분석

  • 1. 이중 EMA 크로스 및 Vortex 양적 지표를 통합하여 지표의 장점을 최대한 활용하여 신호 정확성을 향상시키는 전략
  • 2. 자동화된 거래 시스템, 인적 참여 없이, 인간으로 인한 오류의 가능성을 낮추는 것
  • 3. 내장된 자동 상쇄 기능으로 한 거래의 최대 손실을 제한할 수 있습니다.
  • 4. 재원 관리 모듈은 각 거래의 출자금 비율을 제어하여 전체 거래 위험을 제어합니다.

위험 분석

  • 1. EMA 교차 신호는 가짜 신호가 발생할 수 있으며, Vortex 양적 지표는 가짜 신호를 완전히 필터링 할 수 없기 때문에 손실 가능성이 있습니다.
  • 2. 급격한 주요 블랙 스완 사건은 단독 거래 손실을 직접적으로 확대할 수 있습니다.
  • 3. 회수 제어 의존 스톱 손실 기능, 스톱 손실을 뚫면 더 큰 손실을 초래할 수 있습니다.

최적화 방향:

  • 1. 테스트를 통해 EMA 파라미터를 조정하고 교차 신호를 최적화할 수 있다.
  • 2. 더 많은 지표가 필터링 신호와 결합될 수 있습니다.
  • 3. 기계 학습 알고리즘을 통해 매개 변수를 자동으로 최적화 할 수 있습니다.

요약하다

이 전략은 전반적으로 전형적인 쌍 EMA 교차 전략으로, EMA의 다양한 파라미터 간의 교차를 사용하여 시장의 매매 시기를 판단하는 중·단계 거래 전략에 속한다. 전략의 가장 큰 장점은 수량 지표를 사용하여 신호 필터링을 수행하고, 자동화 된 거래 시스템을 통해 무인 가치보호를 구현하며, 내장 된 스톱 손실 스톱을 사용하여 위험을 제어하고, 비교적 안정적이다. 후기에는 파라미터 최적화 및 더 많은 보조 지표를 도입하여 전략의 효과를 더욱 향상시킬 수 있다.

전략 소스 코드
/*backtest
start: 2023-01-18 00:00:00
end: 2024-01-24 00:00:00
period: 1d
basePeriod: 1h
exchanges: [{"eid":"Futures_Binance","currency":"BTC_USDT"}]
*/

// This source code is subject to the terms of the Mozilla Public License 2.0 at https://mozilla.org/MPL/2.0/
// © smottybugger 

//@version= 5
strategy("The  Averages Moving_X_Vortex", shorttitle="2.5billion BTC lol" , calc_on_order_fills=true, calc_on_every_tick=true, commission_type=strategy.commission.percent, commission_value=0.02, default_qty_type=strategy.percent_of_equity, default_qty_value=100, initial_capital=100, margin_long=0, margin_short=0,overlay=true)
// Dual Vortex
period_1 = input(15, "short Time")
period_2 = input(25, "long time")
VMP = math.sum(math.abs(high - low[3]), period_1)
VMM = math.sum(math.abs(low - high[1]), period_2)
STR = math.sum(ta.atr(1), period_1)
STR2 = math.sum(ta.atr(1), period_2)
VXpower= (input(5,"Vortex Power")/10000)*close
shorterV =(VMP / STR)*VXpower
longerV = (VMM / STR2)*VXpower

// MACross
shortlen = input(20, "ShortMa")
longlen = input(29, "LongMA")
shorterMA = ta.sma(close, shortlen)
longerMA = ta.sma(close, longlen)

// Vortex "MACross Stabilized"
Varance = input(1, "Vortex Stabilize")
Vpercent = (Varance / 100)
shortV= ((((shorterMA-close)* Vpercent)+shorterV)/2)+close
longV = ((((longerMA -close )*Vpercent)+longerV)/2)+close

//MAcross vortex stabilized
Marance = input(1, "MACross Stabilize")
MApercent = Marance / 100
shortMA = ((((shorterMA-close)*MApercent)+shorterV)/2)+close
longMA = ((((longerMA-close)*MApercent)+longerV)/2)+close

//VMXadveraged Moving cross adveraged
VMXL=(longV+longMA)/2
VMXS=(shortV+shortMA)/2
VXcross= ta.cross(VMXS,VMXL) ? VMXS : na
VMXcross= ta.cross(VMXS,VMXL)

//plot
plot(VMXS,"BUY",color=#42D420)
plot(VMXL,"SELL",color=#e20420)
crossV= ta.cross(shortV, longV) ? shortV : na
plot(shortV ,"shortV", color=#42D420)
plot(longV,"longV", color=#e20420)
plot(crossV,"crossV", color=#2962FF, style=plot.style_cross, linewidth=4)
crossMA = ta.cross(shortMA, longMA) ? shortMA : na
plot(shortMA,"shortMA", color=#42D420)
plot(longMA,"longMA", color=#e20420)
plot(crossMA,"crossMA", color=#2962FF, style=plot.style_cross, linewidth=4)
plot(VXcross,"VMXcross",color=#2962FF, style= plot.style_cross,linewidth=4)
plot(close,color=#999999)

// Vortex Condistyle
is_Vlong =shortV< longV
is_Vshort =shortV>longV


// Vortex commands
Vlong =  ta.crossunder(longV, shortV)
Vshort =ta.crossover(shortV,longV)
VorteX = ta.cross(longV, shortV)

// MACross Conditions
is_MAlong = shortMA < longV
is_MAshort = shortMA > shortV


//VMX Conditions
is_VMXlong=VMXS<VMXL
is_VMXshort=VMXS>VMXL

// MA commands
MAlong = ta.crossunder(shortMA, longV)
MAshort =ta.crossover(shortMA, shortV)
MAcross =  ta.cross(shortMA, longMA)
 
//VMX COMMANss
VMXBUY=ta.crossover( VMXS,VMXL)
VMXSELL=ta.crossunder(VMXS,VMXL)

// Close Crossing PositionLMXs

CS=is_MAshort or is_VMXshort
CL= is_MAlong or is_VMXlong
OS=MAshort or VMXSELL
OL=MAlong or VMXBUY


if VMXcross
    strategy.close_all ("closed")

//if CS and  OL
    strategy.close("Short",comment="Short Closed")


//if CL and  OS
    strategy.close("Long",comment="Long Closed" ) 

//CA1= is_MAcross and is_VorteX
//if CA1
   // strategy.close_all(comment="X2X")

// Defalongyntry qty

if is_VMXlong and VMXSELL
    strategy.entry("sell",strategy.short)


if is_VMXshort and VMXBUY
    strategy.entry("buy",strategy.long)


// Stop Losses & Taking Profit
sllp = input(0, "Stop Loss Long")
sll = (1 - sllp / 100) * strategy.position_avg_price
is_sll = input(true, "Stop Long")

tplp = input(0, "Take Profit Long")
tpl = (1 + tplp / 100) * strategy.position_avg_price
is_tpl = input(true, "Take Long")

slsp = input(0, "Stop Loss Short")
sls = (1 + slsp / 100) * strategy.position_avg_price
is_sls = input(true, "Stop Short")

tpsp = input(0, "Take Profit Short")
tps = (1 - tpsp / 100) * strategy.position_avg_price
is_tps = input(true, "Take Short")

if (is_sll or is_sls) 
    strategy.close("Stop Losses", qty_percent=100)

if (is_tpl or is_tps) 
    strategy.close("Take Profits", qty_percent=100)


 //Strategy Backtest
//plot(strategy.equity, "Equity", color=color.red, linewidth=2, style=plot.style_areabr)