다중 시간 프레임 트렌드 헌터 전략

개요
다중 시간 프레임 트렌드 헌터 전략 (Multitimeframe Trend Hunter Strategy) 은 여러 지표를 사용하여 자동화 된 거래 신호를 구현하는 전략이다. 이 전략은 이동 평균, 슈퍼 트렌드 지표 및 클라우드 그래프 지표 등을 사용하여 여러 시간 프레임 내에서 트렌드 방향을 판단하여 잠재적인 거래 기회를 발견합니다.
전략 원칙
이 전략의 핵심 원칙은 동시에 높은 시간 프레임과 낮은 시간 프레임에서 트렌드 방향을 판단하는 것입니다. 전략은 먼저 높은 시간 프레임에서 중요한 이동 평균, 슈퍼 트렌드 라인 및 1 클라우드 그래프의 변환 라인, 기준 라인 등을 계산합니다. 그리고 낮은 시간 프레임에서 슈퍼 트렌드 라인을 계산합니다. 높은 낮은 시간 프레임의 슈퍼 트렌드 라인 방향이 일치하면 현재 전체 트렌드 방향이 확인됩니다.
특정 조건이 충족되면, 이 전략은 구매 또는 판매 거래 신호를 생성한다. 사용자는 자신의 필요에 따라 장편, 단편 또는 둘 다 거래 할 수 있습니다. 또한 사용자는 이동 평균 파라미터, 슈퍼 트렌드 파라미터, 하나의 클라우드 그래프 파라미터 등을 구성하여 전략의 성능을 최적화 할 수 있습니다.
우위 분석
이 전략의 가장 큰 장점은 다중 시간 프레임과 다중 지표의 결합에 있습니다. 이는 트렌드 방향을 판단하는 정확도를 크게 향상시키고, 반전 기회를 제 시간에 발견할 수 있습니다. 구체적인 장점은 다음과 같습니다:
- 동향을 확인하기 위해 높은, 낮은 시간 프레임을 사용하여 시장 소음에 의해 오해하지 마십시오.
- 이동 평균은 주요 트렌드 방향을 판단하는 중장선 지표입니다.
- 수퍼 트렌드 라인은 트렌드 반전을 잡을 수 있는 단기적인 지표입니다.
- 클라우드 그래프는 저항 영역을 판단하여 잠재적인 기회를 발견합니다.
위험 분석
이 전략의 주요 위험은 매개 변수 설정을 잘못하면 너무 자주 거래하거나 기회를 놓치게 될 수 있다는 것입니다. 또한, 지표가 잘못된 신호를 내보내면 손실이 발생할 수 있습니다. 구체적인 위험과 해결 방법은 다음과 같습니다:
- 매개 변수 설정 위험: 최적의 매개 변수 조합을 찾기 위해 많은 재검토 및 최적화
- 잘못된 신호 위험: 더 많은 지표와 함께 검증하여 잘못된 신호를 피하십시오.
- 회수 위험: 위치 관리를 적절하게 조정하고 단편 손실을 제어합니다.
최적화 방향
이 전략에는 더 많은 최적화 가능성이 있습니다:
- 부린 띠, RSI 등과 같은 더 많은 지표 조합을 추가하여 판단의 정확성을 향상시킵니다.
- 더 지능적인 거래 전략을 위한 기계 학습 모델을 통합합니다.
- 고주파 거래, 얼리버드 (Early Bird) 와 같은 수량 기술을 결합하여 전략적 성과를 더욱 향상시킵니다.
- 포지션 관리 전략을 최적화하여 포지션을 동적으로 조정하여 회수 위험을 낮추십시오.
요약하다
종합적으로, 다중 시간 프레임 트렌드 사냥꾼 전략은 여러 지표와 다중 시간 프레임을 사용하여 추세를 판단하고, 반전 기회를 신속하게 잡을 수 있습니다. 이 전략은 통합도가 높고, 널리 사용되며, 미래에는 여전히 많은 최적화 공간이 있으며, 양자 거래자가 계속 연구하고 적용할 가치가 있습니다.
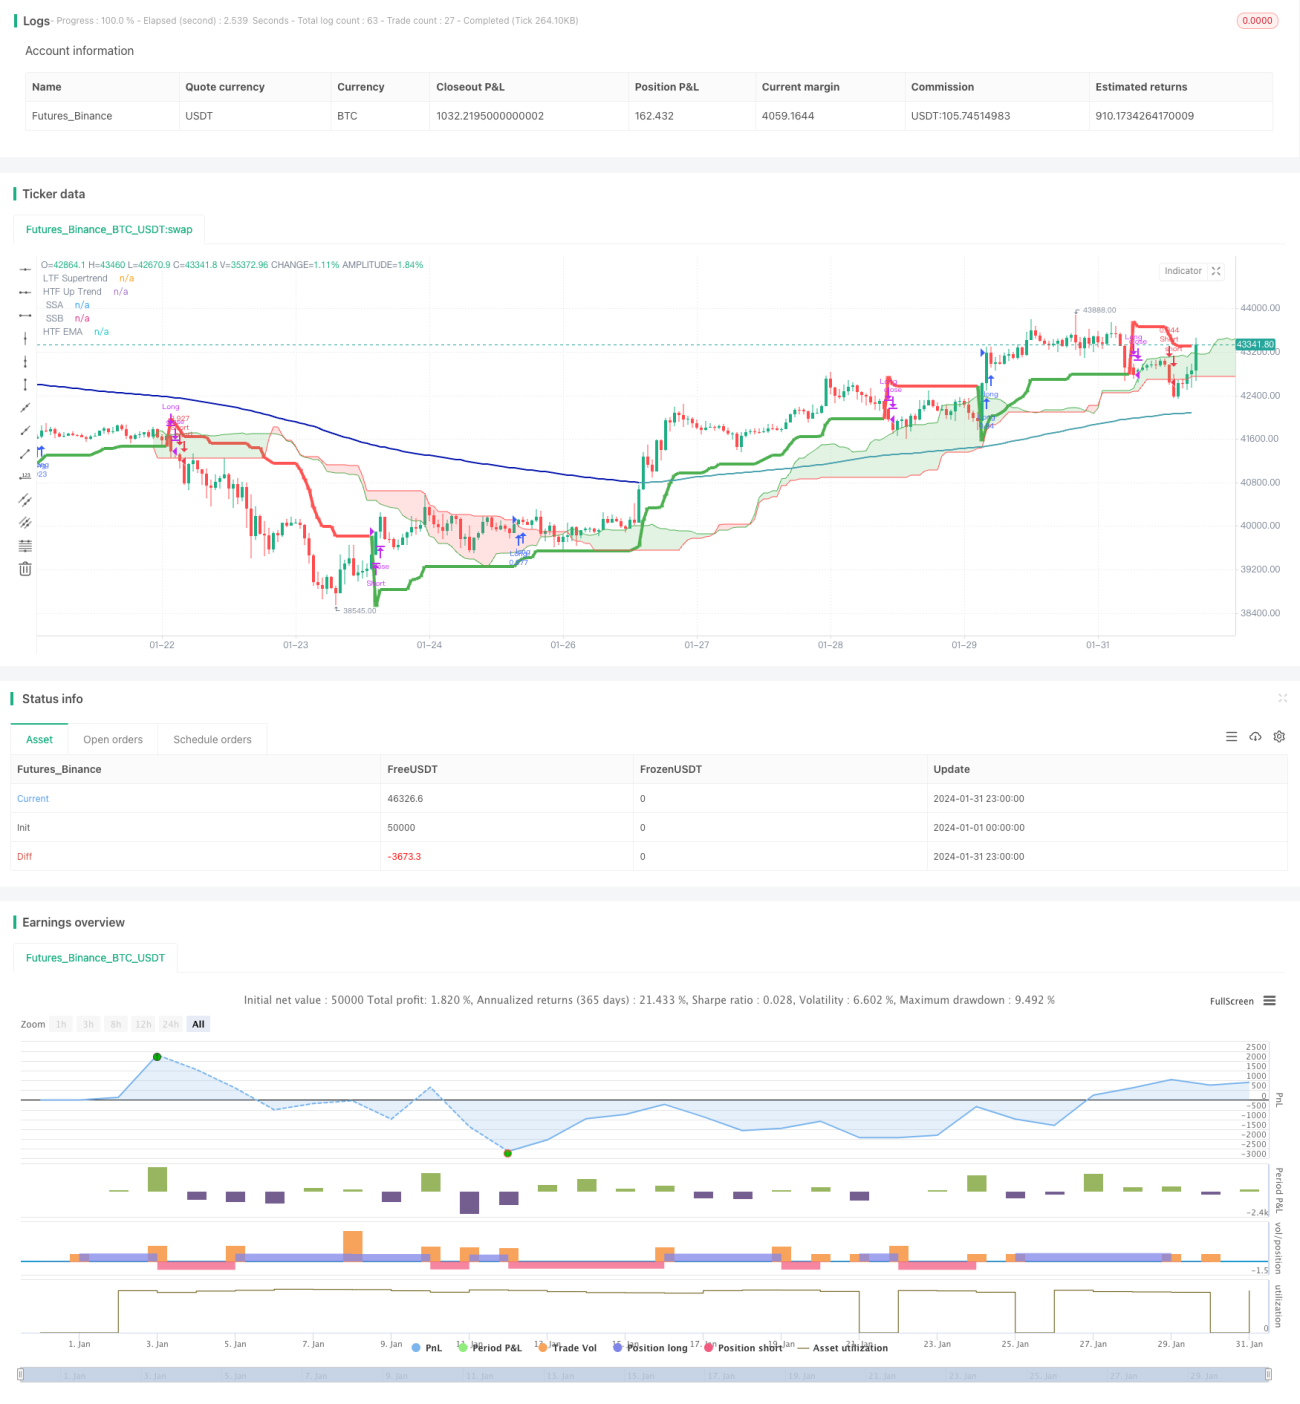
/*backtest
start: 2024-01-01 00:00:00
end: 2024-01-31 23:59:59
period: 1h
basePeriod: 15m
exchanges: [{"eid":"Futures_Binance","currency":"BTC_USDT"}]
*/

// This Pine Script™ code is subject to the terms of the Mozilla Public License 2.0 at https://mozilla.org/MPL/2.0/
// © godzcopilot / blockybears

// Thanks to anthonyf50 for his MTF Ichimoku https://www.tradingview.com/script/Pw9cBFma/- 1