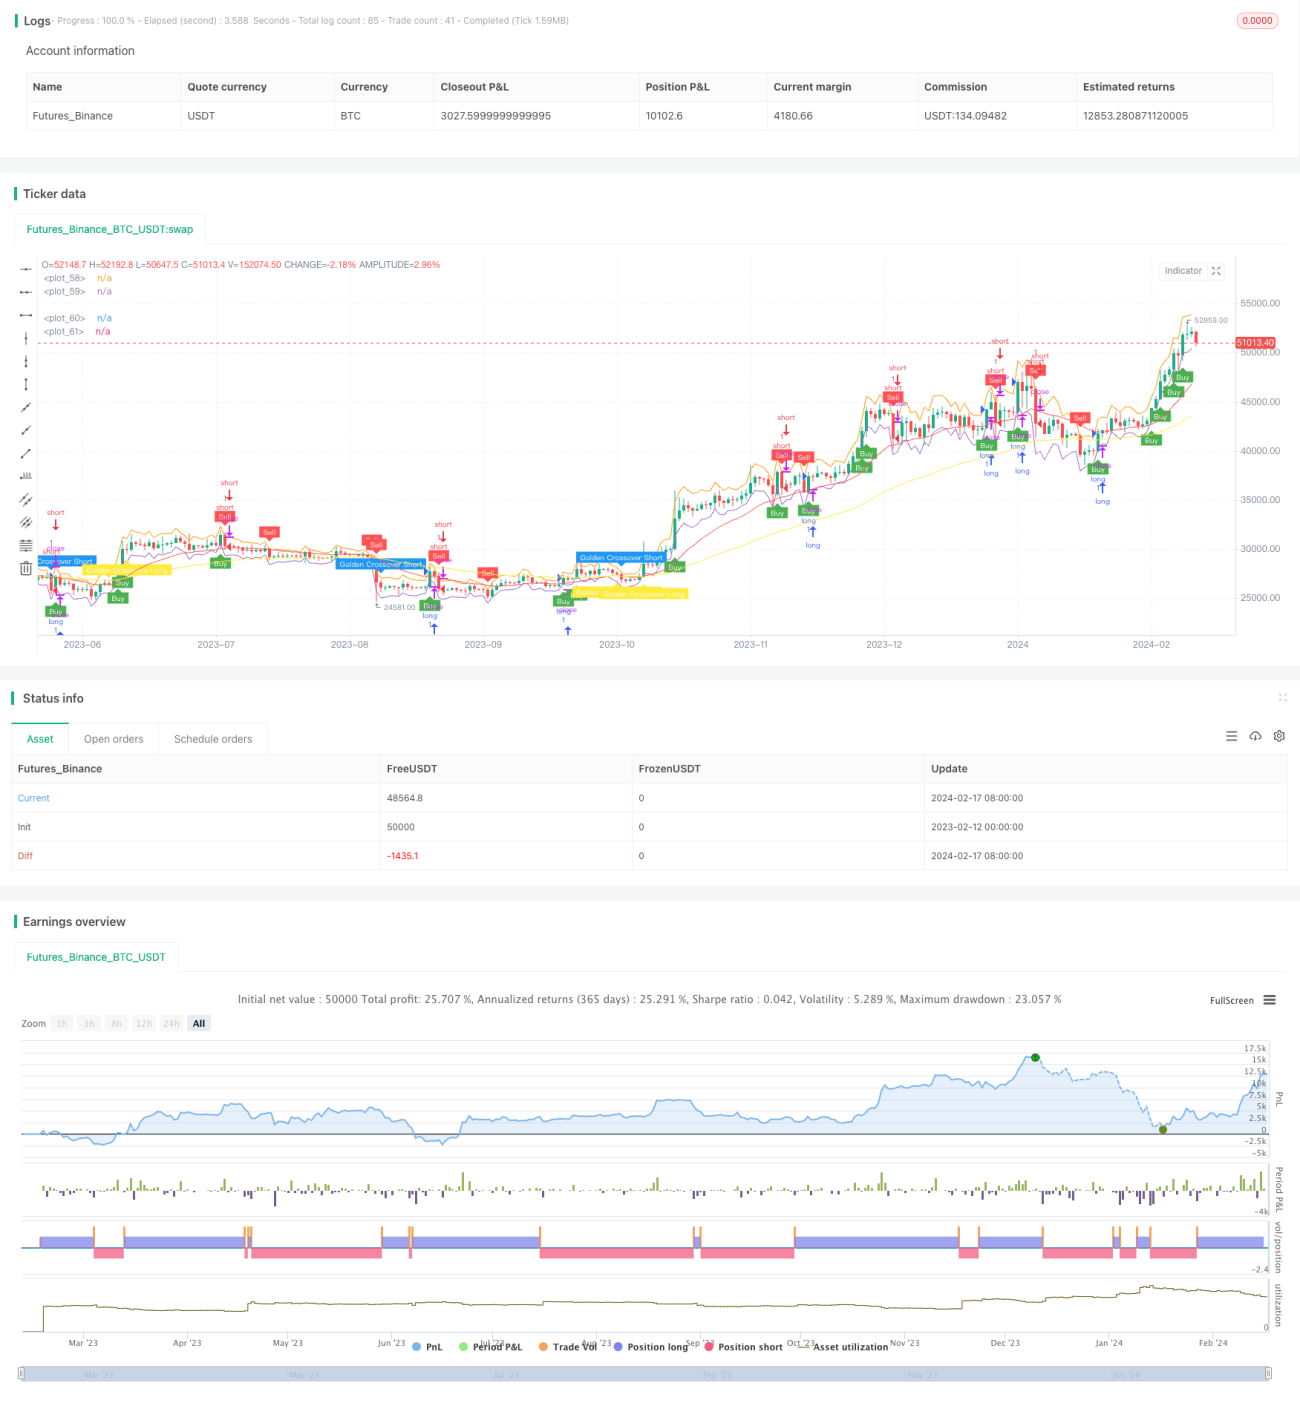
Gem Forest 1분 탈출 전략

저자:차오장, 날짜: 2024-02-19 10:56:07
태그:

img

전반적인 설명

Gem Forest 1분 브레이크아웃 전략은 빠른 수익을 얻기 위해 1분 시간 내에 브레이크아웃 신호를 캡처하는 것을 목표로 하는 양적 거래 전략이다. 이 전략은 이동 평균, ATR, RSI와 같은 여러 지표를 통합하여 거래 신호를 생성하고 짧은 보유 기간 동안 더 높은 위험 보상 비율을 달성합니다.

전략 논리

이 전략은 주로 다음과 같은 요소를 사용하여 거래 신호를 형성합니다.

  1. ATR 지표 - 가격 채널을 설정하기 위한 평균 실제 범위를 계산합니다.
  2. 이동 평균 지표 - 금색 십자/죽은 십자 신호를 생성하기 위해 빠른 EMA와 느린 EMA를 계산합니다.
  3. RSI 지표 - 과잉 매수/ 과잉 판매 영역을 결정하기 위해 빠르고 느린 RSI를 계산합니다.
  4. 가격 채널 관계 - 가격이 채널을 벗어날 때 거래 신호를 생성합니다.

특히, 전략은 ATR, 빠른 EMA, 느린 EMA, 빠른 RSI 및 느린 RSI의 N 기간 평균을 계산합니다. ATR 채널, EMA 골든 크로스 및 RSI가 극단적 수준에 도달하는 가격 경류 조건을 결합하여 전략은 구매 또는 판매 신호를 발송합니다.

이점 분석

이 전략의 주요 장점은 다음과 같습니다.

  1. 단기 가격 동향을 포착합니다.
  2. 빠른 반응, 고주파 거래에 적합합니다.
  3. 여러 개의 필터 표시기가 더 안정적입니다.
  4. 사용자가 최적화할 수 있는 매개 변수입니다.

위험 분석

또한 몇 가지 위험이 있습니다.

  1. 단기 거래에서 높은 위험, 엄격한 스톱 손실이 필요합니다.
  2. 부적절한 매개 변수 최적화로 인해 과도한 부착이 발생합니다.
  3. 높은 거래 빈도는 비용을 증가시킵니다.

위험을 제어하기 위해, 스톱 로스는 시행되어야 하며, 파라미터들은 과도한 적응을 피하기 위해 적절한 백테스트가 필요합니다. 또한, 비용을 제어하기 위해 거래 빈도를 조정해야합니다.

최적화 방향

전략은 다음과 같이 최적화 될 수 있습니다.

  1. 테스트 파라미터 설정은 짧은 기간 (5분, 15분) 에 걸쳐

  2. 신호 품질을 향상시키기 위해 볼륨과 같은 더 많은 필터링 지표를 추가합니다.

  3. ATR 채널 및 이동 평균 매개 변수를 최적화하여 최적의 매개 변수 조합을 찾습니다.

결론

Gem Forest 1분 브레이크아웃 전략은 여러 지표로 필터링하여 단기 트렌드를 포착하는 데 중점을 두고 있으며, 빠른 반응과 높은 위험 보상 특성을 갖추고 있습니다. 더 나은 결과를 위해 매개 변수 최적화를 통해 사용자의 위험 선호도에 맞게 조정할 수 있습니다. 그러나 사용자는 엄격한 스톱 로스, 합리적인 거래 빈도 등을 통해 거래 위험을 제어해야합니다. 전반적으로이 전략은 특정 양 거래 지식과 단기 거래에 대한 위험 관용을 가진 투자자에게 적합합니다.


/*backtest
start: 2023-02-12 00:00:00
end: 2024-02-18 00:00:00
period: 1d
basePeriod: 1h
exchanges: [{"eid":"Futures_Binance","currency":"BTC_USDT"}]
*/

//@version=5
strategy("Gem Forest 1 Dakika Scalp", overlay=true)

source = close
atrlen = input.int(14, "ATR Period")
mult = input.float(1, "ATR Multi", step=0.1)
smoothing = input.string(title="ATR Smoothing", defval="WMA", options=["RMA", "SMA", "EMA", "WMA"])

ma_function(source, atrlen) => 
    if smoothing == "RMA"
        ta.rma(source, atrlen)
    else
        if smoothing == "SMA"
            ta.sma(source, atrlen)
        else
            if smoothing == "EMA"
                ta.ema(source, atrlen)
            else
                ta.wma(source, atrlen)

atr_slen = ma_function(ta.tr(true), atrlen)
upper_band = atr_slen * mult + close
lower_band = close - atr_slen * mult

ShortEMAlen = input.int(21, "Fast EMA")
LongEMAlen = input.int(65, "Slow EMA")
shortSMA = ta.ema(close, ShortEMAlen)
longSMA = ta.ema(close, LongEMAlen)
RSILen1 = input.int(25, "Fast RSI Length")
RSILen2 = input.int(100, "Slow RSI Length")
rsi1 = ta.rsi(close, RSILen1)
rsi2 = ta.rsi(close, RSILen2)
atr = ta.atr(atrlen)

RSILong = rsi1 > rsi2
RSIShort = rsi1 < rsi2

longCondition = open < lower_band
shortCondition = open > upper_band
GoldenLong = ta.crossover(shortSMA,longSMA)
Goldenshort = ta.crossover(longSMA,shortSMA)

plotshape(shortCondition, title="Sell Label", text="Sell", location=location.abovebar, style=shape.labeldown, size=size.tiny, color=color.new(color.red, 0), textcolor=color.white)
plotshape(longCondition, title="Buy Label", text="Buy", location=location.belowbar, style=shape.labelup, size=size.tiny, color=color.new(color.green, 0), textcolor=color.white)
plotshape(Goldenshort, title="Golden Sell Label", text="Golden Crossover Short", location=location.abovebar, style=shape.labeldown, size=size.tiny, color=color.new(color.blue, 0), textcolor=color.white)
plotshape(GoldenLong, title="Golden Buy Label", text="Golden Crossover Long", location=location.belowbar, style=shape.labelup, size=size.tiny, color=color.new(color.yellow, 0), textcolor=color.white)

if (longCondition)
    stopLoss = low - atr * 2
    takeProfit = high + atr * 5
    strategy.entry("long", strategy.long)

if (shortCondition)
    stopLoss = high + atr * 2
    takeProfit = low - atr * 5
    strategy.entry("short", strategy.short)

plot(upper_band)
plot(lower_band)
plot(shortSMA, color = color.red)
plot(longSMA, color = color.yellow)


더 많은