개요
CDC 활동 지역[TS 트레이더] 전략은 CDC 동작 지역 지표의 개조를 기반으로 한 양적 거래 전략이다. 이 전략은 빠른 이동 평균과 느린 이동 평균의 교차를 구매 및 판매 신호로 사용합니다. 빠른 이동 평균 상에서 느린 이동 평균을 통과할 때 구매 신호로, 빠른 이동 평균 아래에서 느린 이동 평균을 통과할 때 판매 신호로 사용됩니다.
전략 원칙
이 전략의 핵심 지표는 빠른 이동 평균과 느린 이동 평균이다. 전략은 우선 가격의 수학적 평균을 계산하고, 사용자가 설정한 주기 길이에 따라 빠른 이동 평균과 느린 이동 평균을 계산한다. 빠른 이동 평균 위에 느린 이동 평균을 통과하면 황소 시장 신호로 간주되며, 빠른 이동 평균 아래에 느린 이동 평균을 통과하면 곰 시장 신호로 간주된다.
시장의 추세를 확인한 후, 전략은 현재의 종결 가격과 이동 평균의 관계를 더 판단한다. 만약 황소 시장이고, 종결 가격이 빠른 이동 평균보다 높다면, 강렬한 구매 신호를; 만약 곰 시장이고, 종결 가격이 빠른 이동 평균보다 낮다면, 강렬한 판매 신호를 낸다.
이러한 구매 및 판매 신호에 따라, 전략은 자동 거래 할 수 있습니다. 구매 신호가 발생하면, 장점 입장을 취하고; 판매 신호가 발생하면, 장점 입장을 매기거나 공백을 열 수 있습니다.
우위 분석
이 전략은 다음과 같은 장점을 가지고 있습니다.
- 이동 평균을 기본 지표로 사용하고, 이론적 기반이 튼튼하고 이해하기 쉽다.
- 두 개의 이동 평균을 결합하면 시장 소음을 효과적으로 필터링하고 시장 추세를 식별할 수 있습니다.
- 마감 가격과 이동 평균의 관계를 결합하여, 더 강한 구매와 판매 시기를 결정할 수 있습니다.
- 전략적 논리는 간단하고 명확하며, 자동화 거래가 가능합니다.
- 시장에 따라 이동 평균 주기를 조정할 수 있고, 다른 상황에 적응할 수 있다.
위험 분석
이 전략에는 몇 가지 위험도 있습니다.
- 이동 평균이 지연되어 있고, 단선 기회를 놓칠 수 있습니다.
- 이 경우, 그 추세가 반전될 경우, 더 큰 손실을 초래할 수 있습니다.
- 리드 디스크와 차이가 있을 수 있으며, 리드 디스크 효과는 떨어질 수 있다.
이러한 위험에 대해, 다른 지표들을 조합하여 진입 시기를 결정하거나, 이동 평균 주기를 적절히 단축하여 지연성을 줄이는 등의 방법이 최적화될 수 있다.
최적화 방향
이 전략은 다음과 같은 부분에서 최적화될 수 있습니다.
- 이동 평균의 순환을 최적화하여 시장의 변화에 적응합니다.
- 거래량이 증가하는 것과 같은 지표들을 필터링하는 것.
- 다른 지표들과 함께 추세가 뒤집혔습니다.
- 손실을 통제하기 위한 스톱로스 전략을 추가한다.
요약하다
전체적으로, CDC의 활동 지역은[TS 트레이더] 전략은 쌍 이동 평균 교차를 활용하여 비교적 간단하고 실용적인 정량화 거래 전략을 구현한다. 이 전략은 이해하기 쉽고 실행할 수 있는 장점이 있지만, 또한 몇 가지 최적화 가능한 공간도 있다. 지속적인 테스트와 최적화를 통해 이 전략은 장기적으로 보유할 가치가 있는 안정적인 전략이 될 수 있다.
/*backtest
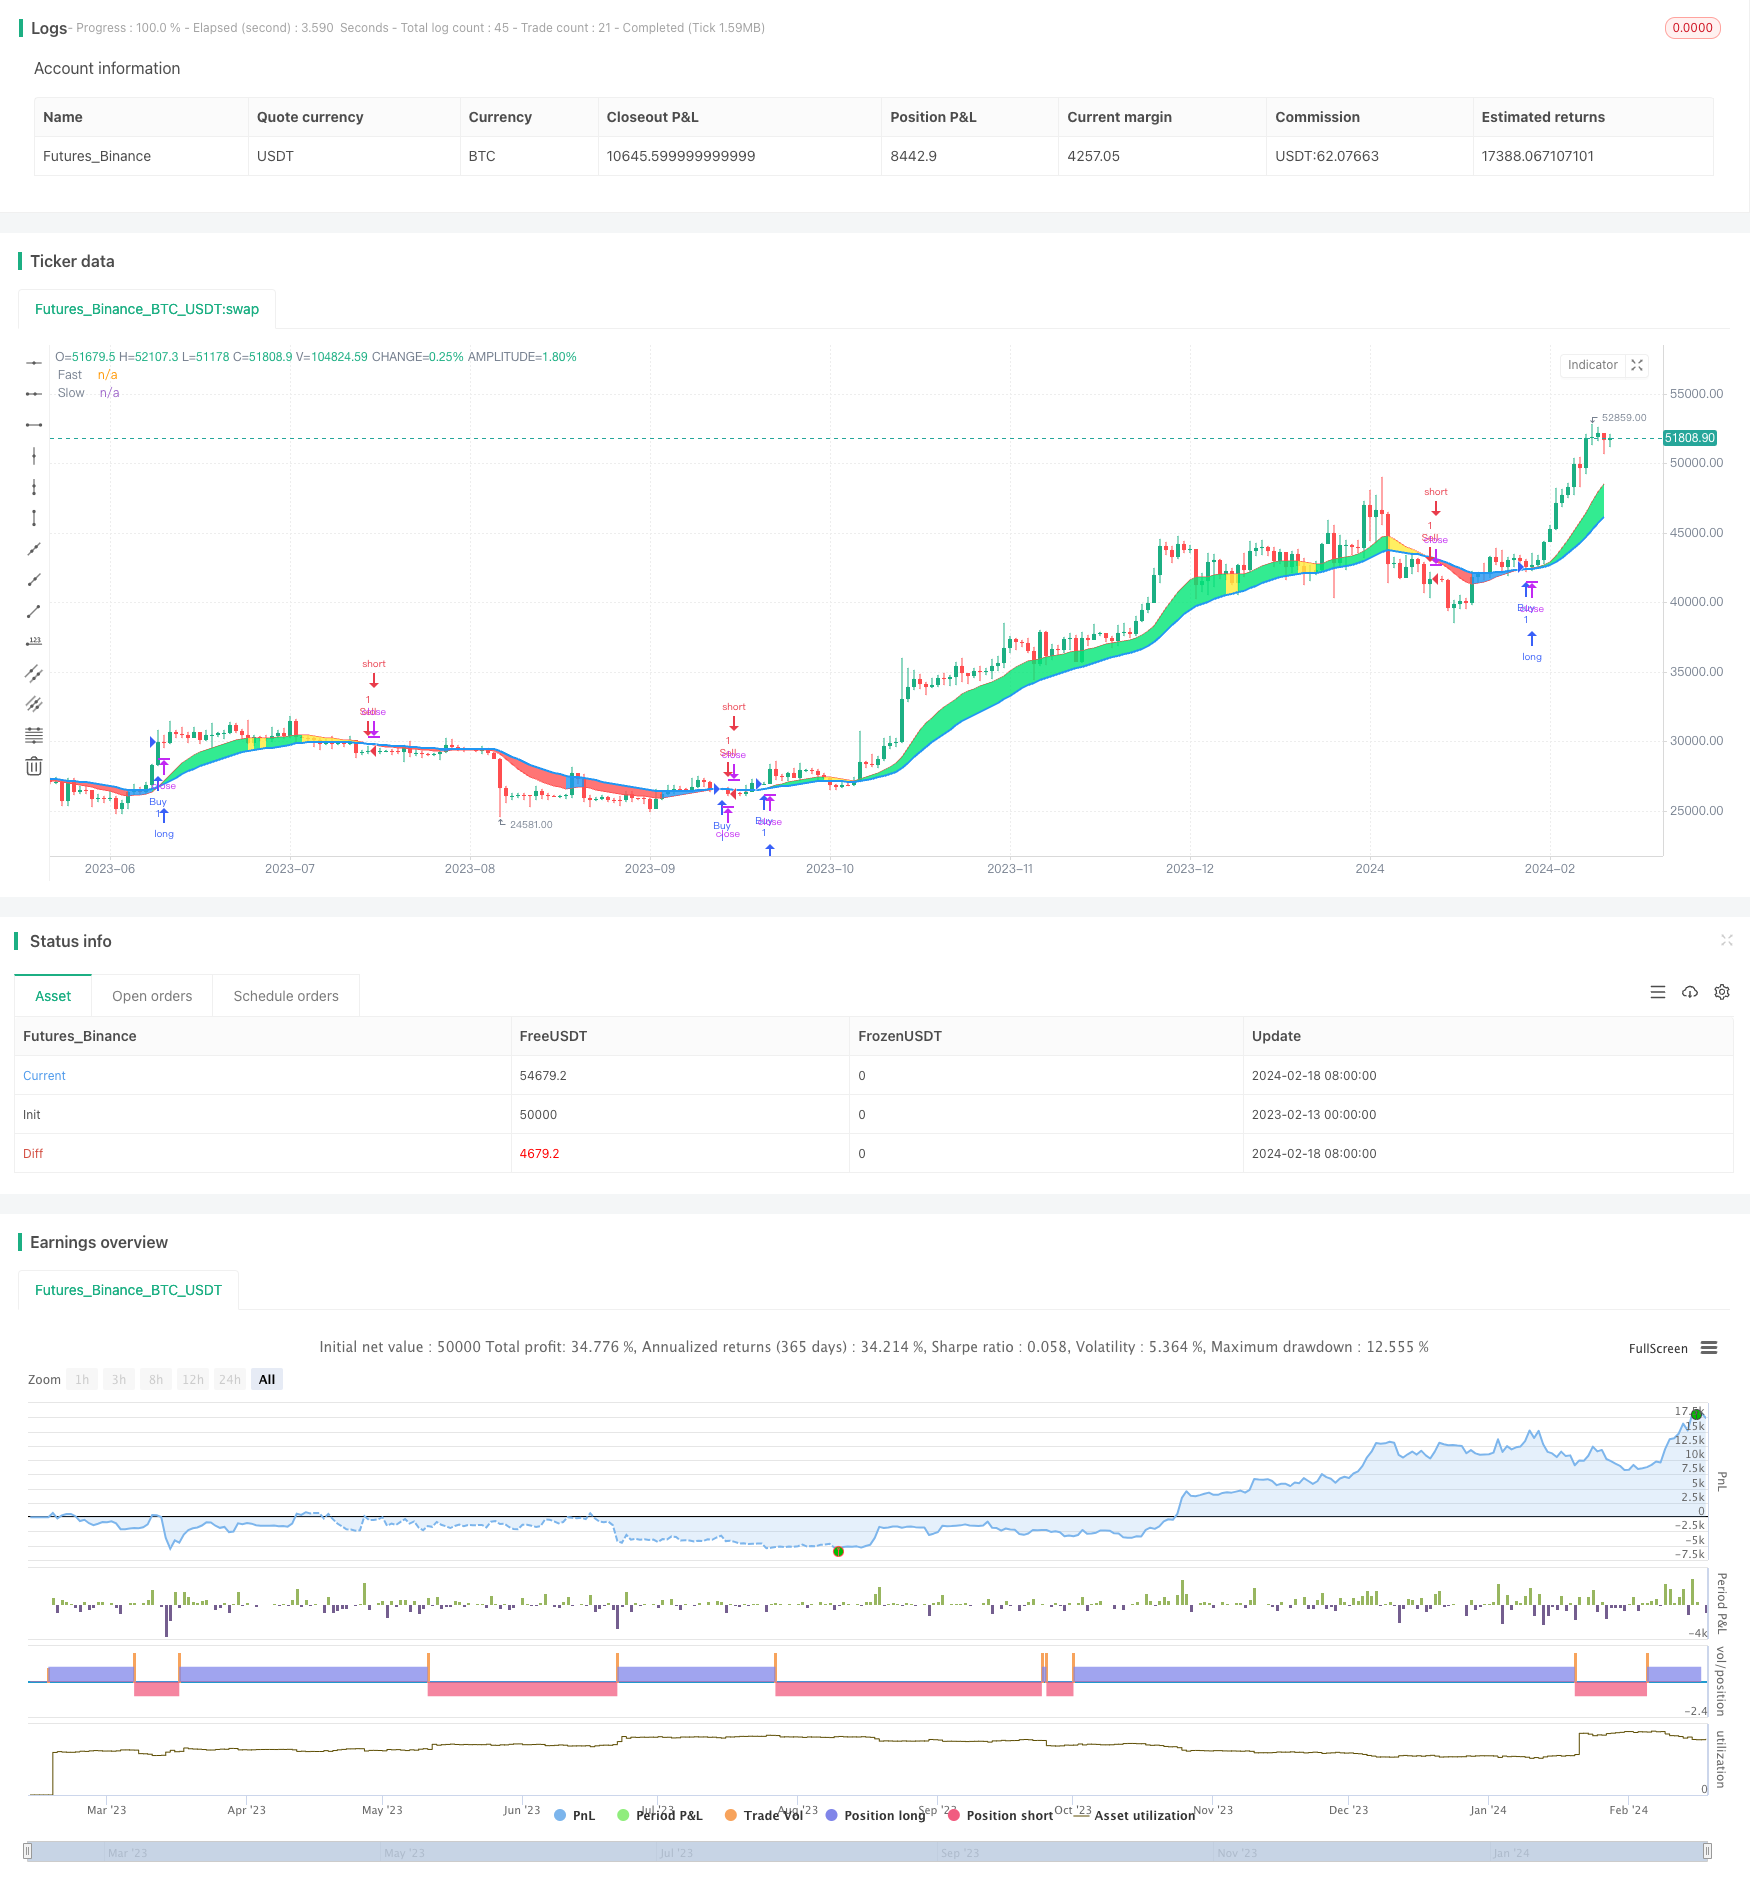
start: 2023-02-13 00:00:00
end: 2024-02-19 00:00:00
period: 1d
basePeriod: 1h
exchanges: [{"eid":"Futures_Binance","currency":"BTC_USDT"}]
*/
//@version=4
strategy("CDC Action Zone [TS Trader]", overlay=true)
// CDC ActionZone V2 29 Sep 2016
// CDC ActionZone is based on a simple 2MA and is most suitable for use with medium volatility market
// 11 Nov 2016 : Ported to Trading View with minor UI enhancement
src = input(title="Data Array", type=input.source, defval=ohlc4)
prd1 = input(title="Short MA period", type=input.integer, defval=12)
prd2 = input(title="Long MA period", type=input.integer, defval=26)
AP = ema(src, 2)
Fast = ema(AP, prd1)
Slow = ema(AP, prd2)
// === INPUT BACKTEST RANGE ===
FromYear = input(defval = 2019, title = "From Year", minval = 2009)
FromMonth = input(defval = 1, title = "From Month", minval = 1, maxval = 12)
FromDay = input(defval = 1, title = "From Day", minval = 1, maxval = 31)
ToYear = input(defval = 9999, title = "To Year", minval = 2009)
ToMonth = input(defval = 12, title = "To Month", minval = 1, maxval = 12)
ToDay = input(defval = 31, title = "To Day", minval = 1, maxval = 31)
// === FUNCTION EXAMPLE ===
start = timestamp(FromYear, FromMonth, FromDay, 00, 00) // backtest start window
finish = timestamp(ToYear, ToMonth, ToDay, 23, 59) // backtest finish window
window() => true
Bullish = Fast > Slow
Bearish = Fast < Slow
Green = Bullish and AP > Fast
Red = Bearish and AP < Fast
Yellow = Bullish and AP < Fast
Blue = Bearish and AP > Fast
//Long Signal
Buy = Green and Green[1] == 0
Sell = Red and Red[1] == 0
//Short Signal
Short = Red and Red[1] == 0
Cover = Red[1] and Red == 0
//Plot
l1 = plot(Fast, "Fast", linewidth=1, color=color.red)
l2 = plot(Slow, "Slow", linewidth=2, color=color.blue)
bcolor = Green ? color.lime : Red ? color.red : Yellow ? color.yellow : Blue ? color.blue : color.white
barcolor(color=bcolor)
fill(l1, l2, bcolor)
strategy.entry("Buy", strategy.long, when=window() and Buy)
strategy.entry("Sell", strategy.short, when=window() and Sell)
strategy.close("Buy", when=window() and Sell)
strategy.close("Sell", when=window() and Buy)