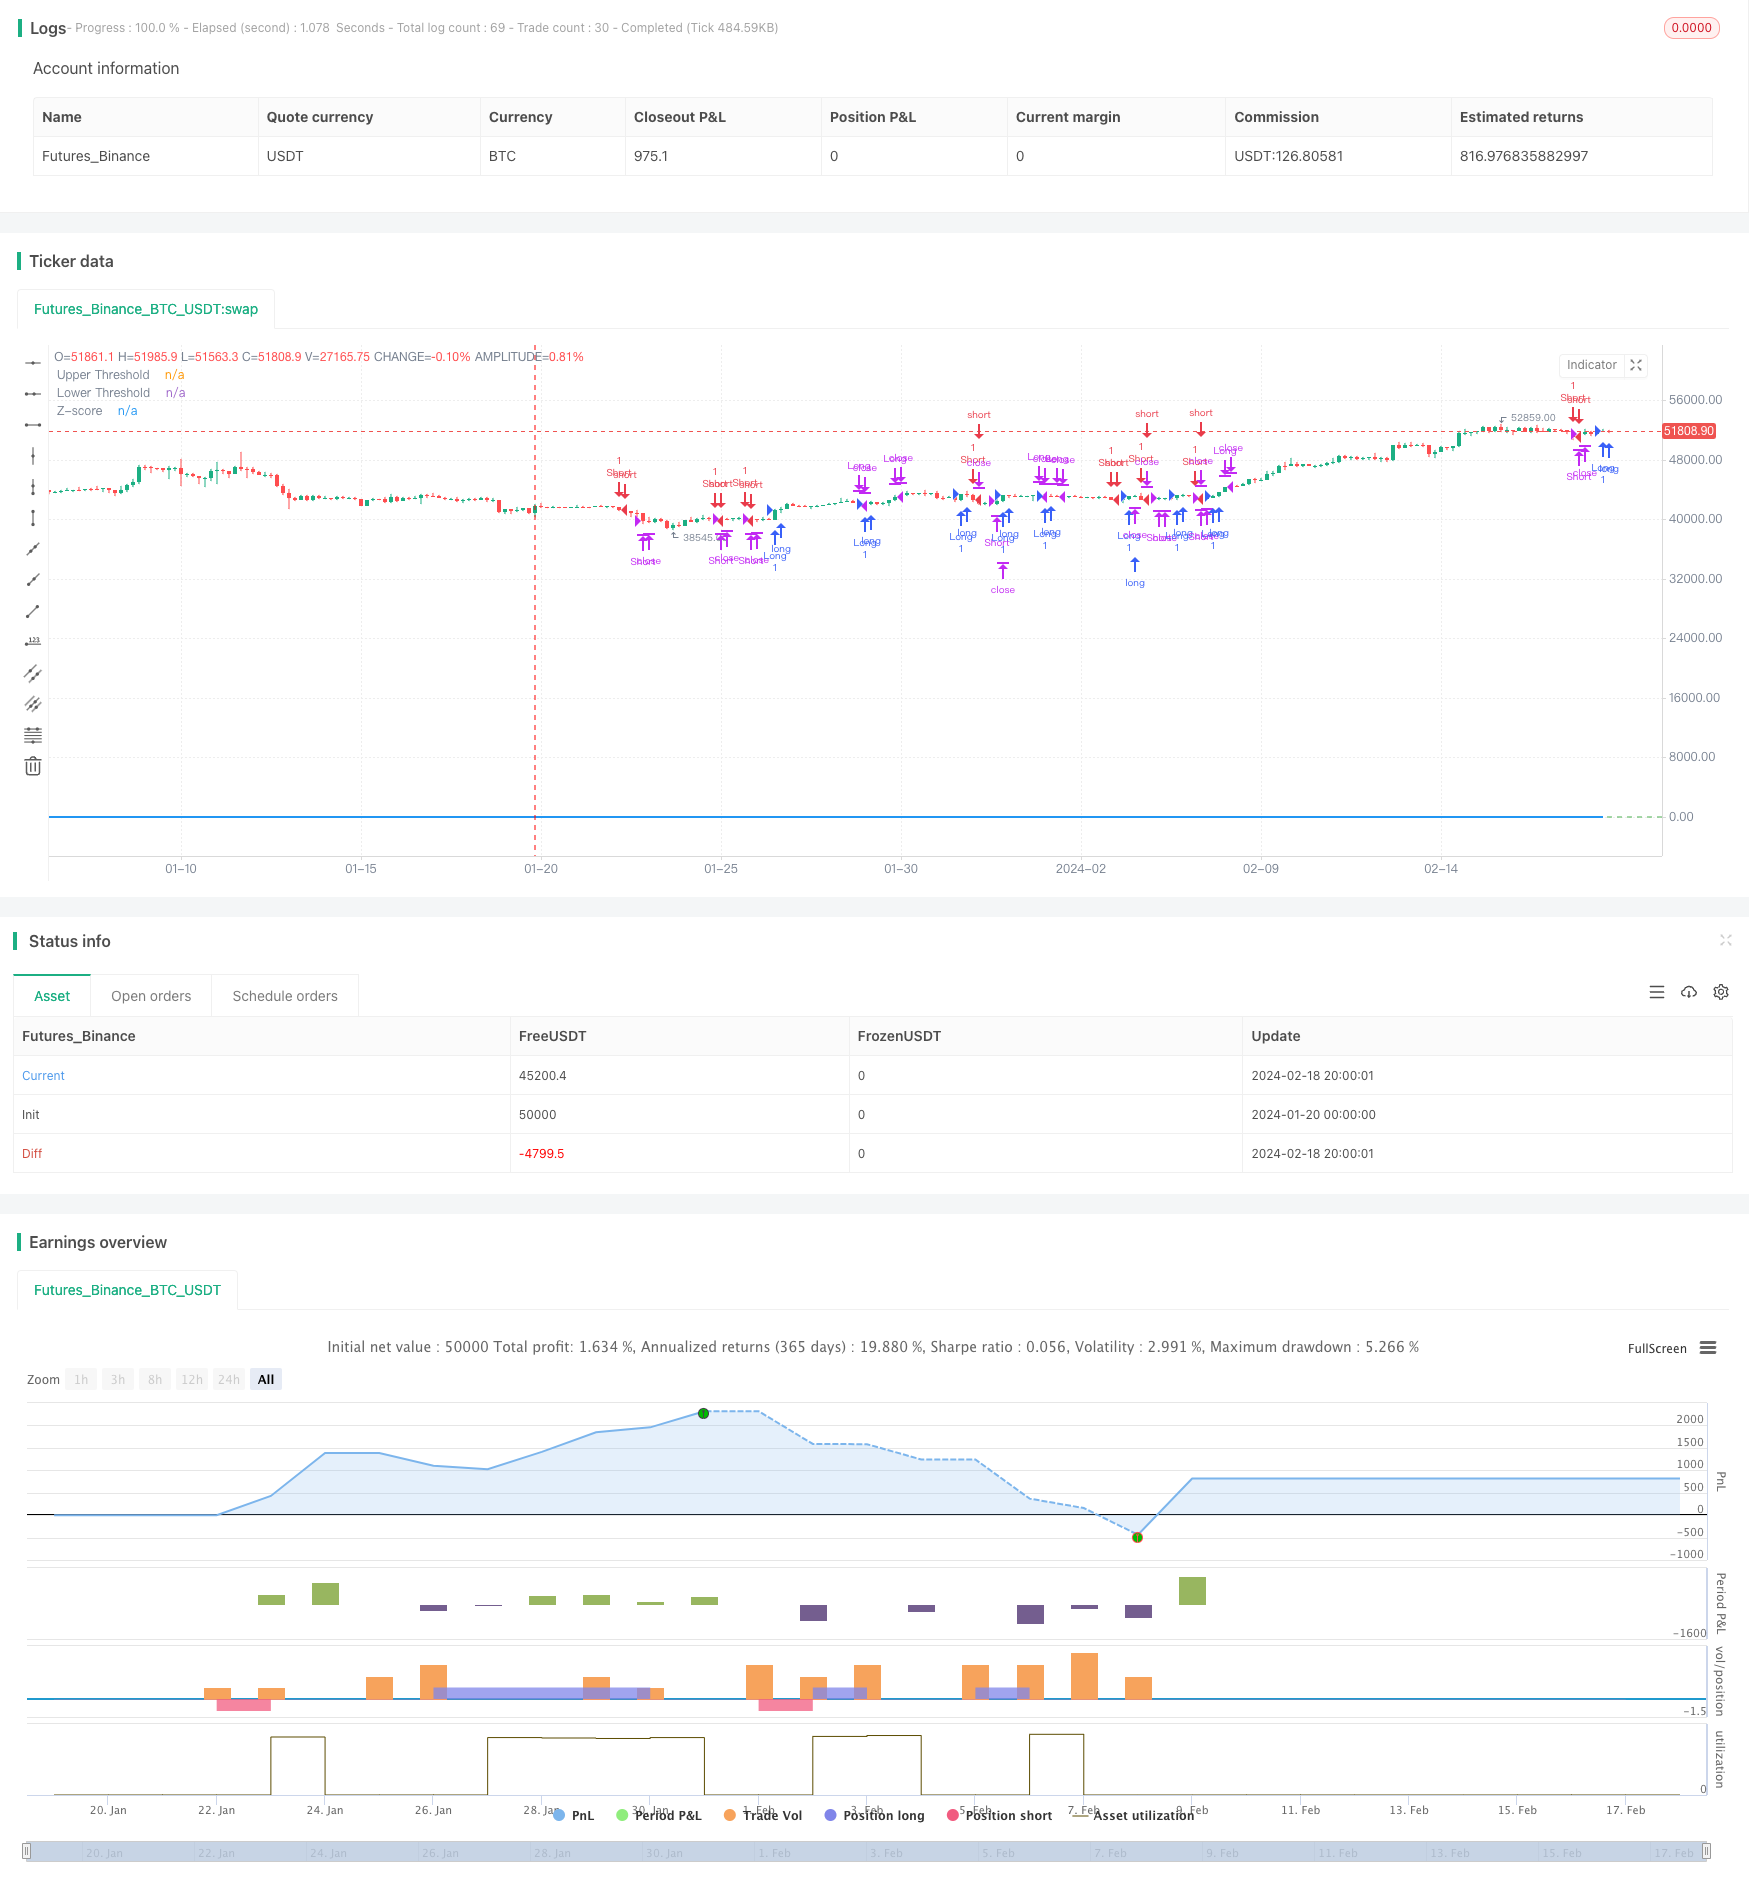
개요
이 전략은 21일 지수 이동 평균에 대한 금 가격의 편차 정도를 계산하여 표준 차와 결합하여 시장의 과매매 상황을 판단합니다. 편차 정도가 특정 표준 차에 도달하면 트렌드 추적 전략을 취하며 손실 제도를 설정하여 위험을 제어합니다.
전략 원칙
- 21일 지수 이동 평균을 중앙축으로 계산합니다.
- 이동 평균과 금 가격의 오차를 계산하는 방법
- Z-Score로 변환하는 편차를 표준화합니다.
- Z-Score 위에 0.5를 씌우면, 더 많이 하고, Z-Score 아래에 -0.5를 씌우면, 공백을 씁니다.
- Z-Score가 0.5/-0.5로 떨어지면 평점
- Z-Score가 3/-3 이상되면, 중지
우위 분석
이 전략은 가격 동력과 표준 격차를 기반으로 시장의 과매매를 판단하는 트렌드 추적 전략으로 다음과 같은 장점이 있습니다.
- 이동 평균을 동적 지원/저항으로 사용하여 트렌드를 파악합니다.
- 표준 격차와 Z-Score는 과매매를 판단하고, 가짜 신호를 줄일 수 있습니다.
- 지수 이동 평균을 사용하여 최근 가격에 더 큰 영향을 미치고 더 민감합니다.
- Z-Score는 가격의 편차를 표준화하여 판단 규칙을 보다 일률적으로 규정합니다.
- 손해 제도를 설정하여 적시에 손해를 막고 위험을 통제할 수 있습니다.
위험 분석
이 전략에는 몇 가지 위험도 있습니다.
- 이동 평균은 가격을 판단하는 기준으로, 가격이 눈에 띄게 뛰어넘거나 돌파 할 때 잘못된 신호를 냅니다.
- 표준 격차와 Z-Score 판단 값은 적절하게 설정되어야 하며, 너무 크거나 너무 작으면 전략의 성능에 영향을 미칠 수 있습니다.
- 부적절한 상쇄 설정으로 인해 불필요한 손실이 발생할 수 있습니다.
- 급격한 사건으로 인해 가격의 큰 변동이 발생하고, 트렌드 기회를 놓치게 될 수 있습니다.
해결책:
- 이동 평균 변수를 합리적으로 설정하고 주요 트렌드를 식별합니다.
- 최적화된 표준편차 변수를 재검토하여 최적의값을 찾습니다.
- 트레일링 스톱 손해 검사 정책의 트레일링 스톱 합리성을 설정
- 사건 이후 시장 상황을 재평가하고 전략적 변수를 조정합니다.
최적화 방향
이 전략은 다음과 같은 부분에서 최적화될 수 있습니다.
- 간단한 표준 차이는 아닌 ATR 같은 변동률 지표를 사용하여 위험 식욕을 더 잘 판단할 수 있습니다.
- 다른 종류의 이동 평균을 시도하여 더 적합한 중축 지표를 찾으십시오.
- 이동 평균 매개 변수를 최적화, 최적의 평균 순환을 식별
- Z-Score 값을 최적화하여 최적의 전략 수행 파라미터 지점을 찾습니다.
- 변동률 기반의 손해배상 방식을 추가하여 손해배상 방식을 더 지능적이고 합리적으로 만듭니다.
요약하다
이 전략은 전체적으로 기본 합리적인 트렌드 추적 전략이다. 이동 평균을 사용하여 주요 트렌드 방향을 판단하고, 가격 편차의 표준화된 처리를 통해 시장의 과매매 상황을 명확하게 판단하여 거래 신호를 생성할 수 있다. 합리적인 중지 방법을 설정하는 것은 전략이 수익을 보장하는 동시에 위험을 제어 할 수 있도록 한다. 파라미터를 추가적으로 최적화하고 더 많은 조건 판단을 추가함으로써 전략이 더 안정적이고 신뢰할 수 있으며, 매우 강력한 응용 가치가 있다.
전략 소스 코드
/*backtest
start: 2024-01-20 00:00:00
end: 2024-02-19 00:00:00
period: 4h
basePeriod: 15m
exchanges: [{"eid":"Futures_Binance","currency":"BTC_USDT"}]
*/

//@version=5
strategy("GC Momentum Strategy with Stoploss and Limits", overlay=true)

// Input for the length of the EMA
ema_length = input.int(21, title="EMA Length", minval=1)

// Exponential function parameters
steepness = 2

// Calculate the EMA
ema = ta.ema(close, ema_length)

// Calculate the deviation of the close price from the EMA
deviation = close - ema

// Calculate the standard deviation of the deviation
std_dev = ta.stdev(deviation, ema_length)

// Calculate the Z-score
z_score = deviation / std_dev

// Long entry condition if Z-score crosses +0.5 and is below 3 standard deviations
long_condition = ta.crossover(z_score, 0.5)

// Short entry condition if Z-score crosses -0.5 and is above -3 standard deviations
short_condition = ta.crossunder(z_score, -0.5)

// Exit long position if Z-score converges below 0.5 from top
exit_long_condition = ta.crossunder(z_score, 0.5)

// Exit short position if Z-score converges above -0.5 from below
exit_short_condition = ta.crossover(z_score, -0.5)

// Stop loss condition if Z-score crosses above 3 or below -3
stop_loss_long = ta.crossover(z_score, 3)
stop_loss_short = ta.crossunder(z_score, -3)

// Enter and exit positions based on conditions
if (long_condition)
    strategy.entry("Long", strategy.long)
if (short_condition)
    strategy.entry("Short", strategy.short)
if (exit_long_condition)
    strategy.close("Long")
if (exit_short_condition)
    strategy.close("Short")
if (stop_loss_long)
    strategy.close("Long")
if (stop_loss_short)
    strategy.close("Short")

// Plot the Z-score on the chart
plot(z_score, title="Z-score", color=color.blue, linewidth=2)

// Optional: Plot zero lines for reference
hline(0.5, "Upper Threshold", color=color.red)
hline(-0.5, "Lower Threshold", color=color.green)