개요
이 전략은 수량 거래 플랫폼을 기반으로 한 적응된 격자 거래 전략이다. 이 전략은 자동 또는 수동으로 격자 거래 범위를 설정하여 범위에 동등한 간격으로 매매요소를 배치하여 격자 거래를 구현한다. 가격이 격자 상하계를 돌파하면 전략은 자동으로 격자 범위를 조정한다.
전략 원칙
그리드의 상하위값을 설정한다. 역사적 가격의 최고점과 최저점의 일정 범위 내의 가격을 상하위값으로 자동으로 계산할 수 있고, 고정 상하위값을 수동으로 설정할 수도 있다.
상하위 가격과 격자 수에 따라 각 격자의 가격 간격을 계산한다.
상하계 가격 사이에 같은 간격으로 여러 매매점을 그리드로 배치한다.
시장 가격이 격자의 하위 한계를 넘으면, 최신의 미완화 포지션 주문이 있는 격자의 다음 격자에 구매 주문을 배치한다. 시장 가격이 격자의 상위 한계를 넘으면, 최신의 미완화 포지션 주문이 있는 격자의 상단 격자에 판매 주문을 배치한다.
이렇게 함으로써, 격자 상의 하위 경계 사이에 계속적으로 거래가 이루어진다. 가격 추세가 반전될 때, 이전 주문이 점차적으로 정지하거나 손실된다.
전략적 이점
그레드 거래는 수평선과 변동성 상황에서 수익을 올릴 수 있습니다.
자율 조정 격자 범위, 시장의 변동에 따라 자동으로 조정할 수 있으며, 인적 개입이 필요하지 않습니다.
투입된 금액을 미리 정하여 각 격자별로 분배하여 각 위험을 제어할 수 있다.
간단한 논리, 이해하기 쉬운, 변수 조정 유연함.
위험과 대책
상하계통을 넘어서서 손실을 입는 것
- 해결 방법: 합리적인 스톱피치 설정
동향상태는 반복적인 손실을 초래한다.
- 해결 방법: 트렌드를 파악하고, 거래를 중단하는 방법
잘못된 변수 설정
- 해결 방법: 그리드 수, 가격 간격 파라미터를 조정한다.
최적화 방향
기계 학습을 사용하여 가격 변동 범위와 추세를 예측하고, 격자 파라미터를 동적으로 조정합니다.
트렌드 상황에서는 트렌드 거래로 전환하여 그리드 거래 손실을 피하십시오.
자본 사용률, 수익률 등의 지표와 함께 리스크 통제를 수행한다.
다양한 종족이 퍼져나가고, 자금의 사용이 확대되고 있다.
요약하다
이 전략은 자동으로 조정할 수 있는 매개 변수 자기 적응 격자 전략으로, 흔들리는 가로판의 주식, 디지털 화폐 및 외환 품종에 적용되며, 파라미터 매개 변수의 조정으로, 시장의 다른 상황에 적응할 수 있으며, 실제 가치가 있다.
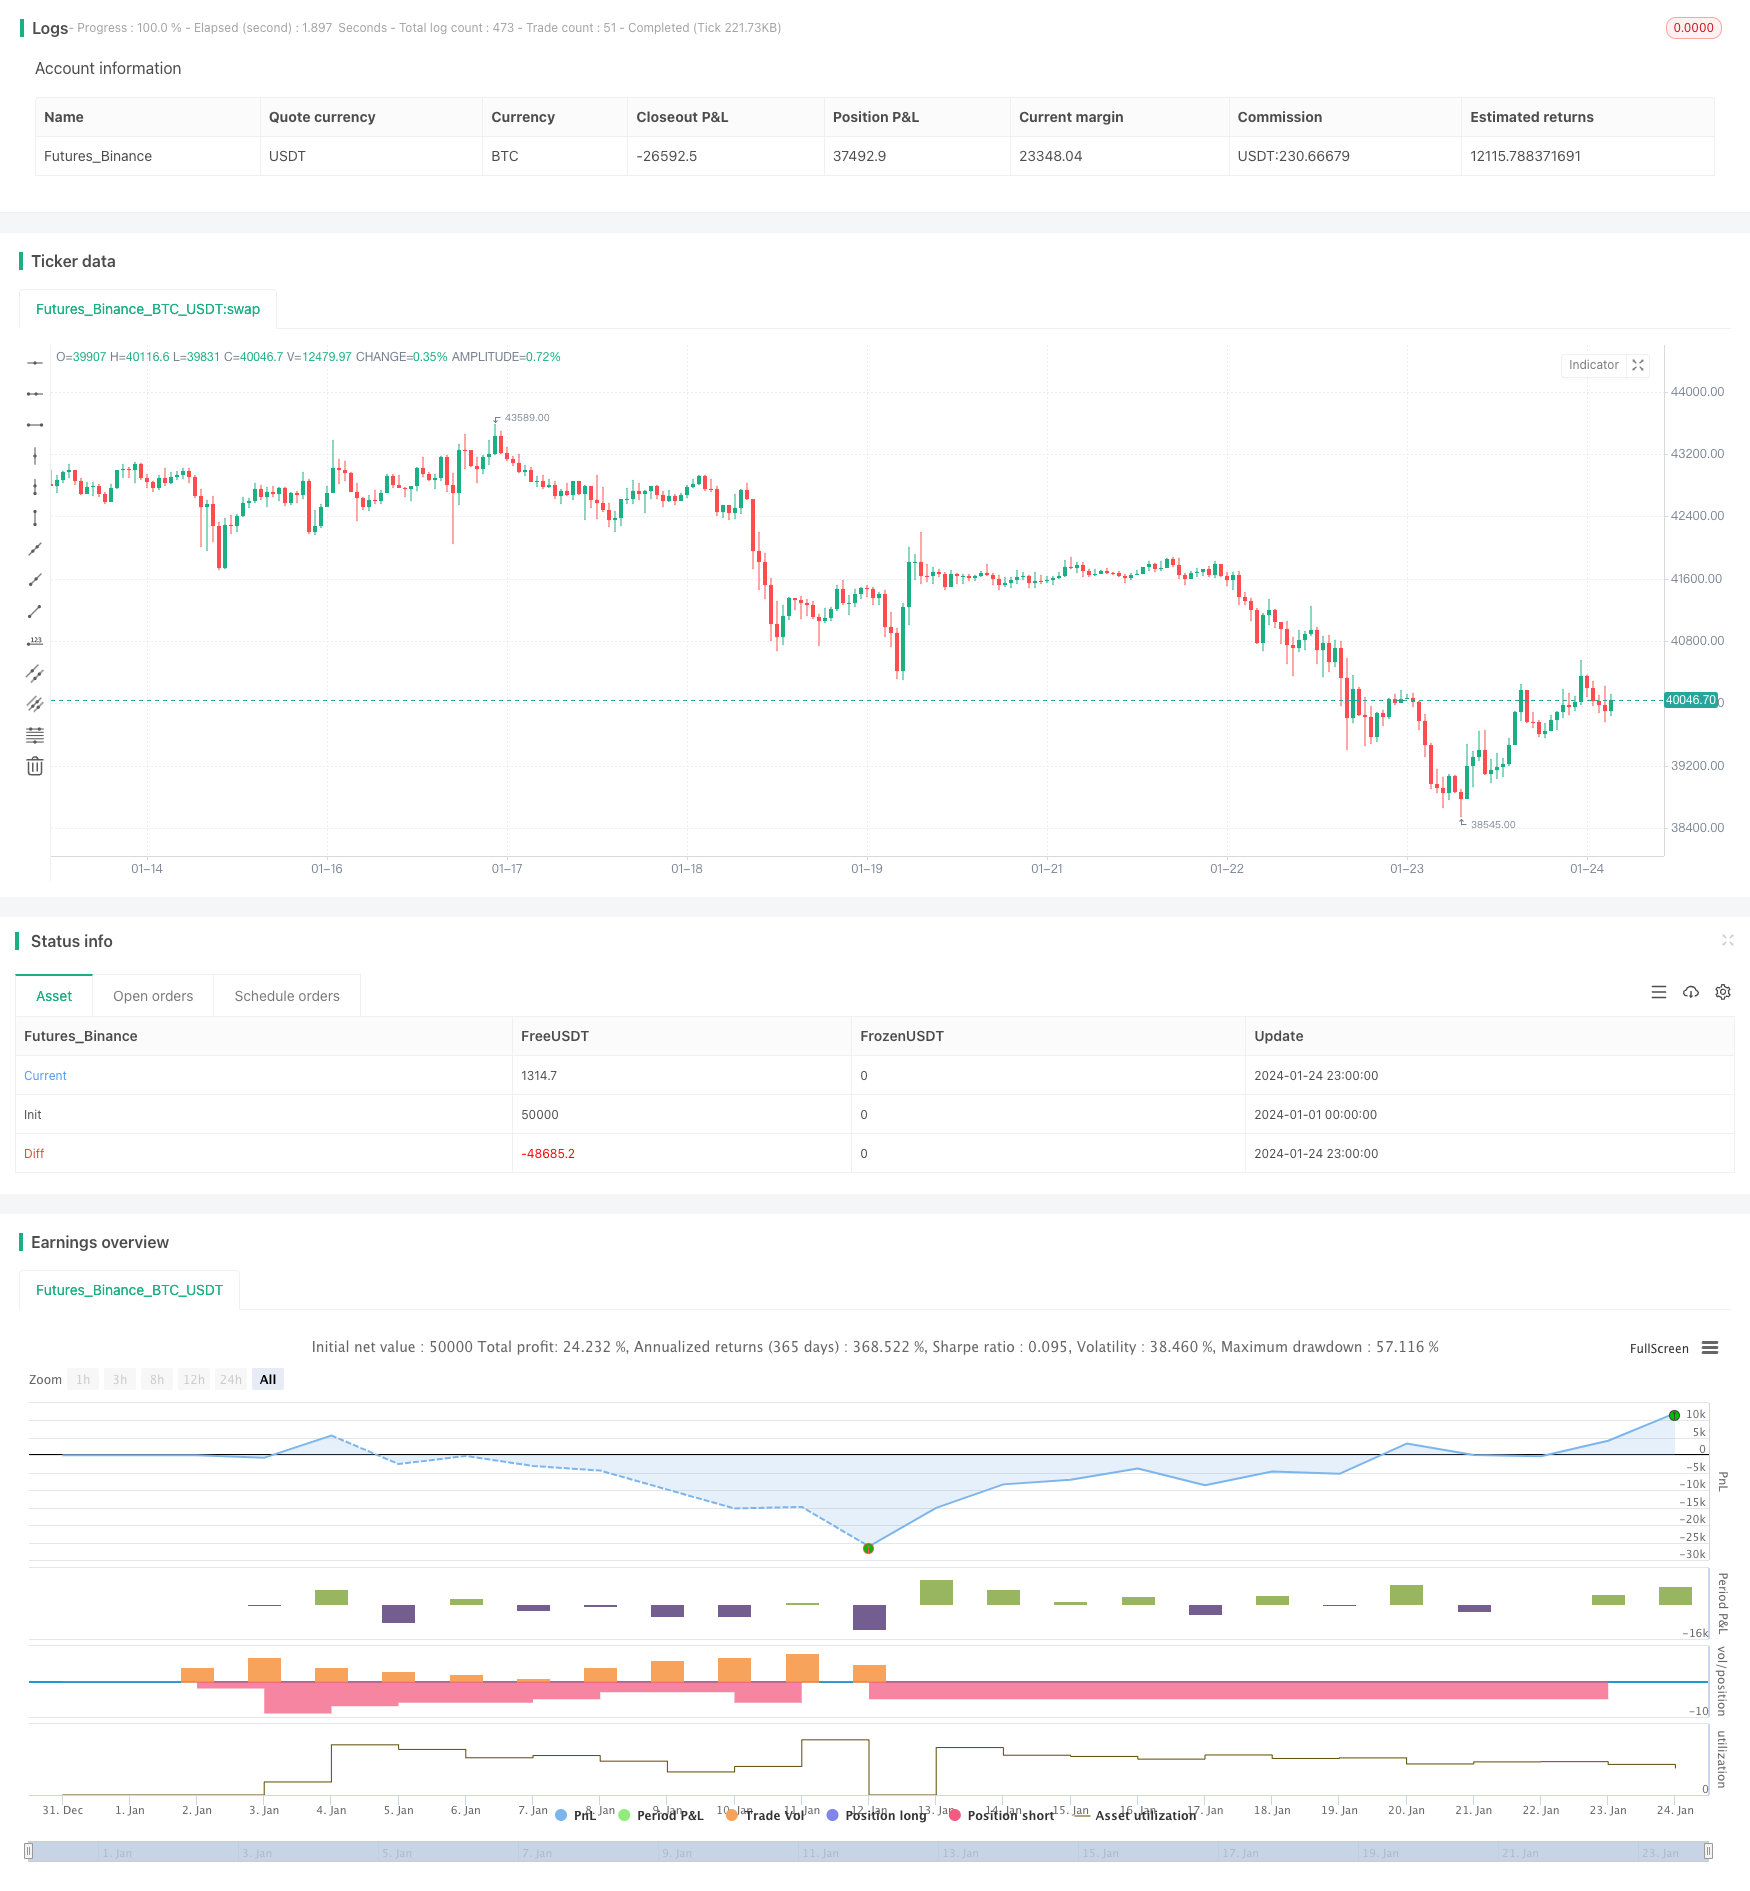
/*backtest
start: 2024-01-01 00:00:00
end: 2024-01-24 23:59:59
period: 1h
basePeriod: 15m
exchanges: [{"eid":"Futures_Binance","currency":"BTC_USDT"}]
*/

//@version=4
//hk4jerry

strategy("Grid Bot Backtesting", overlay=false, pyramiding=3000, close_entries_rule="ANY", default_qty_type=strategy.cash, initial_capital=100.0, currency="USD", commission_type=strategy.commission.percent, commission_value=0.025)
i_autoBounds    = input(group="Grid Bounds", title="Use Auto Bounds?", defval=true, type=input.bool)                             // calculate upper and lower bound of the grid automatically? This will theorhetically be less profitable, but will certainly require less attention
i_boundSrc      = input(group="Grid Bounds", title="(Auto) Bound Source", defval="Hi & Low", options=["Hi & Low", "Average"])     // should bounds of the auto grid be calculated from recent High & Low, or from a Simple Moving Average
i_boundLookback = input(group="Grid Bounds", title="(Auto) Bound Lookback", defval=250, type=input.integer, maxval=500, minval=0) // when calculating auto grid bounds, how far back should we look for a High & Low, or what should the length be of our sma
i_boundDev      = input(group="Grid Bounds", title="(Auto) Bound Deviation", defval=0.10, type=input.float, maxval=1, minval=-1)  // if sourcing auto bounds from High & Low, this percentage will (positive) widen or (negative) narrow the bound limits. If sourcing from Average, this is the deviation (up and down) from the sma, and CANNOT be negative.
i_upperBound    = input(group="Grid Bounds", title="(Manual) Upper Boundry(상단 가격)", defval=0.285, type=input.float)                      // for manual grid bounds only. The upperbound price of your grid
i_lowerBound    = input(group="Grid Bounds", title="(Manual) Lower Boundry(하단 가격)", defval=0.225, type=input.float)                      // for manual grid bounds only. The lowerbound price of your grid.
i_gridQty       = input(group="Grid Lines",  title="Grid Line Quantity(그리드 수)", defval=30, maxval=999, minval=1, type=input.integer)       // how many grid lines are in your grid
initial_balance = input(group="Trading option", title="Initial balance(투자금액)", defval=100, step=0.01)


start_time = input(group="Trading option",defval=timestamp('15 March 2023 06:00'), title='Start Time', type = input.time)
end_time = input(group="Trading option",defval=timestamp('31 Dec 2035 20:00'), title='End Time', type = input.time)
isAfterStartDate = true

tradingtime= (timenow - start_time)/(86400000*30)
yeartime=tradingtime/12


f_getGridBounds(_bs, _bl, _bd, _up) =>
    if _bs == "Hi & Low"
        _up ? highest(close, _bl) * (1 + _bd) : lowest(close, _bl)  * (1 - _bd)
    else
        avg = sma(close, _bl)
        _up ? avg * (1 + _bd) : avg * (1 - _bd)

f_buildGrid(_lb, _gw, _gq) =>
    gridArr = array.new_float(0)
    for i=0 to _gq-1
        array.push(gridArr, _lb+(_gw*i))
    gridArr

f_getNearGridLines(_gridArr, _price) =>
    arr = array.new_int(3)
    for i = 0 to array.size(_gridArr)-1
        if array.get(_gridArr, i) > _price
            array.set(arr, 0, i == array.size(_gridArr)-1 ? i : i+1)
            array.set(arr, 1, i == 0 ? i : i-1)
            break
    arr

var upperBound      = i_autoBounds ? f_getGridBounds(i_boundSrc, i_boundLookback, i_boundDev, true) : i_upperBound  // upperbound of our grid
var lowerBound      = i_autoBounds ? f_getGridBounds(i_boundSrc, i_boundLookback, i_boundDev, false) : i_lowerBound // lowerbound of our grid
var gridWidth       = (upperBound - lowerBound)/(i_gridQty-1)                                                       // space between lines in our grid
var gridLineArr     = f_buildGrid(lowerBound, gridWidth, i_gridQty)                                                 // an array of prices that correspond to our grid lines
var orderArr        = array.new_bool(i_gridQty, false)                                                              // a boolean array that indicates if there is an open order corresponding to each grid line

var closeLineArr    = f_getNearGridLines(gridLineArr, close)                                                        // for plotting purposes - an array of 2 indices that correspond to grid lines near price
var nearTopGridLine = array.get(closeLineArr, 0)                                                                    // for plotting purposes - the index (in our grid line array) of the closest grid line above current price
var nearBotGridLine = array.get(closeLineArr, 1)                                                                    // for plotting purposes - the index (in our grid line array) of the closest grid line below current price
if isAfterStartDate
    for i = 0 to (array.size(gridLineArr) - 1)
        if close < array.get(gridLineArr, i) and not array.get(orderArr, i) and i < (array.size(gridLineArr) - 1)
            buyId = i
            array.set(orderArr, buyId, true)
            strategy.entry(id=tostring(buyId), long=true, qty=(initial_balance/(i_gridQty-1))/close, comment="#"+tostring(buyId))
        if close > array.get(gridLineArr, i) and i != 0
            if array.get(orderArr, i-1)
                sellId = i-1
                array.set(orderArr, sellId, false)
                strategy.close(id=tostring(sellId), comment="#"+tostring(sellId))

    if i_autoBounds
        upperBound  := f_getGridBounds(i_boundSrc, i_boundLookback, i_boundDev, true)
        lowerBound  := f_getGridBounds(i_boundSrc, i_boundLookback, i_boundDev, false)
        gridWidth   := (upperBound - lowerBound)/(i_gridQty-1)
        gridLineArr := f_buildGrid(lowerBound, gridWidth, i_gridQty)

    closeLineArr    := f_getNearGridLines(gridLineArr, close)
    nearTopGridLine := array.get(closeLineArr, 0)
    nearBotGridLine := array.get(closeLineArr, 1)


var table table = table.new(position.top_right,6,8, frame_color = color.rgb(255, 255, 255),frame_width = 2,border_width = 2, border_color=color.rgb(255, 255, 255))


//제목
table.cell(table,0,0,"상단 라인 :", bgcolor=color.new(color.black,0),text_color =color.white)
table.cell(table,0,1,"하단 라인 :",bgcolor=color.new(color.black,0),text_color =color.white)
table.cell(table,0,2,"그리드 수 :",bgcolor=color.new(color.black,0),text_color =color.white)
table.cell(table,0,3,"투자금액 :",text_color =color.white,bgcolor=color.new(color.black,0))
table.cell(table,0,4,"그리드당 투자금액 :",text_color =color.white,bgcolor=color.new(color.black,0))
//수치
table.cell(table,1,0, tostring(upperBound, '###.#####')+ "  USDT", bgcolor=color.new(#5a637e, 0),text_color =color.white)
table.cell(table,1,1, tostring(lowerBound, '###.#####')+ "  USDT", bgcolor=color.new(#5a637e, 0),text_color =color.white)
table.cell(table,1,2, tostring(i_gridQty, '###'), bgcolor=color.new(#5a637e, 0),text_color =color.white)
table.cell(table,1,3, tostring(initial_balance,'###.##')+ "  USDT", bgcolor=color.new(#5a637e, 0),text_color =color.white)
table.cell(table,1,4, tostring(initial_balance/i_gridQty,'###.##')+ "  USDT", bgcolor=color.new(#5a637e, 0),text_color =color.white)

//제목
table.cell(table,2,0,"현재 포지션 :",text_color =color.white,bgcolor=color.new(color.black,0))
table.cell(table,2,1,"현재 포지션 평단가 :",text_color =color.white,bgcolor=color.new(color.black,0))
table.cell(table,2,2,"현재 포지션 수익 :",bgcolor=color.new(color.black,0),text_color =color.white)
table.cell(table,2,3,"현재 포지션 수익 % :",bgcolor=color.new(color.black,0),text_color =color.white)
table.cell(table,2,4,"현재 포지션 수수료 :",text_color =color.white,bgcolor=color.new(color.black,0))

//수치
table.cell(table,3,0, tostring(strategy.position_size) +   syminfo.basecurrency + "\n"  + tostring(strategy.position_size*strategy.position_avg_price/1, '###.##') + "USDT" ,text_color =color.white,bgcolor=color.new(#5a637e, 0))
table.cell(table,3,1, text=strategy.position_size>0 ? tostring(strategy.position_avg_price,'###.####')+ "  USDT" : "NOT TRADING",text_color =color.white,bgcolor=color.new(#5a637e, 0))
table.cell(table,3,2, tostring(strategy.openprofit, '###.##')+ "  USDT",text_color =color.white,bgcolor=strategy.openprofit > 0 ? color.teal : color.maroon)
table.cell(table,3,3, tostring(strategy.openprofit/initial_balance*100, '###.##')+ "%",text_color =color.white,bgcolor=strategy.openprofit > 0 ? color.teal : color.maroon)
table.cell(table,3,4, "-" + tostring(strategy.position_avg_price*strategy.position_size*0.025/100,'###.##')+ "  USDT",text_color =color.white,bgcolor=color.new(#5a637e, 0))

//제목
table.cell(table,4,0,"그리드 수익 :",text_color =color.white,bgcolor=color.new(color.black,0))
table.cell(table,4,1,"그리드 수익률 :",text_color =color.white,bgcolor=color.new(color.black,0))
table.cell(table,4,2,"총 수익 :", bgcolor=color.new(color.black,0),text_color =color.white)
table.cell(table,4,3,"총 수익률 :",bgcolor=color.new(color.black,0),text_color =color.white)
table.cell(table,4,4,"현재 자산 :",bgcolor=color.new(color.black,0),text_color =color.white)


//수치
table.cell(table,5,0, tostring(strategy.netprofit, '###.#####')+ "USDT", text_color =color.white,bgcolor=strategy.netprofit > 0 ? color.teal : color.maroon)
table.cell(table,5,1, tostring((strategy.netprofit)/initial_balance*100/tradingtime, '####.##') + "%",text_color =color.white,bgcolor=strategy.netprofit > 0 ? color.teal : color.maroon)
table.cell(table,5,2, tostring(strategy.netprofit+strategy.openprofit, '###.##') + "  USDT",text_color =color.white,bgcolor=strategy.netprofit+strategy.openprofit > 0 ? color.teal : color.maroon)
table.cell(table,5,3, tostring((strategy.netprofit+strategy.openprofit)/initial_balance*100, '####.##') + "%",text_color =color.white,bgcolor=strategy.netprofit+strategy.openprofit > 0 ? color.teal : color.maroon)
table.cell(table,5,4, tostring(initial_balance+strategy.netprofit+strategy.openprofit, '###.##')+ "  USDT", text_color =color.white,bgcolor=color.new(#3d4d7c, 0))


// plot(strategy.initial_capital+ strategy.netprofit+strategy.openprofit, "총 수익 USDT",color=color.rgb(81, 137, 128))
// plot(initial_balance, "투자금액",color=color.rgb(81, 137, 128))