개요
이중 EMA 크로스오버 전략 (Dual EMA Crossover Strategy) 은 두 개의 서로 다른 주기적 EMA 평균선 크로스오버를 기반으로 포지션 개시 및 포지션을 수행하는 양적 거래 전략이다. 이 전략은 간단하고 효과적이며 이해하기 쉬운 양적 거래의 일반적인 전략이다.
전략 원칙
이 전략은 두 개의 EMA 평균선을 사용한다. 25주기 EMA 선은 빠른 선으로, 50주기 EMA 선은 느린 선으로 사용한다. 빠른 선에서 느린 선을 통과할 때, 더 많이 하고, 빠른 선 아래의 느린 선을 통과할 때, 공백을 한다.
더 많이 한 후, 입시 가격의 2%로 스톱을 설정하고, 입시 가격의 2%로 스톱을 설정하고, 가격이 스톱 또는 스톱에 도달했을 때 포지션을 평정하십시오. 공백을 해보십시오.
이 전략의 핵심은 시장의 추세와 반향을 판단하기 위해 EMA의 빠른 느린 선의 교차를 이용하는 것이다. 상회할 때 황소 시장으로 판단하고 더 많은 것을 하고, 상회할 때 곰 시장으로 판단하고 공백을 한다. 수익을 잠금하고 위험을 제어하기 위해 중지 손실 설정을 한다.
우위 분석
이중 EMA 빠른 느린 라인 교차 전략은 다음과 같은 장점이 있다:
- 이 아이디어는 명확하고, 논리적으로 간단하며, 실행을 이해하기 쉽다.
- 빠른 선과 느린 선의 조합을 사용하면 중간과 짧은 선의 추세를 잡을 수 있습니다.
- 시장의 전환점을 잡을 수 있습니다.
- 리스크가 통제되고, 스티프, 스티프 손실이 합리적입니다.
전체적으로, 이 전략은 명확한 논리를 통해 시장을 판단하고, EMA 자체의 장점을 활용하여, 위험을 통제할 수 있는 전제하에서, 좋은 중단계 수익을 얻습니다.
위험 분석
이 두 개의 EMA는 몇 가지 위험도 가지고 있습니다.
- 시장이 급격히 변동할 때, EMA 라인 크로스 신호는 정확하지 않을 수 있으며, 그 오해의 가능성이 있다.
- 스톱톱 손실 지점을 부합적으로 설정하면 더 큰 시장을 놓칠 수 있고 더 큰 손실을 입을 수 있습니다.
- 거래 비용과 점유율의 영향도 무시할 수 없습니다.
이러한 위험은 다음과 같은 방법으로 최적화 할 수 있습니다.
- 다른 지표와 결합하여 시장을 판단하여 EMA 교차의 잘못된 판단 신호를 피하십시오.
- 이득과 위험 사이의 균형을 찾기 위해 스톱 스톱 손실의 설정을 테스트하고 최적화하십시오.
- 저렴한 수수료의 거래 플랫폼을 선택하고 거래량을 적절히 늘리십시오.
최적화 방향
이 전략은 다음과 같은 주요 최적화 방향을 가지고 있습니다.
- EMA의 주기 변수를 최적화하여 최적의 변수 조합을 찾는다.
- 다른 지표 판단을 추가하여 거래 포트폴리오를 형성하고 정확도를 향상시킵니다.
- 동적으로 조정하는 스톱스톱스피드. 손실이 일정 정도에 도달하면 스톱스피드 추적이 확대되고, 이익이 일정 정도에 도달하면 스톱스피드 이동 등.
- 다단계 시장과 빈단계 시장을 구분하고, 유도 거래를 한다.
이러한 최적화는 수익률과 승률을 높여줄 수 있습니다. 전략이 단순하고 명확하게 유지될 수 있도록 말이죠.
요약하다
쌍 EMA 빠른 느린 선 교차 전략은 전체적으로 매우 실용적인 수량 거래 전략이다. 그것은 이해하기 쉽고 구현, 효과적으로 시장 추세를 파악한다. 또한, 특정 최적화 공간을 가지고 있으며, 매개 변수 조정 및 조합을 통해 수익률을 더욱 높일 수 있다. 이러한 간단한 직접적인 전략 아이디어는 투자자가 배우고 적용할 가치가 있다.
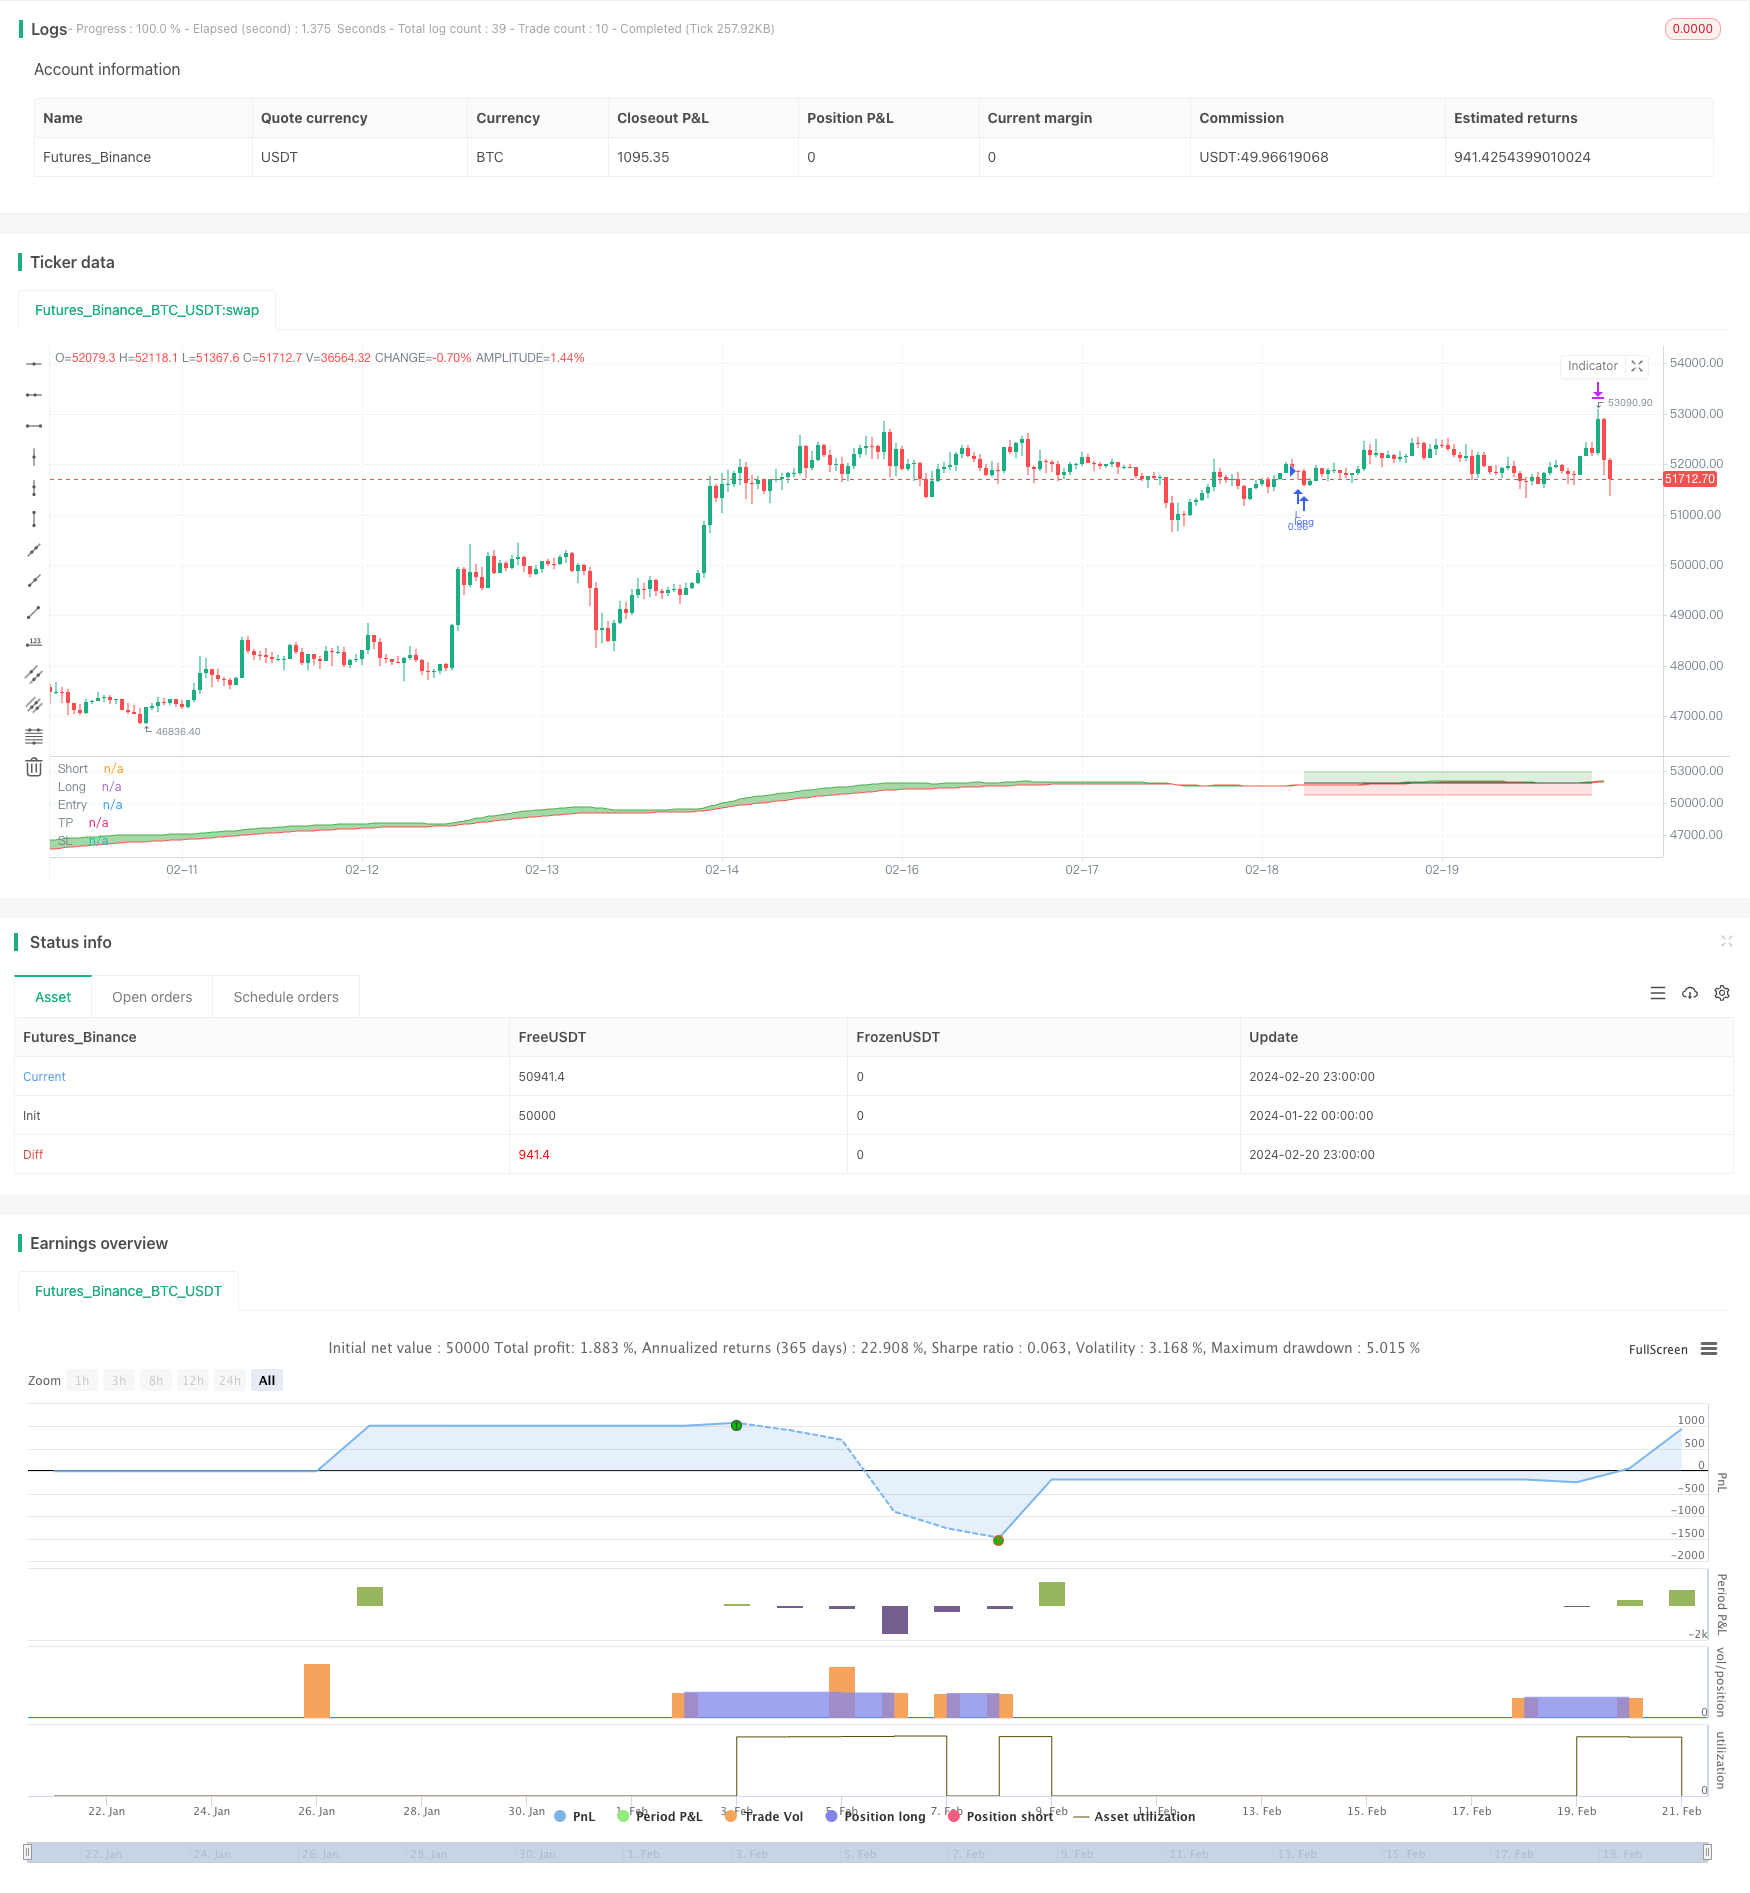
/*backtest
start: 2024-01-22 00:00:00
end: 2024-02-21 00:00:00
period: 1h
basePeriod: 15m
exchanges: [{"eid":"Futures_Binance","currency":"BTC_USDT"}]
*/

// SEMA-X(SEMA CROSS) [AB] : Simple EMA cross strategy Alert & Backtest
// 1. 2 EMA cross
// 2. Next candle entry
// 3. TP & SL

//@version=5
strategy("SEMA-X", "SEMA-X", overlay=false, margin_long=1,
 initial_capital=1000000, default_qty_type=strategy.percent_of_equity, default_qty_value=100,
 commission_type=strategy.commission.percent, commission_value=0.075, slippage=3)

//****************************************************************************//
// Input
//****************************************************************************//
// EMA length
emaLen25 = input.int(25, "Short", minval=1, confirm=true, group="[EMA]----------", inline="1")
emaLen50 = input.int(50, "Long",  minval=1, confirm=true, group="[EMA]----------", inline="1")

// TP & SL
isLong   = input.bool(true, "Long - ",    confirm=true, group="[TP & SL(%)]----------", inline="1")
tpLong   = input.float(2, "TP", minval=0, confirm=true, group="[TP & SL(%)]----------", inline="1")*0.01
slLong   = input.float(2, "SL", minval=0, confirm=true, group="[TP & SL(%)]----------", inline="1")*0.01
isShort  = input.bool(false, "Short - ",  confirm=true, group="[TP & SL(%)]----------", inline="2")
tpShort  = input.float(2, "TP", minval=0, confirm=true, group="[TP & SL(%)]----------", inline="2")*0.01
slShort  = input.float(2, "SL", minval=0, confirm=true, group="[TP & SL(%)]----------", inline="2")*0.01

// Backtest period
sTime = input(timestamp("0001-01-01"), "Start", group="[Backtest]----------")
eTime = input(timestamp("9999-01-01"), "End",   group="[Backtest]----------")
inDateRange   = true
periodBg      = input.bool(false, "Backtest BGcolor", confirm=true, group="[Backtest]----------", inline="1")
bgLong        = input.bool(false, "Position BGcolor", confirm=true, group="[Backtest]----------", inline="1")
periodBgColor = periodBg and inDateRange ? color.new(color.green, 95) : na
bgcolor(periodBgColor, title="Backtest BGcolor")
bgColorLong   = bgLong and strategy.position_size>0 ? color.new(color.green, 95) : na
bgcolor(bgColorLong, title="Position BGcolor")

// IRISBOT
exchange = input.string("binance",  "Exchange", confirm=true, group="[IRISBOT]----------", inline="2", options=["binance", "bybit", "upbit"])
account  = input.string("account1", "Account",  confirm=true, group="[IRISBOT]----------", inline="2")
symbol   = input.string("BTC/USDT", "Symbol",   confirm=true, group="[IRISBOT]----------", inline="3")
strategy = input.string("sema-x",   "Strategy", confirm=true, group="[IRISBOT]----------", inline="3")
token    = input.string("token",    "Token",    confirm=true, group="[IRISBOT]----------", inline="4")
stRatio  = input.float(100.0,       "Ratio(%)", confirm=true, group="[IRISBOT]----------", inline="5", tooltip="하나의 거래소에서 이 전략을 몇 % 비중으로 투자할 것인가?") * 0.01
leverage = input.float(1,           "Leverage", confirm=true, group="[IRISBOT]----------", inline="5")
isPlotMsg = input.bool(false, "View alert msg", confirm=true, group="[IRISBOT]----------", inline="6")

//****************************************************************************//
// Process
//****************************************************************************//
ema25=ta.ema(close, emaLen25)
ema50=ta.ema(close, emaLen50)

// Entry condition
longCondition  = isLong and ta.crossover(ema25, ema50)
shortCondition = isShort and ta.crossunder(ema25, ema50)

// Entry price
var price=0.0
var pricePlot=0.0
if (longCondition or shortCondition) and strategy.position_size == 0
    price:=close
pricePlot:=price
if (strategy.position_size==0)
    pricePlot:=na

// Amount
amount = str.tostring(stRatio*100)

// IRISBOT alert msg (for auto trading, you can change this for autoview, tvextbot, thanksbot, etc webhookbot)
msgLong  = '{"exchange":"'+exchange+'","account":"'+account+'","strategy":"'+strategy+'","symbol":"'+symbol+'","type":"market","side":"buy","amount":"'+amount+'%","leverage":"'+str.tostring(leverage)+'","token":"'+token+'"}'
msgShort = '{"exchange":"'+exchange+'","account":"'+account+'","strategy":"'+strategy+'","symbol":"'+symbol+'","type":"market","side":"sell","amount":"'+amount+'%","leverage":"'+str.tostring(leverage)+'","token":"'+token+'"}'
msgExit  = '{"exchange":"'+exchange+'","account":"'+account+'","strategy":"'+strategy+'","symbol":"'+symbol+'","type":"market","side":"close","token":"'+token+'"}'

// Entry signal
if inDateRange
    strategy.entry("L", strategy.long,  when=longCondition,  comment="L", alert_message=msgLong)
    strategy.entry("S", strategy.short, when=shortCondition, comment="S", alert_message=msgShort)
    strategy.exit("XL", "L", profit=price*tpLong/syminfo.mintick,  loss=price*slLong/syminfo.mintick,  comment="X", alert_message=msgExit)
    strategy.exit("XS", "S", profit=price*tpShort/syminfo.mintick, loss=price*slShort/syminfo.mintick, comment="X", alert_message=msgExit)

//****************************************************************************//
// Plot
//****************************************************************************//
// Alert msg plot
var msgTable = table.new(position = position.bottom_right, columns = 2, rows = 3, bgcolor = color.new(color.blue, 80), border_width = 1)
if isPlotMsg
    if isLong
        table.cell(msgTable, 0, 0, "Long",  text_halign = text.align_left)
        table.cell(msgTable, 1, 0, msgLong,  text_halign = text.align_left)

    if isShort
        table.cell(msgTable, 0, 1, "Short", text_halign = text.align_left, bgcolor=color.new(color.red, 80))
        table.cell(msgTable, 1, 1, msgShort, text_halign = text.align_left, bgcolor=color.new(color.red, 80))

    if isLong or isShort
        table.cell(msgTable, 0, 2, "Exit",  text_halign = text.align_left, bgcolor=color.new(color.purple, 80))
        table.cell(msgTable, 1, 2, msgExit,  text_halign = text.align_left, bgcolor=color.new(color.purple, 80))

// EMA
e0=plot(ema25, "Short", color.green)
e1=plot(ema50, "Long", color.red)
fill(e0, e1, ema25>ema50 ? color.new(color.green, 50) : color.new(color.red, 50), "EMA BG")

// TP & SL
p0=plot(pricePlot, "Entry", color.black, style=plot.style_linebr)
p1=plot(pricePlot*(strategy.position_size>0 ? 1+tpLong : 1-tpShort), "TP", color.new(color.green, 50), style=plot.style_linebr)
p2=plot(pricePlot*(strategy.position_size>0 ? 1-slLong : 1+slShort), "SL", color.new(color.red, 50), style=plot.style_linebr)
fill(p0, p1, color.new(color.green, 80), "TP BG")
fill(p0, p2, color.new(color.red, 80), "SL BG")