개요
플래그 브레이크 전략은 기술 분석 전략으로, 플래그 그래프를 식별하고 브레이크 포인트에 진입하여 트렌드의 시작을 포착하는 것을 목표로 한다. 이 전략은 평균 실제 변동 범위 ((ATR) 지표 보조 판단을 사용하여, 명확한 플래그 막대 이후 플래그 범위를 판단하여 진입 기회를 가한다.
전략 원칙
이 전략은 다음과 같은 몇 가지 단계로 구성됩니다.
- 가격 혁신과 ATR 통로를 돌파하는 것을 충족시켜야 한다.
- 깃발 높이를 결정한다: 깃발의 꼭대기와 이전 SMA의 거리를 측정한다.
- 깃발의 범위를 결정한다: 깃발의 최저점은 깃발대 높이의 33%로 깃발의 최소 범위를 한다.
- 플래그 타입을 결정한다: 첫 3개의 K선이 모두 플래그 범위 안에 있는지 판단한다.
- 입구: 깃발 모양이 보이면 더 많이 니다.
- 출장: 고정 보유 6개 K선 이후 청산
깃발과 깃발을 판단할 때, 전략은 ATR 지표를 사용하여 명백한 돌파구를 판단하고, 깃발 높이를 깃발 높이의 33% 이내에 엄격하게 제한하여 과도한 가짜 신호를 피합니다. 또한, 연속으로 3개의 K 라인이 깃발을 구성한다고 판단하면 신뢰성이 높습니다.
우위 분석
이 전략은 다음과 같은 장점을 가지고 있습니다.
- 플래그 구조를 사용하여 트렌드를 결정하는 것은 기술 분석의 고전적인 방법이며 성공률이 높습니다.
- ATR 지표와 엄격한 범위 제한은 많은 가짜 신호를 방지하고 진입 정확도를 향상시킵니다.
- 고정 6 K 라인 출전은 수익의 일부를 잠금할 수 있으며, 트렌드 반전의 위험을 피할 수 있다.
- 전략 규칙은 명확하고 실행하기 쉽고, 쉽게 이해하고 따라야 합니다.
- 다양한 상황에서 기회를 찾을 수 있고, 더 유연하다.
위험 분석
이 전략의 주요 위험은 다음과 같습니다.
- 하지만, 이 모든 것은, 그 어떤 경향을 완전히 판단하지 못하는, 그리고 실패하는 경우도 있습니다.
- 6K 라인 출전은 너무 무분별해서 조기 퇴장할 수도 있다.
- “이런 일이 일어나면 가짜 깃발이 생길 수 있다”.
- 단편적 손실을 효과적으로 통제할 수 없습니다.
위와 같은 위험을 대비하여, 우리는 손실을 막는 전략을 설정하거나, 수익이 일정 비율에 도달했을 때 적시에 수익을 창출하는 출전 메커니즘을 최적화 할 수 있습니다. 또한, 우리는 다른 지표와 함께 필터링을 수행하여 가격이 너무 흔들릴 때 잘못된 신호를 방지 할 수 있습니다.
최적화 방향
이 전략은 다음과 같은 방향으로 최적화될 수 있습니다.
- MACD, KD 등의 지표 조합을 이용하여, 진동상태에서 가짜 신호를 피한다.
- 시장의 종류에 따라 ATR 배수, 출전 주기 등을 매개 변수로 하여 전략을 더 적응시킬 수 있다.
- 이동 스톱로스를 설정하거나 수익 철수를 고려하여 동적으로 출전하십시오.
- 더 정확한 특징을 찾기 위해 기계 학습 방법을 시도해 보겠습니다.
- 실제 승률과 적당률을 평가하고, 동적으로 포지션 규모를 조정한다.
요약하다
전반적으로, 플래그형 돌파구 전략은 기술 형태 판단 경향을 활용하여 시작하며, 진입 규칙 설계에서 엄격한 전략으로, 많은 가짜 신호를 필터링 할 수 있습니다. 그러나 위험 제어 및 출전 메커니즘은 여전히 최적화 할 수있는 공간이 있습니다. 우리는 전체적인 관점에서 고려하여 전략이 다른 시장에서 안정적으로 작동 할 수 있습니다. 충분히 검증되고 최적화되면 전략은 양적 거래 시스템의 가치있는 구성 요소가 될 수 있습니다.
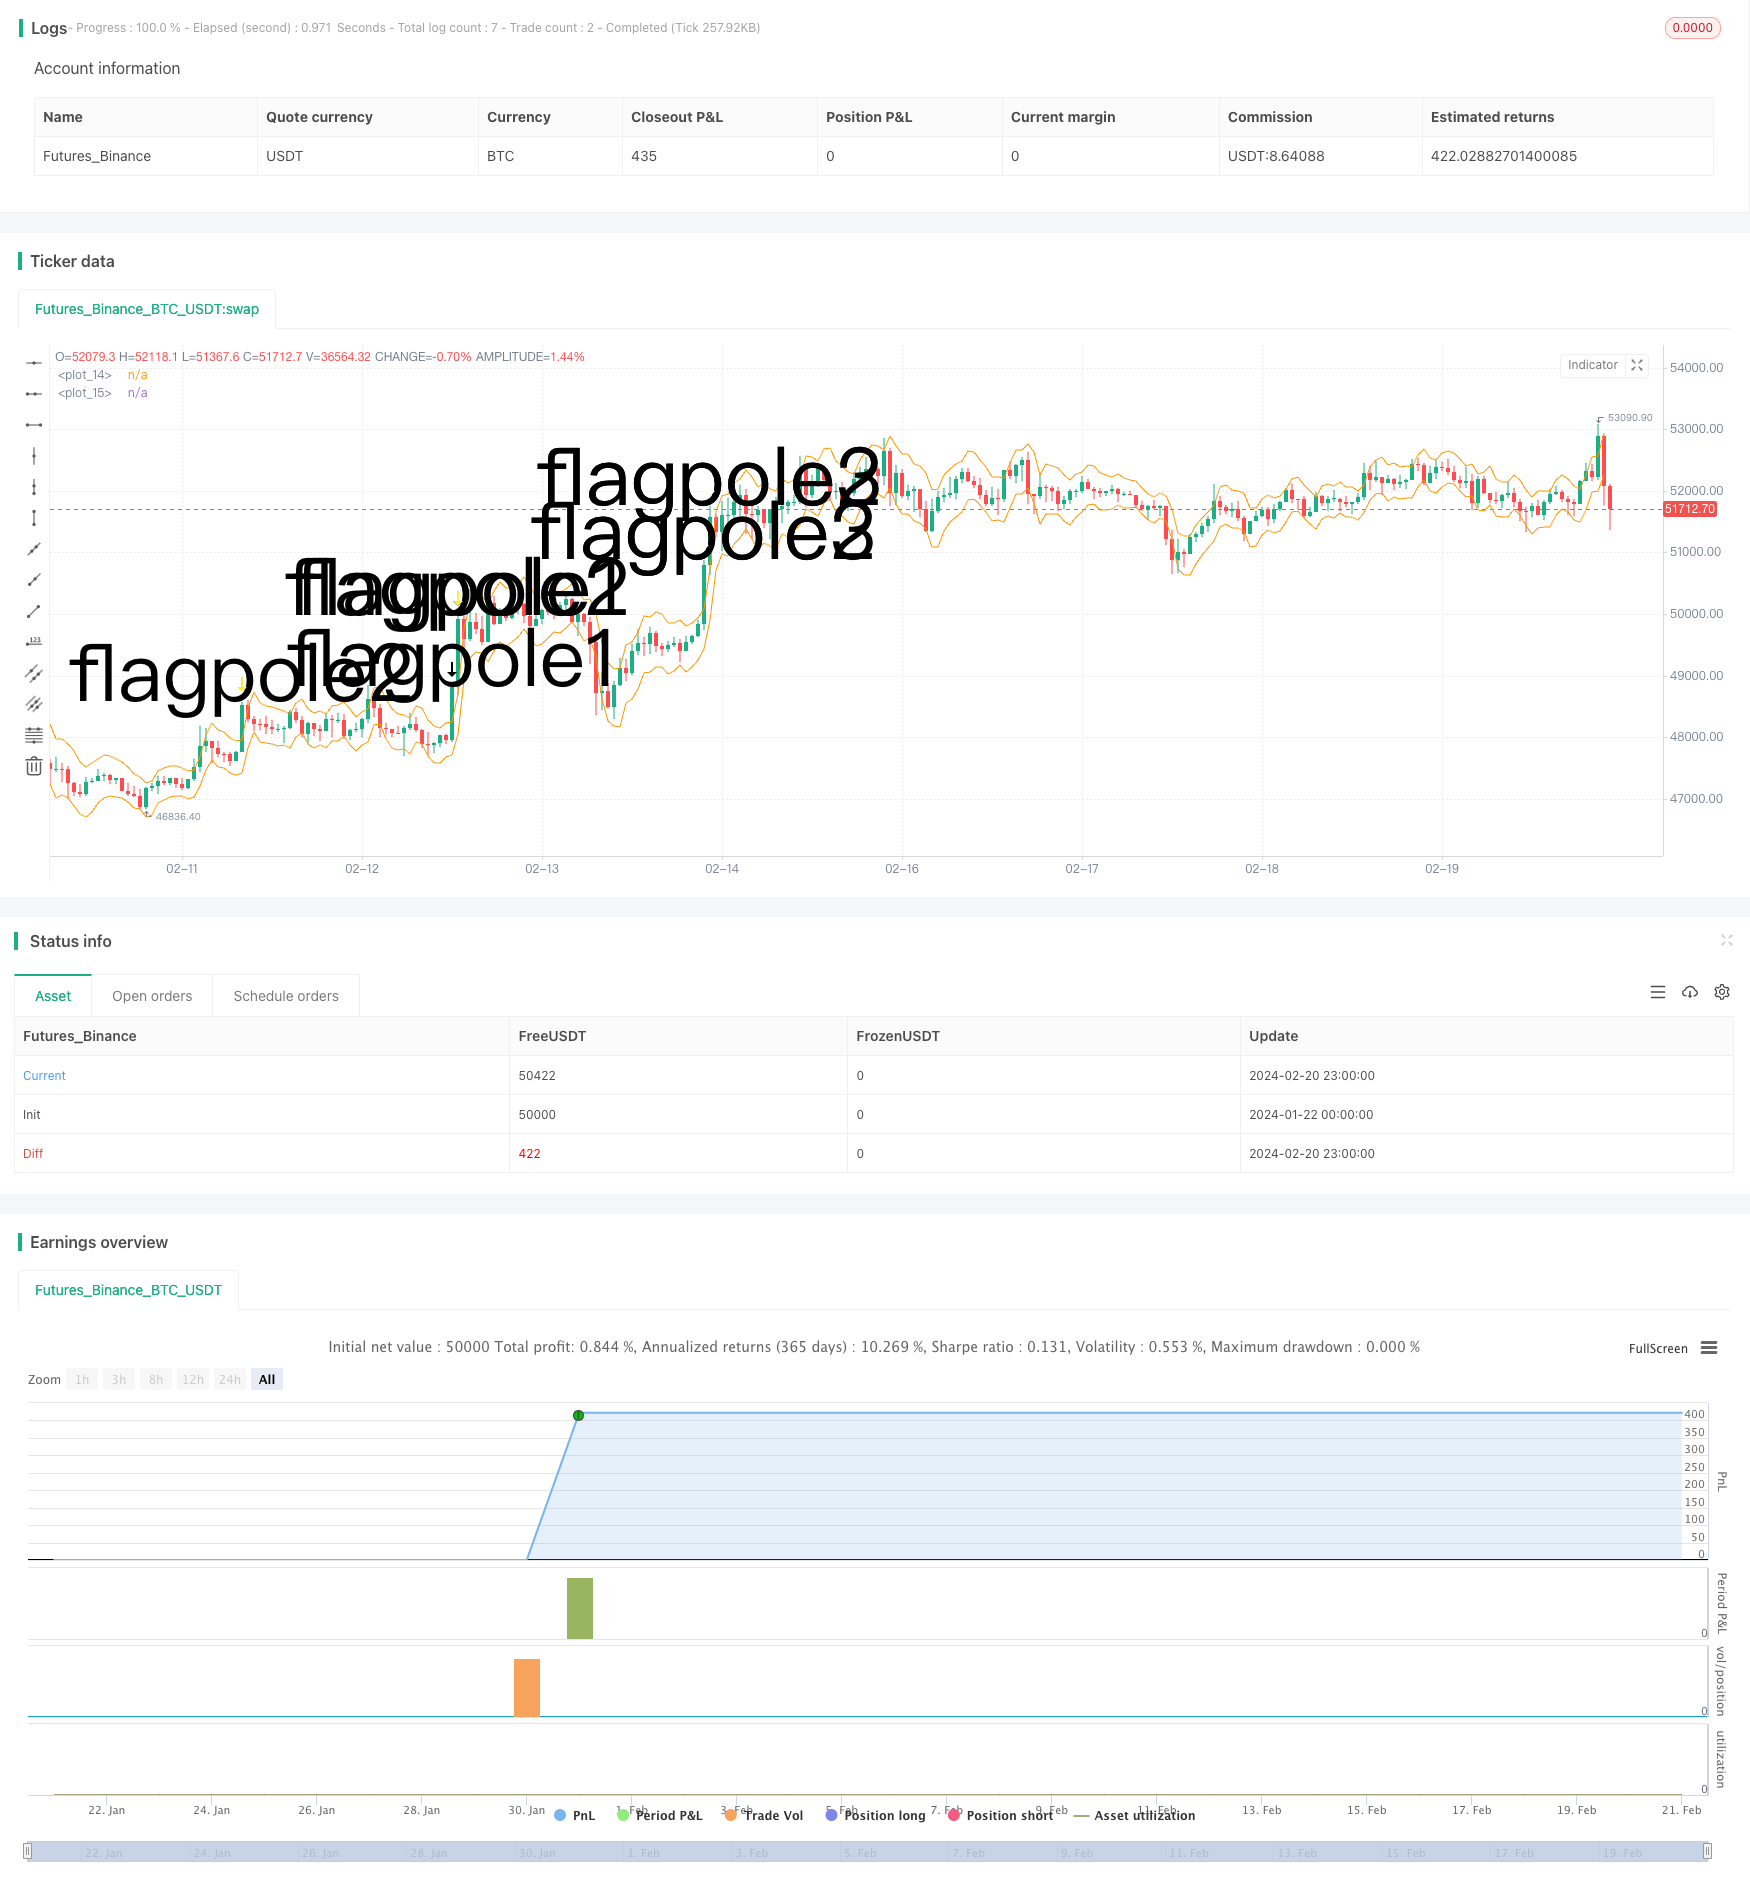
/*backtest
start: 2024-01-22 00:00:00
end: 2024-02-21 00:00:00
period: 1h
basePeriod: 15m
exchanges: [{"eid":"Futures_Binance","currency":"BTC_USDT"}]
*/

// © smith26
//This strategy enters on a bull flag and closes position 6 bars later.  Average true range is used instead of a moving average.
//The reason for ATR instead of MA is because with volatile securities, the flagpole must stand up a noticable "distance" above the trading range---which you can't determine with a MA alone.
//This is broken up into multiple parts: Defining a flagpole, defining the pole height, and defining the flag, which will be constrained to the top third (33%) of the pole height to be considered a flag.
//@version=4
strategy("Bull Flag v1.00", overlay=true)

ATR = atr(10) //Average True Range over last 10 bars.

upperATR = ohlc4[1] + ATR[1]  //Open + High + Low + Close divided by 4, + prior ATR.  Just used here for visually plotting the ATR upper channel.
lowerATR = ohlc4[1] - ATR[1] //Open + High + Low + Close divided by 4, - prior ATR.  Just used here for visually plotting the ATR lower channel.

//uncomment these two lines to see ATR channels
plot(upperATR, color=color.orange)
plot (lowerATR, color=color.orange)

//Current close higher than previous close, and current close minus current open is greater than 3 times the previous ATR.  "3x ATR" is chosen because any less was not a noticeable distance above the trading range.
flagpole1 = close>close[1] and (close-open) > (ATR[1] * 3)
plotshape(flagpole1, text="flagpole1", style=shape.arrowdown, size=size.huge) //Plots an arrow for flagpole1 for QA testing

//Two consecutive close higer than their previous close, and current close minus PREVIOUS open is greater than 3 times the previous ATR.
flagpole2 = close>close[1] and close[1]>close[2] and (close-open[1]) > (ATR[1] * 3)
plotshape(flagpole2, text="flagpole2", style=shape.arrowdown, size=size.huge, color=color.yellow) //Plots an arrow for flagpole2 for QA testing

//Three consecutive close higer than their previous close, and current close minus open from 2 bars ago is greater than 3 times the previous ATR.
flagpole3 = close>close[1] and close[1]>close[2] and close[2]>close[3] and (close-open[2]) > (ATR[1] * 3)
plotshape(flagpole3, text="flagpole3", style=shape.arrowdown, size=size.huge, color=color.white) //Plots an arrow for flagpole3 for QA testing

//A flagpole can be any of the three definitions of flagpole.
flagpole = flagpole1 or flagpole2 or flagpole3

//This will return the number of bars since "flagpole" was true.  Not being used, but could be useful.
//since_flagpole = barssince(flagpole)

after_pole_1 = flagpole[1] //This marks the bar directly after a flagpole.
//plotshape(after_pole_1, text="after_pole_1", style=shape.cross, size=size.large, color=color.white) //Plots a cross for after_pole_1 for QA testing
after_pole_2 = flagpole[2] //This marks the bar two bars after a flagpole.
after_pole_3 = flagpole[3] //This marks the bar three bars after a flagpole.

//This returns the price at the "top" of the flagpole (using close price) at the most recent occurence, 0.
pole_top = valuewhen(flagpole, close, 0)
//plot(pole_top, trackprice=true)  //plots a horizontal line at the most recent pole_top

//Measures the distance between last pole top and the previous SMA.
pole_height = pole_top - sma(close, 10)[1]
//plot(pole_height)

//This marks 33% below the pole_top, which will be the lowest point a flag can be.
flag_bottom = pole_top - (.33 * pole_height)
//plot(flag_bottom)

//The first, second, and third bars after the pole are considered part of a flag when open and close are between the pole_top and flag_bottom
flag1 = after_pole_1 and (open >= flag_bottom) and (open <= pole_top) and (close >= flag_bottom) and (close <= pole_top)
//plotshape(flag1, text="flag1", style=shape.flag, size=size.large, color=color.teal)
flag2 = after_pole_2 and (open >= flag_bottom) and (open <= pole_top) and (close >= flag_bottom) and (close <= pole_top)
//plotshape(flag2, text="flag2", style=shape.flag, size=size.large, color=color.teal)
flag3 = after_pole_3 and (open >= flag_bottom) and (open <= pole_top) and (close >= flag_bottom) and (close <= pole_top)
//plotshape(flag3, text="flag3", style=shape.flag, size=size.large, color=color.teal)

//When all three bars after a flagpole are a flag, the criteria are met and we have a "bull_flag"
//Specifically, when current bar is flag3, previous bar is flag2, and 2 bars ago is flag1, we have a bull_flag.
bull_flag = flag3 and flag2[1] and flag1[2]
plotshape(bull_flag, text="bull_flag", style=shape.flag, size=size.large, color=color.white) //Plots a flag for bull_flag for QA testing


if (bull_flag)
    strategy.entry("Long", strategy.long)

if barssince(bull_flag) == 6 //close 6 bars after entry.
    strategy.close("Long")