
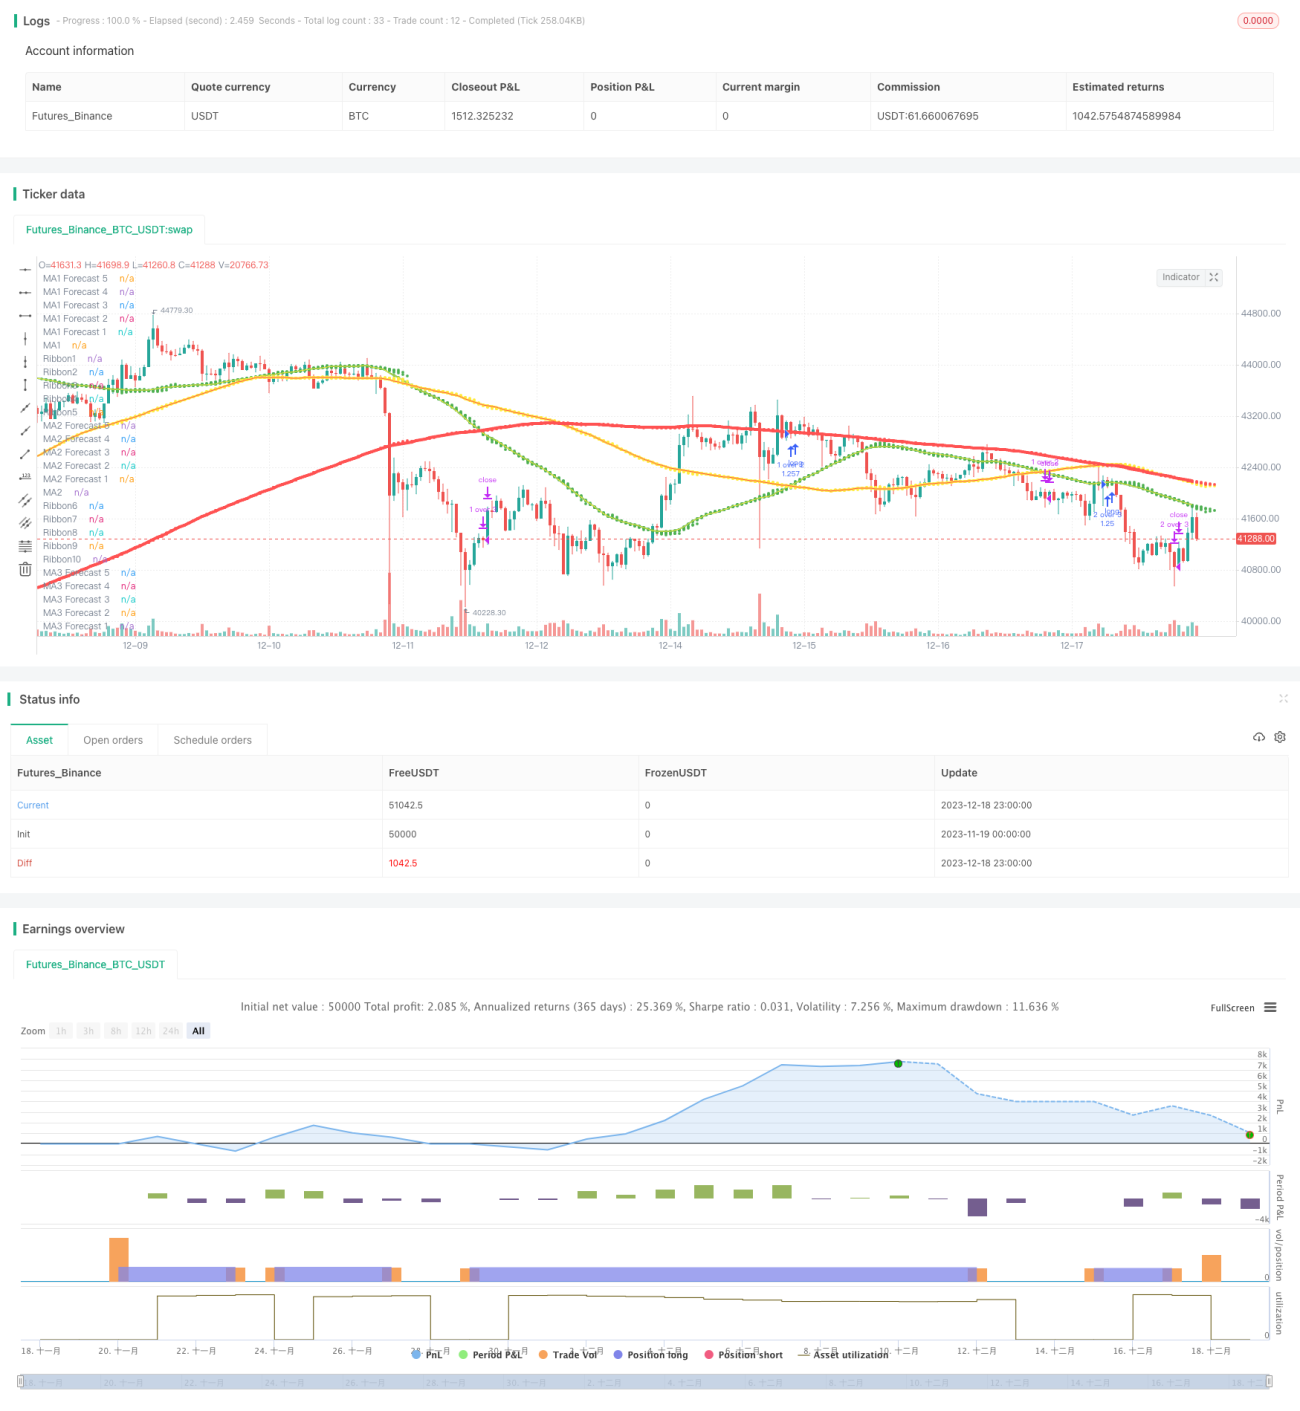
Strategi ini adalah strategi perdagangan yang berdasarkan pada tiga purata bergerak ((MA1, MA2, MA3)). Dengan menetapkan jenis, kitaran, sumber data dan resolusi harga tiga purata bergerak, dan sama ada perdagangan di antara mereka dibenarkan, anda boleh mendapatkan kombinasi strategi perdagangan yang fleksibel.
Strategi ini terutamanya menggunakan isyarat persilangan dan penulisan yang dihasilkan antara tiga purata bergerak sebagai isyarat perdagangan. Isyarat terbuka kedudukan yang panjang dihasilkan apabila purata bergerak yang lebih pendek berputar dari bawah ke atas melalui purata bergerak yang lebih panjang berputar; dan isyarat terbuka kedudukan apabila purata bergerak yang lebih pendek berputar dari atas ke bawah melalui purata bergerak yang lebih panjang berputar.
Pengguna bebas memilih tiga jenis purata bergerak (SMA, EMA, dan lain-lain), tempoh, sumber data harga (harga penutupan, harga tertinggi, dan lain-lain), dan resolusi K-garis (garis minit, garis hari, dan lain-lain). Pengguna juga boleh memilih untuk membuka atau tidak perdagangan yang bersilang di antara setiap purata bergerak untuk menentukan sama ada tindakan perdagangan akan diambil terhadap beberapa persilangan.
Strategi ini buat masa ini hanya melakukan lebih banyak, menggunakan harga pasaran untuk membuka dan melunaskan kedudukan. Setiap perdagangan yang dimasukkan ke dalam dana adalah 100% daripada keuntungan keseluruhan akaun.
Strategi ini menggabungkan ciri-ciri licin rata-rata bergerak dan kebolehan untuk mengenali corak tanda-tanda silang. Pengguna boleh memilih parameter dengan fleksibel, mengimbangi antara trend mengikuti dan mengiktiraf pembalikan.
/*backtest
start: 2023-11-19 00:00:00
end: 2023-12-19 00:00:00
period: 1h
basePeriod: 15m
exchanges: [{"eid":"Futures_Binance","currency":"BTC_USDT"}]
*/
//@version=4
//
// Pine Script v4
// @author BigBitsIO
// Script Library: https://www.tradingview.com/u/BigBitsIO/#published-scripts
//
// study(title, shorttitle, overlay, format, precision)
// https://www.tradingview.com/pine-script-reference/#fun_strategy
strategy(shorttitle = "TManyMA Strategy - ST9 - Long Market Only", title="Triple Many Moving Averages", overlay=true, pyramiding=1, default_qty_type=strategy.percent_of_equity, default_qty_value=100)
// MA#Period is a variable used to store the indicator lookback period. In this case, from the input.
// input - https://www.tradingview.com/pine-script-docs/en/v4/annotations/Script_inputs.html
MA1Period = input(50, title="MA1 Period", minval=1, step=1)
MA1Type = input(title="MA1 Type", defval="SMA", options=["RMA", "SMA", "EMA", "WMA", "HMA", "DEMA", "TEMA", "VWMA"])
MA1Source = input(title="MA1 Source", type=input.source, defval=close)
MA1Resolution = input(title="MA1 Resolution", defval="00 Current", options=["00 Current", "01 1m", "02 3m", "03 5m", "04 15m", "05 30m", "06 45m", "07 1h", "08 2h", "09 3h", "10 4h", "11 1D", "12 1W", "13 1M"])
MA1Visible = input(title="MA1 Visible", type=input.bool, defval=true) // Will automatically hide crossBovers containing this MA
MA2Period = input(100, title="MA2 Period", minval=1, step=1)
MA2Type = input(title="MA2 Type", defval="SMA", options=["RMA", "SMA", "EMA", "WMA", "HMA", "DEMA", "TEMA", "VWMA"])
MA2Source = input(title="MA2 Source", type=input.source, defval=close)
MA2Resolution = input(title="MA2 Resolution", defval="00 Current", options=["00 Current", "01 1m", "02 3m", "03 5m", "04 15m", "05 30m", "06 45m", "07 1h", "08 2h", "09 3h", "10 4h", "11 1D", "12 1W", "13 1M"])
MA2Visible = input(title="MA2 Visible", type=input.bool, defval=true) // Will automatically hide crossovers containing this MA
MA3Period = input(200, title="MA3 Period", minval=1, step=1)
MA3Type = input(title="MA3 Type", defval="SMA", options=["RMA", "SMA", "EMA", "WMA", "HMA", "DEMA", "TEMA", "VWMA"])
MA3Source = input(title="MA3 Source", type=input.source, defval=close)
MA3Resolution = input(title="MA3 Resolution", defval="00 Current", options=["00 Current", "01 1m", "02 3m", "03 5m", "04 15m", "05 30m", "06 45m", "07 1h", "08 2h", "09 3h", "10 4h", "11 1D", "12 1W", "13 1M"])
MA3Visible = input(title="MA3 Visible", type=input.bool, defval=true) // Will automatically hide crossovers containing this MA
ShowCrosses = input(title="Show Crosses", type=input.bool, defval=false)
ForecastBias = input(title="Forecast Bias", defval="Neutral", options=["Neutral", "Bullish", "Bearish"])
ForecastBiasPeriod = input(14, title="Forecast Bias Period")
ForecastBiasMagnitude = input(1, title="Forecast Bias Magnitude", minval=0.25, maxval=20, step=0.25)
ShowForecasts = input(title="Show Forecasts", type=input.bool, defval=true)
ShowRibbons = input(title="Show Ribbons", type=input.bool, defval=true)
TradeMA12Crosses = input(title="Trade MA 1-2 Crosses", type=input.bool, defval=true)
TradeMA13Crosses = input(title="Trade MA 1-3 Crosses", type=input.bool, defval=true)
TradeMA23Crosses = input(title="Trade MA 2-3 Crosses", type=input.bool, defval=true)
// MA# is a variable used to store the actual moving average value.
// if statements - https://www.tradingview.com/pine-script-reference/#op_if
// MA functions - https://www.tradingview.com/pine-script-reference/ (must search for appropriate MA)
// custom functions in pine - https://www.tradingview.com/wiki/Declaring_Functions
ma(MAType, MASource, MAPeriod) =>
if MAType == "SMA"
ta.sma(MASource, MAPeriod)
else
if MAType == "EMA"
ta.ema(MASource, MAPeriod)
else
if MAType == "WMA"
ta.wma(MASource, MAPeriod)
else
if MAType == "RMA"
ta.rma(MASource, MAPeriod)
else
if MAType == "HMA"
ta.wma(2*wma(MASource, MAPeriod/2)-ta.wma(MASource, MAPeriod), round(sqrt(MAPeriod)))
else
if MAType == "DEMA"
e = ta.ema(MASource, MAPeriod)
2 * e - ta.ema(e, MAPeriod)
else
if MAType == "TEMA"
e = ta.ema(MASource, MAPeriod)
3 * (e - ta.ema(e, MAPeriod)) + ta.ema(ema(e, MAPeriod), MAPeriod)
else
if MAType == "VWMA"
ta.vwma(MASource, MAPeriod)
res(MAResolution) =>
if MAResolution == "00 Current"
timeframe.period
else
if MAResolution == "01 1m"
"1"
else
if MAResolution == "02 3m"
"3"
else
if MAResolution == "03 5m"
"5"
else
if MAResolution == "04 15m"
"15"
else
if MAResolution == "05 30m"
"30"
else
if MAResolution == "06 45m"
"45"
else
if MAResolution == "07 1h"
"60"
else
if MAResolution == "08 2h"
"120"
else
if MAResolution == "09 3h"
"180"
else
if MAResolution == "10 4h"
"240"
else
if MAResolution == "11 1D"
"1D"
else
if MAResolution == "12 1W"
"1W"
else
if MAResolution == "13 1M"
"1M"
// https://www.tradingview.com/pine-script-reference/#fun_request.security
MA1 = request.security(syminfo.tickerid, res(MA1Resolution), ma(MA1Type, MA1Source, MA1Period))
MA2 = request.security(syminfo.tickerid, res(MA2Resolution), ma(MA2Type, MA2Source, MA2Period))
MA3 = request.security(syminfo.tickerid, res(MA3Resolution), ma(MA3Type, MA3Source, MA3Period))
// Plotting crossover/unders for all combinations of crosses
// Crossovers no longer detected in label code, they need to be re-used for strategy - crosses and visibility must be set
MA12Crossover = MA1Visible and MA2Visible and ta.crossover(MA1, MA2)
MA12Crossunder = MA1Visible and MA2Visible and ta.crossunder(MA1, MA2)
MA13Crossover = MA1Visible and MA3Visible and ta.crossover(MA1, MA3)
MA13Crossunder = MA1Visible and MA3Visible and ta.crossunder(MA1, MA3)
MA23Crossover = MA2Visible and MA3Visible and ta.crossover(MA2, MA3)
MA23Crossunder = MA2Visible and MA3Visible and ta.crossunder(MA2, MA3)
// https://www.tradingview.com/pine-script-reference/v4/#fun_label%7Bdot%7Dnew
if ShowCrosses and MA12Crossunder
lun1 = label.new(bar_index, na, tostring(MA1Period)+' '+MA1Type+' crossed under '+tostring(MA2Period)+' '+MA2Type,
color=color.red,
textcolor=color.red,
style=label.style_xcross, size=size.small)
label.set_y(lun1, MA1)
if ShowCrosses and MA12Crossover
lup1 = label.new(bar_index, na, tostring(MA1Period)+' '+MA1Type+' crossed over '+tostring(MA2Period)+' '+MA2Type,
color=color.green,
textcolor=color.green,
style=label.style_xcross, size=size.small)
label.set_y(lup1, MA1)
if ShowCrosses and MA13Crossunder
lun2 = label.new(bar_index, na, tostring(MA1Period)+' '+MA1Type+' crossed under '+tostring(MA3Period)+' '+MA3Type,
color=color.red,
textcolor=color.red,
style=label.style_xcross, size=size.small)
label.set_y(lun2, MA1)
if ShowCrosses and MA13Crossover
lup2 = label.new(bar_index, na, tostring(MA1Period)+' '+MA1Type+' crossed over '+tostring(MA3Period)+' '+MA3Type,
color=color.green,
textcolor=color.green,
style=label.style_xcross, size=size.small)
label.set_y(lup2, MA1)
if ShowCrosses and MA23Crossunder
lun3 = label.new(bar_index, na, tostring(MA2Period)+' '+MA2Type+' crossed under '+tostring(MA3Period)+' '+MA3Type,
color=color.red,
textcolor=color.red,
style=label.style_xcross, size=size.small)
label.set_y(lun3, MA2)
if ShowCrosses and MA23Crossover
lup3 = label.new(bar_index, na, tostring(MA2Period)+' '+MA2Type+' crossed over '+tostring(MA3Period)+' '+MA3Type,
color=color.green,
textcolor=color.green,
style=label.style_xcross, size=size.small)
label.set_y(lup3, MA2)
// plot - This will draw the information on the chart
// plot - https://www.tradingview.com/pine-script-docs/en/v4/annotations/plot_annotation.html
plot(MA1Visible ? MA1 : na, color=color.green, linewidth=2, title="MA1")
plot(MA2Visible ? MA2 : na, color=color.yellow, linewidth=3, title="MA2")
plot(MA3Visible ? MA3 : na, color=color.red, linewidth=4, title="MA3")
// Forecasting - forcasted prices are calculated using our MAType and MASource for the MAPeriod - the last X candles.
// it essentially replaces the oldest X candles, with the selected source * X candles
// Bias - We'll add an "adjustment" for each additional candle being forecasted based on ATR of the previous X candles
// custom functions in pine - https://www.tradingview.com/wiki/Declaring_Functions
bias(Bias, BiasPeriod) =>
if Bias == "Neutral"
0
else
if Bias == "Bullish"
(atr(BiasPeriod) * ForecastBiasMagnitude)
else
if Bias == "Bearish"
((atr(BiasPeriod) * ForecastBiasMagnitude) * -1) // multiplying by -1 to make it a negative, bearish bias
// Note - Can not show forecasts on different resolutions at the moment, x-axis is an issue
Bias = bias(ForecastBias, ForecastBiasPeriod) // 14 is default atr period
MA1Forecast1 = (request.security(syminfo.tickerid, res(MA1Resolution), ma(MA1Type, MA1Source, MA1Period - 1)) * (MA1Period - 1) + ((MA1Source * 1) + (Bias * 1))) / MA1Period
MA1Forecast2 = (request.security(syminfo.tickerid, res(MA1Resolution), ma(MA1Type, MA1Source, MA1Period - 2)) * (MA1Period - 2) + ((MA1Source * 2) + (Bias * 2))) / MA1Period
MA1Forecast3 = (request.security(syminfo.tickerid, res(MA1Resolution), ma(MA1Type, MA1Source, MA1Period - 3)) * (MA1Period - 3) + ((MA1Source * 3) + (Bias * 3))) / MA1Period
MA1Forecast4 = (request.security(syminfo.tickerid, res(MA1Resolution), ma(MA1Type, MA1Source, MA1Period - 4)) * (MA1Period - 4) + ((MA1Source * 4) + (Bias * 4))) / MA1Period
MA1Forecast5 = (request.security(syminfo.tickerid, res(MA1Resolution), ma(MA1Type, MA1Source, MA1Period - 5)) * (MA1Period - 5) + ((MA1Source * 5) + (Bias * 5))) / MA1Period
plot(MA1Resolution == "00 Current" and ShowForecasts and MA1Visible ? MA1Forecast1 : na, color=color.green, linewidth=1, style=plot.style_circles, title="MA1 Forecast 1", offset=1, show_last=1)
plot(MA1Resolution == "00 Current" and ShowForecasts and MA1Visible ? MA1Forecast2 : na, color=color.green, linewidth=1, style=plot.style_circles, title="MA1 Forecast 2", offset=2, show_last=1)
plot(MA1Resolution == "00 Current" and ShowForecasts and MA1Visible ? MA1Forecast3 : na, color=color.green, linewidth=1, style=plot.style_circles, title="MA1 Forecast 3", offset=3, show_last=1)
plot(MA1Resolution == "00 Current" and ShowForecasts and MA1Visible ? MA1Forecast4 : na, color=color.green, linewidth=1, style=plot.style_circles, title="MA1 Forecast 4", offset=4, show_last=1)
plot(MA1Resolution == "00 Current" and ShowForecasts and MA1Visible ? MA1Forecast5 : na, color=color.green, linewidth=1, style=plot.style_circles, title="MA1 Forecast 5", offset=5, show_last=1)
MA2Forecast1 = (request.security(syminfo.tickerid, res(MA2Resolution), ma(MA2Type, MA2Source, MA2Period - 1)) * (MA2Period - 1) + ((MA1Source * 1) + (Bias * 1))) / MA2Period
MA2Forecast2 = (request.security(syminfo.tickerid, res(MA2Resolution), ma(MA2Type, MA2Source, MA2Period - 2)) * (MA2Period - 2) + ((MA1Source * 2) + (Bias * 2))) / MA2Period
MA2Forecast3 = (request.security(syminfo.tickerid, res(MA2Resolution), ma(MA2Type, MA2Source, MA2Period - 3)) * (MA2Period - 3) + ((MA1Source * 3) + (Bias * 3))) / MA2Period
MA2Forecast4 = (request.security(syminfo.tickerid, res(MA2Resolution), ma(MA2Type, MA2Source, MA2Period - 4)) * (MA2Period - 4) + ((MA1Source * 4) + (Bias * 4))) / MA2Period
MA2Forecast5 = (request.security(syminfo.tickerid, res(MA2Resolution), ma(MA2Type, MA2Source, MA2Period - 5)) * (MA2Period - 5) + ((MA1Source * 5) + (Bias * 5))) / MA2Period
plot(MA2Resolution == "00 Current" and ShowForecasts and MA2Visible ? MA2Forecast1 : na, color=color.yellow, linewidth=1, style=plot.style_circles, title="MA2 Forecast 1", offset=1, show_last=1)
plot(MA2Resolution == "00 Current" and ShowForecasts and MA2Visible ? MA2Forecast2 : na, color=color.yellow, linewidth=1, style=plot.style_circles, title="MA2 Forecast 2", offset=2, show_last=1)
plot(MA2Resolution == "00 Current" and ShowForecasts and MA2Visible ? MA2Forecast3 : na, color=color.yellow, linewidth=1, style=plot.style_circles, title="MA2 Forecast 3", offset=3, show_last=1)
plot(MA2Resolution == "00 Current" and ShowForecasts and MA2Visible ? MA2Forecast4 : na, color=color.yellow, linewidth=1, style=plot.style_circles, title="MA2 Forecast 4", offset=4, show_last=1)
plot(MA2Resolution == "00 Current" and ShowForecasts and MA2Visible ? MA2Forecast5 : na, color=color.yellow, linewidth=1, style=plot.style_circles, title="MA2 Forecast 5", offset=5, show_last=1)
MA3Forecast1 = (request.security(syminfo.tickerid, res(MA3Resolution), ma(MA3Type, MA3Source, MA3Period - 1)) * (MA3Period - 1) + ((MA1Source * 1) + (Bias * 1))) / MA3Period
MA3Forecast2 = (request.security(syminfo.tickerid, res(MA3Resolution), ma(MA3Type, MA3Source, MA3Period - 2)) * (MA3Period - 2) + ((MA1Source * 2) + (Bias * 2))) / MA3Period
MA3Forecast3 = (request.security(syminfo.tickerid, res(MA3Resolution), ma(MA3Type, MA3Source, MA3Period - 3)) * (MA3Period - 3) + ((MA1Source * 3) + (Bias * 3))) / MA3Period
MA3Forecast4 = (request.security(syminfo.tickerid, res(MA3Resolution), ma(MA3Type, MA3Source, MA3Period - 4)) * (MA3Period - 4) + ((MA1Source * 4) + (Bias * 4))) / MA3Period
MA3Forecast5 = (request.security(syminfo.tickerid, res(MA3Resolution), ma(MA3Type, MA3Source, MA3Period - 5)) * (MA3Period - 5) + ((MA1Source * 5) + (Bias * 5))) / MA3Period
plot(MA3Resolution == "00 Current" and ShowForecasts and MA3Visible ? MA3Forecast1 : na, color=color.red, linewidth=1, style=plot.style_circles, title="MA3 Forecast 1", offset=1, show_last=1)
plot(MA3Resolution == "00 Current" and ShowForecasts and MA3Visible ? MA3Forecast2 : na, color=color.red, linewidth=1, style=plot.style_circles, title="MA3 Forecast 2", offset=2, show_last=1)
plot(MA3Resolution == "00 Current" and ShowForecasts and MA3Visible ? MA3Forecast3 : na, color=color.red, linewidth=1, style=plot.style_circles, title="MA3 Forecast 3", offset=3, show_last=1)
plot(MA3Resolution == "00 Current" and ShowForecasts and MA3Visible ? MA3Forecast4 : na, color=color.red, linewidth=1, style=plot.style_circles, title="MA3 Forecast 4", offset=4, show_last=1)
plot(MA3Resolution == "00 Current" and ShowForecasts and MA3Visible ? MA3Forecast5 : na, color=color.red, linewidth=1, style=plot.style_circles, title="MA3 Forecast 5", offset=5, show_last=1)
// Ribbon related code
// For Ribbons to work - they must use the same MAType, MAResolution and MASource. This is to ensure the ribbons are fair between one to the other.
// Ribbons also will usually look better if MA1Period < MA2Period and MA2Period < MA3Period
// custom functions in pine - https://www.tradingview.com/wiki/Declaring_Functions
// This function is used to calculate the period to be used on a ribbon based on existing MAs
rperiod(P1, P2, Step, Ribbons) =>
((array.abs(P1 - P2)) / (Ribbons + 1) * Step) + math.min(P1, P2)
// divide by +1 so that 5 lines can show. Divide by 5 and one line shows up on another MA
// MA1-MA2
Ribbon1 = request.security(syminfo.tickerid, res(MA1Resolution), ma(MA1Type, MA1Source, rperiod(MA1Period, MA2Period, 1, 5)))
Ribbon2 = request.security(syminfo.tickerid, res(MA1Resolution), ma(MA1Type, MA1Source, rperiod(MA1Period, MA2Period, 2, 5)))
Ribbon3 = request.security(syminfo.tickerid, res(MA1Resolution), ma(MA1Type, MA1Source, rperiod(MA1Period, MA2Period, 3, 5)))
Ribbon4 = request.security(syminfo.tickerid, res(MA1Resolution), ma(MA1Type, MA1Source, rperiod(MA1Period, MA2Period, 4, 5)))
Ribbon5 = request.security(syminfo.tickerid, res(MA1Resolution), ma(MA1Type, MA1Source, rperiod(MA1Period, MA2Period, 5, 5)))
plot(ShowRibbons and MA1Type == MA2Type and MA1Resolution == MA2Resolution and MA1Source == MA2Source ? Ribbon1 : na, color=color.green, linewidth=1, style=plot.style_line, title="Ribbon1", transp=90)
plot(ShowRibbons and MA1Type == MA2Type and MA1Resolution == MA2Resolution and MA1Source == MA2Source ? Ribbon2 : na, color=color.green, linewidth=1, style=plot.style_line, title="Ribbon2", transp=85)
plot(ShowRibbons and MA1Type == MA2Type and MA1Resolution == MA2Resolution and MA1Source == MA2Source ? Ribbon3 : na, color=color.green, linewidth=1, style=plot.style_line, title="Ribbon3", transp=80)
plot(ShowRibbons and MA1Type == MA2Type and MA1Resolution == MA2Resolution and MA1Source == MA2Source ? Ribbon4 : na, color=color.yellow, linewidth=1, style=plot.style_line, title="Ribbon4", transp=75)
plot(ShowRibbons and MA1Type == MA2Type and MA1Resolution == MA2Resolution and MA1Source == MA2Source ? Ribbon5 : na, color=color.yellow, linewidth=1, style=plot.style_line, title="Ribbon5", transp=70)
// MA2-MA3
Ribbon6 = request.security(syminfo.tickerid, res(MA2Resolution), ma(MA2Type, MA2Source, rperiod(MA2Period, MA3Period, 1, 5)))
Ribbon7 = request.security(syminfo.tickerid, res(MA2Resolution), ma(MA2Type, MA2Source, rperiod(MA2Period, MA3Period, 2, 5)))
Ribbon8 = request.security(syminfo.tickerid, res(MA2Resolution), ma(MA2Type, MA2Source, rperiod(MA2Period, MA3Period, 3, 5)))
Ribbon9 = request.security(syminfo.tickerid, res(MA2Resolution), ma(MA2Type, MA2Source, rperiod(MA2Period, MA3Period, 4, 5)))
Ribbon10 = request.security(syminfo.tickerid, res(MA2Resolution), ma(MA2Type, MA2Source, rperiod(MA2Period, MA3Period, 5, 5)))
plot(ShowRibbons and MA2Type == MA3Type and MA2Resolution == MA3Resolution and MA2Source == MA3Source ? Ribbon6 : na, color=color.yellow, linewidth=1, style=plot.style_line, title="Ribbon6", transp=70)
plot(ShowRibbons and MA2Type == MA3Type and MA2Resolution == MA3Resolution and MA2Source == MA3Source ? Ribbon7 : na, color=color.yellow, linewidth=1, style=plot.style_line, title="Ribbon7", transp=75)
plot(ShowRibbons and MA2Type == MA3Type and MA2Resolution == MA3Resolution and MA2Source == MA3Source ? Ribbon8 : na, color=color.red, linewidth=1, style=plot.style_line, title="Ribbon8", transp=80)
plot(ShowRibbons and MA2Type == MA3Type and MA2Resolution == MA3Resolution and MA2Source == MA3Source ? Ribbon9 : na, color=color.red, linewidth=1, style=plot.style_line, title="Ribbon9", transp=85)
plot(ShowRibbons and MA2Type == MA3Type and MA2Resolution == MA3Resolution and MA2Source == MA3Source ? Ribbon10 : na, color=color.red, linewidth=1, style=plot.style_line, title="Ribbon10", transp=90)
// Strategy Specific
if MA12Crossover and TradeMA12Crosses
//https://www.tradingview.com/pine-script-reference/#fun_strategy{dot}entry
strategy.entry("1 over 2", strategy.long, comment="1 over 2")
if MA12Crossunder and TradeMA12Crosses
//https://www.tradingview.com/pine-script-reference/#fun_strategy{dot}close
strategy.close("1 over 2")
if MA13Crossover and TradeMA13Crosses
//https://www.tradingview.com/pine-script-reference/#fun_strategy{dot}entry
strategy.entry("1 over 3", strategy.long, comment="1 over 3")
if MA13Crossunder and TradeMA13Crosses
//https://www.tradingview.com/pine-script-reference/#fun_strategy{dot}close
strategy.close("1 over 3")
if MA23Crossover and TradeMA23Crosses
//https://www.tradingview.com/pine-script-reference/#fun_strategy{dot}entry
strategy.entry("2 over 3", strategy.long, comment="2 over 3")
if MA23Crossunder and TradeMA23Crosses
//https://www.tradingview.com/pine-script-reference/#fun_strategy{dot}close
strategy.close("2 over 3")