
Strategi pemburu trend jangka masa berbilang adalah strategi yang menggunakan pelbagai petunjuk yang dikombinasikan untuk mewujudkan isyarat perdagangan automatik. Strategi ini menggabungkan penggunaan purata bergerak, petunjuk trend super dan petunjuk grafik awan, dan lain-lain, untuk menilai arah trend dalam beberapa jangka masa untuk mencari peluang perdagangan yang berpotensi.
Prinsip teras strategi ini adalah untuk menilai arah trend pada kedua-dua jangka masa tinggi dan rendah. Strategi ini pertama-tama mengira rata-rata bergerak yang penting, garis trend super dan garis peralihan, garis asas dan lain-lain pada jangka masa tinggi. Kemudian menghitung garis trend super pada jangka masa rendah.
Setelah memenuhi syarat-syarat tertentu, strategi ini akan menghasilkan isyarat dagangan untuk membeli atau menjual. Pengguna boleh memilih sama ada untuk berdagang hanya dengan pilihan panjang, pendek atau kedua-duanya mengikut keperluan mereka. Selain itu, pengguna juga boleh mengkonfigurasi parameter purata bergerak, parameter tren super, parameter grafik awan, dan lain-lain untuk mengoptimumkan prestasi strategi.
Kelebihan utama strategi ini adalah gabungan pelbagai jangka masa dan pelbagai indikator, yang dapat meningkatkan ketepatan penilaian arah trend dan melihat peluang pembalikan tepat pada masanya. Kelebihan khusus adalah sebagai berikut:
Risiko utama strategi ini adalah bahawa parameter yang tidak betul boleh menyebabkan perdagangan yang terlalu kerap atau kehilangan peluang. Selain itu, isyarat yang salah dari penunjuk juga boleh menyebabkan kerugian. Risiko spesifik dan penyelesaian adalah sebagai berikut:
Strategi ini masih boleh dioptimumkan lagi:
Secara keseluruhannya, strategi pemburu trend pelbagai kerangka masa menggunakan pelbagai petunjuk dan pelbagai kerangka masa untuk menilai trend, dapat menangkap peluang pembalikan tepat pada masanya, merupakan strategi perdagangan kuantitatif yang berprestasi baik. Strategi ini berintegrasi tinggi, digunakan secara meluas, dan masih ada ruang pengoptimuman yang besar di masa depan, layak untuk pedagang kuantitatif terus mengkaji dan menerapkan.
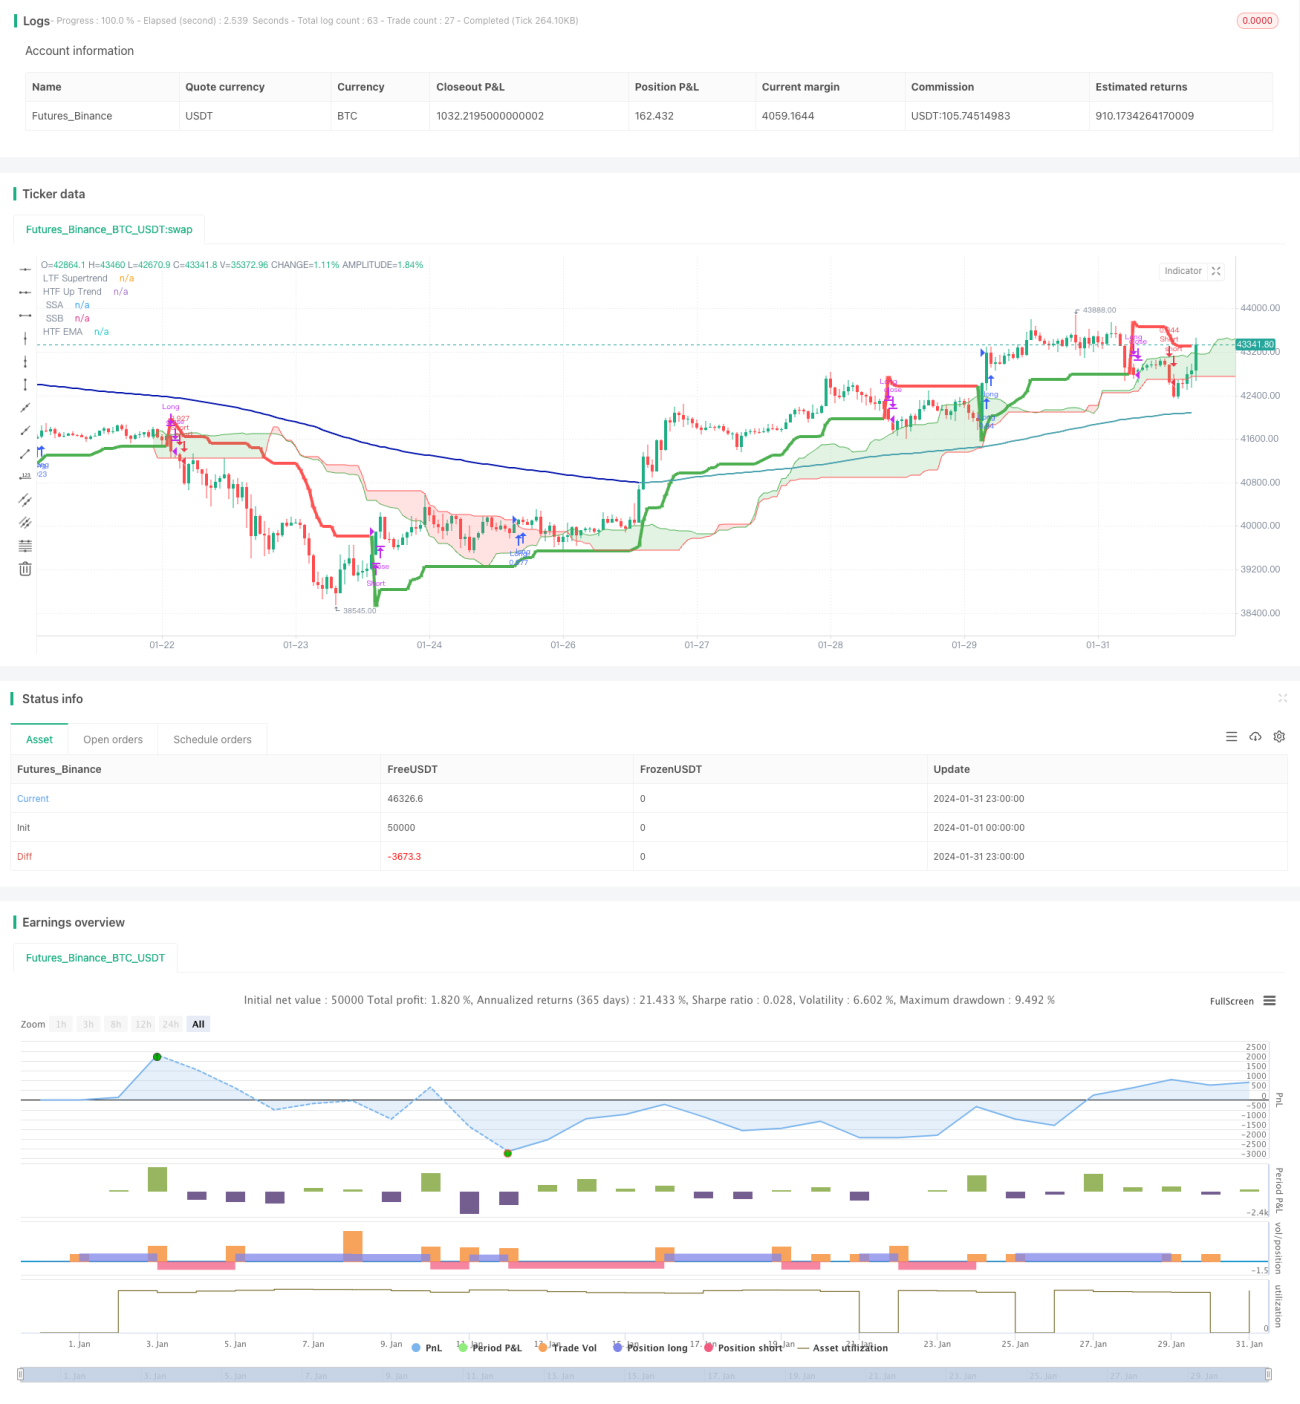
/*backtest
start: 2024-01-01 00:00:00
end: 2024-01-31 23:59:59
period: 1h
basePeriod: 15m
exchanges: [{"eid":"Futures_Binance","currency":"BTC_USDT"}]
*/
// This Pine Script™ code is subject to the terms of the Mozilla Public License 2.0 at https://mozilla.org/MPL/2.0/
// © godzcopilot / blockybears
// Thanks to anthonyf50 for his MTF Ichimoku https://www.tradingview.com/script/Pw9cBFma/
// Thanks to KivancOzbilgic for his SuperTrend https://www.tradingview.com/script/r6dAP7yi/
// Thanks to ZenAndTheArtOfTrading / PineScriptMastery for their Higher Timeframe EMA https://www.tradingview.com/script/Vh3XG9sD-Higher-Timeframe-EMA/
//@version=5
strategy("TrendHunter [Blocky]", overlay=true, default_qty_type=strategy.percent_of_equity, default_qty_value=80, initial_capital=1000, pyramiding=0)
// ================
// Strategy Inputs
// ================
// Defines user inputs for configuring the strategy.
// Higher Time Frame Selection
HTF_TimeFrame = input.timeframe(title='Higher Time Frame', defval='60', group = '== Timeframe ==', tooltip = "Select Chart for standard functionality")
// Inputs for EMA
len = input.int(title="EMA Length", defval=200, group ='== EMA ==')
col = input.bool(title="Colour EMA", defval=true, group ='== EMA ==')
// SuperTrend
Periods = input(title='ATR Period', defval=10, group = '== Supertrend ==')
Multiplier = input.float(title='ATR Multiplier', step=0.1, defval=3.0, group = '== Supertrend ==')
Src = input.source(title='Source', defval=hl2, group = '== Supertrend ==')
// Ichimoku
conversionPeriods = input.int(9, minval=1, title='Conversion Line Periods', group = '== Ichimoku ==')
basePeriods = input.int(26, minval=1, title='Base Line Periods', group = '== Ichimoku ==')
laggingSpan2Periods = input.int(52, minval=1, title='Lagging Span 2 Periods', group = '== Ichimoku ==')
displacement = input.int(26, minval=1, title='Displacement', group = '== Ichimoku ==')
// Ichimoku Display Options
isActiveConversion = input(false, 'Conversion Line', group = '== Ichimoku ==', inline = 'lines1')
isActiveBase = input(false, 'Base Line', group = '== Ichimoku ==', inline = 'lines1')
isActiveLagging = input(false, 'Lagging Span', group = '== Ichimoku ==', inline = 'lines2')
isActiveCloud = input(true, 'Cloud', group = '== Ichimoku ==', inline = 'lines2')
// ================
// Strategy Options
// ================
bTable = input.bool(true, title='Trade Table', group='== Strategy Options ==', tooltip = "Show table that shows current selected options and trade trade entry parameters")
bLong = input.bool(true, title='Enter Longs', group='== Strategy Options ==', inline = 'LongShort')
bShort = input.bool(true, title='Enter Shorts', group='== Strategy Options ==', inline = 'LongShort', tooltip = "Filter long / short trade signals")
bPriceCloud = input.bool(true, title='Price outside cloud', group='== Strategy Options ==', inline='PriceCloud')
bPriceCloudBody = input.bool(false, title='Full Body', group='== Strategy Options ==', inline='PriceCloud', tooltip = 'Only trade when price action outside the cloud.\nLongs when price action above the cloud.\nShort when price action below the cloud')
bPriceEMA = input.bool(false, title='Price above/below EMA', group='== Strategy Options ==', inline='PriceEMA')
bPriceEMABody = input.bool(false, title='Full Body', group='== Strategy Options ==', inline='PriceEMA', tooltip = 'Longs when price action above the EMA.\nShort when price action below the EMA')
bSuper = input.bool(true, title='Supertrend transistions', group='== Strategy Options ==', tooltip = "Trade in direction of the supertrend transitions")
bLTF = input.bool(false, title='LTF/HTF Supertrend alignment', group='== Strategy Options ==', tooltip = "Utilise a dual supertrends, chart and defined higher time frame")
bEMACloud1 = input.bool(true, title='EMA Outside Cloud', group='== Strategy Options ==', tooltip = "EMA must be outside the ichimoku cloud")
bEMACloud2 = input.bool(false, title='EMA above/below Cloud', group='== Strategy Options ==', tooltip = "Longs when EMA above the cloud.\nShort when EMA below the cloud")
bExitHTFTrail = input.bool(true, title='Super Trend Exits: HTF', group='== Strategy Options ==', inline = 'Exits')
bExitLTFTrail = input.bool(true, title='LTF', group='== Strategy Options ==', inline = 'Exits', tooltip = 'Exit trades when price crosses the supertrend line\nIf neither selected trade closes when opposite trade opens\nIf using LTF closes turn on HTF/LTF alignment')
// ===========================
// EMA Functions and Plotting
// ===========================
// Calculate EMA
ema = ta.ema(close, len)
emaSmooth = request.security(syminfo.tickerid, HTF_TimeFrame, ema[barstate.isrealtime ? 1 : 0], gaps=barmerge.gaps_on)[barstate.isrealtime ? 0 : 1]
// Draw EMA
plot(emaSmooth, color=col ? (close > emaSmooth ? color.rgb(76, 163, 175) : color.rgb(6, 23, 173)) : color.black, linewidth=2, title="HTF EMA")
// ==================================
// Supertrend Functions and Plotting
// ==================================
// Function to calculate SuperTrend
calcSuperTrend(src, atrPeriods, multiplier) =>
atr = ta.atr(atrPeriods)
up = src - multiplier * atr
up1 = nz(up[1], up)
up := close[1] > up1 ? math.max(up, up1) : up
dn = src + multiplier * atr
dn1 = nz(dn[1], dn)
dn := close[1] < dn1 ? math.min(dn, dn1) : dn
trend = 1
trend := nz(trend[1], trend)
trend := trend == -1 and close > dn1 ? 1 : trend == 1 and close < up1 ? -1 : trend
[up, dn, trend]
// Calculate SuperTrend for the current time frame
[up, dn, trend] = calcSuperTrend(Src, Periods, Multiplier)
// Plotting for the current time frame
plot(trend == 1 ? up : dn, title='LTF Supertrend', color=trend == 1 ?color.green : color.red, linewidth=1, style = plot.style_stepline)
// Fetching the higher time frame data
[HTF_up, HTF_dn, HTF_trend] = request.security(syminfo.tickerid, HTF_TimeFrame, calcSuperTrend(hl2, Periods, Multiplier), lookahead=barmerge.lookahead_on)
// Plotting for the higher time frame
plot(HTF_trend == 1 ? HTF_up : HTF_dn, title='HTF Up Trend', color= HTF_trend == 1 ? color.green : color.red, linewidth=4)
// ===============================
// Ichimoku Functions and Plotting
// ===============================
// Function to convert timeframe to hours
f_convertTimeframeToHours(tf) =>
val = 0.0
if tf == "1S" or tf == "S"
val := 1.0 / 3600.0
else if str.contains(tf, "S")
val := str.tonumber(str.replace(tf, "S", "")) / 3600.0
else if tf == "1D" or tf == "D"
val := 24.0
else if str.contains(tf, "D")
val := str.tonumber(str.replace(tf, "D", "")) * 24.0
else if tf == "1W" or tf == "W"
val := 24.0 * 7.0
else if str.contains(tf, "W")
val := str.tonumber(str.replace(tf, "W", "")) * 24.0 * 7.0
else if tf == "1M" or tf == "M"
val := 24.0 * 30.0 // Approximation for a month
else if str.contains(tf, "M")
val := str.tonumber(str.replace(tf, "M", "")) * 24.0 * 30.0 // Approximation for months
else
// Default to minutes
val := str.tonumber(tf) / 60.0
val
// Time
timeOffset = time - time[1]
// Returns the displacement based on the chart / HTF resolution
f_getDisplacement(_res) =>
_res == '' ? displacement : math.round(f_convertTimeframeToHours(_res) / f_convertTimeframeToHours(timeframe.period) * displacement)
//f_avgDilationOf(_res) * displacement
// Returns average value between lowest and highest
f_avgLH(_len) =>
math.avg(ta.lowest(_len), ta.highest(_len))
// Returns f_donchian data
f_donchian(_tf, _src) =>
request.security(syminfo.tickerid, _tf, _src, barmerge.gaps_off, barmerge.lookahead_on)
// Returns ichimoku data
f_ichimokuData(_tf) =>
_isShow = _tf == '' or f_convertTimeframeToHours(_tf) >= f_convertTimeframeToHours(timeframe.period)
_displacement = _isShow ? f_getDisplacement(_tf) : na
_Conversion = _isShow ? f_donchian(_tf, f_avgLH(conversionPeriods)) : na
_Base = _isShow ? f_donchian(_tf, f_avgLH(basePeriods)) : na
_Lagging = _isShow ? f_donchian(_tf, close) : na
_SSA = _isShow ? math.avg(_Conversion, _Base) : na
_SSB = _isShow ? f_donchian(_tf, f_avgLH(laggingSpan2Periods)) : na
_middleCloud = _isShow ? _SSA[0] > _SSB[0] ? _SSA[0] - math.abs(_SSA[0] - _SSB[0]) / 2 : _SSA[0] + math.abs(_SSA[0] - _SSB[0]) / 2 : na
[_displacement, _Conversion, _Base, _Lagging, _SSA, _SSB, _middleCloud]
// Plotting ichimoku data
[Displacement, Conversion, Base, Lagging, SSA, SSB, fisrtMiddleCloud] = f_ichimokuData(HTF_TimeFrame)
// ————— Conversion
plot(isActiveConversion ? Conversion : na, color=color.new(color.blue, 0), title=' Conversion', linewidth=1)
// ————— Base
plot(isActiveBase ? Base : na, color=color.new(color.fuchsia, 0), title=' Base', linewidth=2)
// ————— Lagging
plot(isActiveLagging ? Lagging : na, offset=-Displacement, color=color.new(color.green, 0), title=' Lagging')
// ————— SSA + SSB
ssa = plot(isActiveCloud ? SSA : na, offset=Displacement, color=color.new(color.green, 0), title=' SSA', linewidth=1)
ssb = plot(isActiveCloud ? SSB : na, offset=Displacement, color=color.new(color.red, 0), title=' SSB', linewidth=1)
fill(ssa, ssb, color=color.new(SSA > SSB ? color.green : color.red , 80), title=' Cloud')
// ===============================
// Strategy Entries
// ===============================
// Checks whether price is inside the Ichimoku cloud
f_PriceCloud(dir) =>
_enter = false
if bPriceCloud
if bLong and dir == 1
if bPriceCloudBody
_enter := close > math.max(SSA[Displacement], SSB[Displacement]) and open > math.max(SSA[Displacement], SSB[Displacement])
else
_enter := close > math.max(SSA[Displacement], SSB[Displacement])
if bShort and dir == 2
if bPriceCloudBody
_enter := close < math.min(SSA[Displacement], SSB[Displacement]) and open < math.min(SSA[Displacement], SSB[Displacement])
else
_enter := close < math.min(SSA[Displacement], SSB[Displacement])
else
_enter := na
_enter
// Checks whether price is above / below the ema
f_PriceEMA(dir) =>
_enter = false
if bPriceEMA
if bLong and dir == 1
if bPriceEMABody
_enter := close > emaSmooth and open > emaSmooth
else
_enter := close > emaSmooth
if bShort and dir == 2
if bPriceEMABody
_enter := close < emaSmooth and open < emaSmooth
else
_enter := close < emaSmooth
else
_enter := na
_enter
// Checks HTF supertrend direction
f_Super(dir) =>
_enter = false
if bSuper
if bLong and dir == 1
_enter := HTF_trend == 1
if bShort and dir == 2
_enter := HTF_trend == -1
else
_enter := na
_enter
// Checks LTF supertrend direction
f_LTF(dir) =>
_enter = false
if bLTF
if bLong and dir == 1
_enter := trend == 1 and HTF_trend == 1
if bShort and dir == 2
_enter := trend == -1 and HTF_trend == -1
else
_enter := na
_enter
// Checks whether ema is inside the Ichimoku cloud
f_EMACloud1(dir) =>
_enter = false
if bEMACloud1
if bLong and dir == 1
_enter := (emaSmooth > math.max(SSA[Displacement], SSB[Displacement])) or (emaSmooth < math.min(SSA[Displacement], SSB[Displacement]))
if bShort and dir == 2
_enter := (emaSmooth > math.max(SSA[Displacement], SSB[Displacement])) or (emaSmooth < math.min(SSA[Displacement], SSB[Displacement]))
else
_enter := na
_enter
// Checks whether ema is above/below Ichimoku cloud
f_EMACloud2(dir) =>
_enter = false
if bEMACloud2
if bLong and dir == 1
_enter := emaSmooth > math.max(SSA[Displacement], SSB[Displacement])
if bShort and dir == 2
_enter := emaSmooth < math.min(SSA[Displacement], SSB[Displacement])
else
_enter := na
_enter
// Check if a value is 'na' or true.
f_NATrue(val) =>
_enter = false
if na(val)
_enter := true
if val
_enter := true
_enter
// Consolidates entry conditions.
f_checkCondition(dir) =>
_enter = false
if na(f_PriceCloud(dir)) and na(f_PriceEMA(dir)) and na(f_Super(dir)) and na(f_LTF(dir)) and na(f_EMACloud1(dir)) and na(f_EMACloud2(dir))
_enter := false
else if f_NATrue(f_PriceCloud(dir)) and f_NATrue(f_PriceEMA(dir)) and f_NATrue(f_Super(dir)) and f_NATrue(f_LTF(dir)) and f_NATrue(f_EMACloud1(dir)) and f_NATrue(f_EMACloud2(dir))
_enter := true
_enter
// Execute long trade entries
longCondition = bLong and f_checkCondition(1)
if (longCondition)
strategy.entry("Long", strategy.long)
// Execute short trade entries
shortCondition = bShort and f_checkCondition(2)
if (shortCondition)
strategy.entry("Short", strategy.short)
// Excute trade exits
exitLong = (bExitHTFTrail and (close < HTF_up or HTF_trend == -1)) or (bExitLTFTrail and (close < up or trend == -1))
exitShort = (bExitHTFTrail and (close > HTF_dn or HTF_trend == 1)) or (bExitLTFTrail and (close > dn or trend == 1))
if exitLong
strategy.close("Long")
if exitShort
strategy.close("Short")
// Creates a table shoing all the user options and their current status for entering a trade
if bTable
// Create a table
tbl = table.new(position = position.bottom_right, columns = 4, rows = 9, bgcolor=color.new(color.white, 50), border_width = 1)
table.cell(tbl, 1, 0, "Selected")
table.cell(tbl, 2, 0, "Long", bgcolor=na(bLong) ? color.gray : bShort ? color.rgb(4, 112, 8) : color.rgb(100, 7, 7))
table.cell(tbl, 3, 0, "Short", bgcolor=na(bShort) ? color.gray : bShort ? color.rgb(4, 112, 8) : color.rgb(100, 7, 7))
table.cell(tbl, 0, 1, "Entry")
table.cell(tbl, 2, 1, str.tostring(longCondition), bgcolor=longCondition ? color.green : color.red)
table.cell(tbl, 3, 1, str.tostring(shortCondition), bgcolor=shortCondition ? color.green : color.red)
table.cell(tbl, 0, 3, "Price Cloud")
table.cell(tbl, 1, 3, str.tostring(bPriceCloud), bgcolor=na(bPriceCloud) ? color.gray : bPriceCloud ? color.green : color.red)
table.cell(tbl, 2, 3, str.tostring(f_PriceCloud(1)), bgcolor=na(f_PriceCloud(1)) ? color.gray : f_PriceCloud(1) ? color.green : color.red)
table.cell(tbl, 3, 3, str.tostring(f_PriceCloud(2)), bgcolor=na(f_PriceCloud(2)) ? color.gray : f_PriceCloud(2) ? color.green : color.red)
table.cell(tbl, 0, 4, "Price EMA")
table.cell(tbl, 1, 4, str.tostring(bPriceEMA), bgcolor=na(bPriceEMA) ? color.gray : bPriceEMA ? color.green : color.red)
table.cell(tbl, 2, 4, str.tostring(f_PriceEMA(1)), bgcolor=na(f_PriceEMA(1)) ? color.gray : f_PriceEMA(1) ? color.green : color.red)
table.cell(tbl, 3, 4, str.tostring(f_PriceEMA(2)), bgcolor=na(f_PriceEMA(2)) ? color.gray : f_PriceEMA(2) ? color.green : color.red)
table.cell(tbl, 0, 5, "SuperTrend")
table.cell(tbl, 1, 5, str.tostring(bSuper), bgcolor=na(bSuper) ? color.gray : bSuper ? color.green : color.red)
table.cell(tbl, 2, 5, str.tostring(f_Super(1)), bgcolor=na(f_Super(1)) ? color.gray : f_Super(1) ? color.green : color.red)
table.cell(tbl, 3, 5, str.tostring(f_Super(2)), bgcolor=na(f_Super(2)) ? color.gray : f_Super(2) ? color.green : color.red)
table.cell(tbl, 0, 6, "HTF/LTF")
table.cell(tbl, 1, 6, str.tostring(bLTF), bgcolor=na(bLTF) ? color.gray : bLTF ? color.green : color.red)
table.cell(tbl, 2, 6, str.tostring(f_LTF(1)), bgcolor=na(f_LTF(1)) ? color.gray : f_LTF(1) ? color.green : color.red)
table.cell(tbl, 3, 6, str.tostring(f_LTF(2)), bgcolor=na(f_LTF(2)) ? color.gray : f_LTF(2) ? color.green : color.red)
table.cell(tbl, 0, 7, "EMA Outside Cloud")
table.cell(tbl, 1, 7, str.tostring(bEMACloud1), bgcolor=na(bEMACloud1) ? color.gray : bEMACloud1 ? color.green : color.red)
table.cell(tbl, 2, 7, str.tostring(f_EMACloud1(1)), bgcolor=na(f_EMACloud1(1)) ? color.gray : f_EMACloud1(1) ? color.green : color.red)
table.cell(tbl, 3, 7, str.tostring(f_EMACloud1(2)), bgcolor=na(f_EMACloud1(2)) ? color.gray : f_EMACloud1(2) ? color.green : color.red)
table.cell(tbl, 0, 8, "EMA Above/Below Cloud")
table.cell(tbl, 1, 8, str.tostring(bEMACloud2), bgcolor=na(bEMACloud2) ? color.gray : bEMACloud2 ? color.green : color.red)
table.cell(tbl, 2, 8, str.tostring(f_EMACloud2(1)), bgcolor=na(f_EMACloud2(1)) ? color.gray : f_EMACloud2(1) ? color.green : color.red)
table.cell(tbl, 3, 8, str.tostring(f_EMACloud2(2)), bgcolor=na(f_EMACloud2(2)) ? color.gray : f_EMACloud2(2) ? color.green : color.red)