Estratégia de maximização do lucro Y
Visão geral
A ideia central desta estratégia é maximizar o valor do rastreamento de stop loss móvel, complementado com filtros e métodos de parada para otimizar a entrada. O Y no nome da estratégia representa a forma de cruzamento da linha de sinal da estratégia.
Princípio da estratégia
Esta estratégia é baseada na estratégia do explorador PMax de KivancOzbilgic, com algumas modificações.
PMax calculado com base no ATR e na média móvel. Gera um sinal de compra quando o preço atravessa o PMax.
Adicionar o indicador T3 e o preço como filtros para garantir a entrada quando a tendência é para cima.
Configurar o método de parada: configure a estratégia de BAND duplo para determinar a primeira parada; depois, use a estratégia de colher para determinar a parada e o ponto de parada subsequentes.
Os indicadores MOST auxiliam na determinação de tendências para reduzir a inversão desnecessária.
Análise de vantagens
A estratégia PMax em si tem a vantagem de evitar o rastreamento de alto stop loss, e o mecanismo de stop loss móvel é mais favorável à redução do DD.
Os filtros duplos garantem a entrada somente em alta e evitam falsas rupturas.
A configuração de pontos de paragem múltiplos permite uma maior flexibilidade nas receitas.
O indicador MOST assegura que só se façam operações de múltiplos cabeçalhos, evitando a negociação inversa.
Análise de Riscos
A PMax é uma espécie de atraso, e é fácil de perder a primeira brecha.
A configuração excessiva do filtro também pode perder o ponto de entrada do ouro.
A configuração de um limite de espera muito otimista pode impedir a realização de um pedido.
A negociação individual de múltiplos títulos é difícil de lucrar em variedades com alta volatilidade.
Direção de otimização
Os indicadores de admissão da classe MACD podem ser testados para julgar o desvio de curta duração para determinar o momento de admissão.
Pode-se testar um filtro simplificado, mantendo apenas um indicador de filtro.
Pode ser adicionado um mecanismo de parada de ajuste automático, ajustando o ponto de parada subsequente de acordo com a volatilidade e a dinâmica da taxa de retorno.
Pode-se testar o vazio permitido, ajustando a proporção de posição de acordo com o filtro.
Resumir
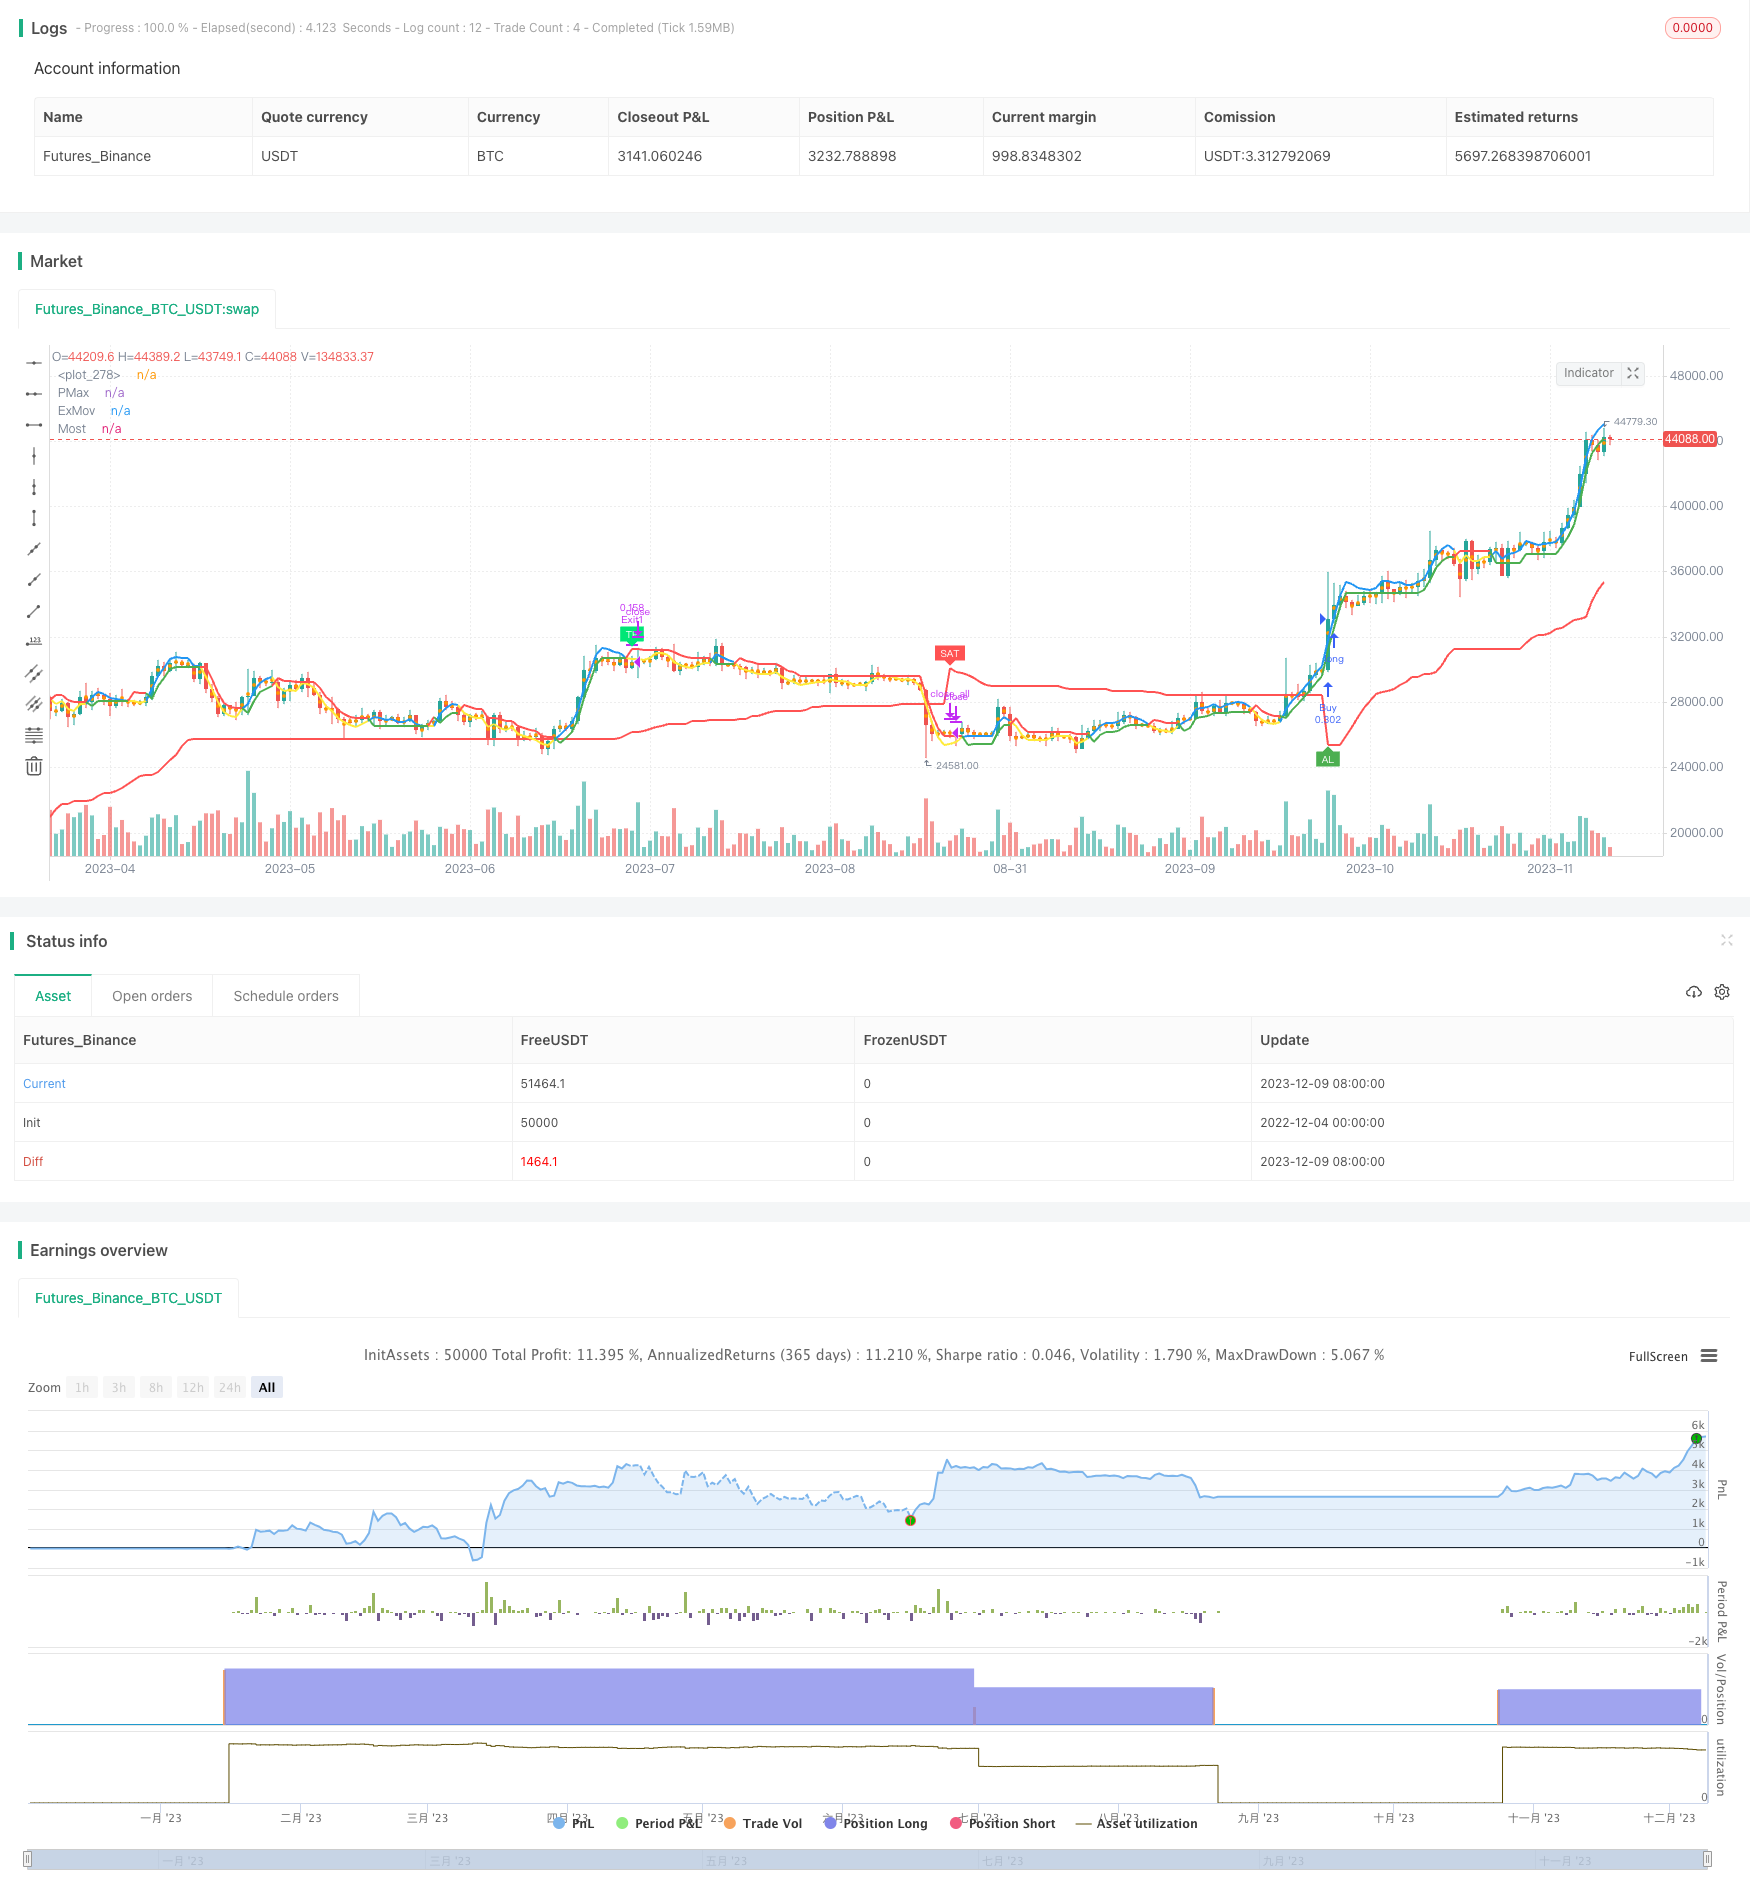
A estratégia, como um todo, toma o julgamento de entrada como o núcleo do PMax e projeta filtros e métodos de bloqueio em várias camadas para otimização, obtendo melhores ganhos em variedades de tendência. No final, a estratégia pode ser aperfeiçoada com a otimização de parâmetros da estratégia, adaptando-se a mais variedades, obtendo melhor desempenho no disco real, simplificando os filtros, otimizando as configurações de bloqueio e ajustando adequadamente a gestão de posições.
/*backtest
start: 2022-12-04 00:00:00
end: 2023-12-10 00:00:00
period: 1d
basePeriod: 1h
exchanges: [{"eid":"Futures_Binance","currency":"BTC_USDT"}]
*/

//@version=4
// This source code is subject to the terms of the Mozilla Public License 2.0 at https://mozilla.org/MPL/2.0/
// © KivancOzbilgic
//developer: @KivancOzbilgic
//author: @enesyetkin

strategy("Y-Profit Maximizer Strategy with Exit Points", shorttitle="Y-PMax Strategy with Exit Points", overlay=true, default_qty_type=strategy.cash, default_qty_value=10000, initial_capital=10000, currency=currency.USD, commission_value=0.1, commission_type=strategy.commission.percent)
baslik1 = input(title="-------------------- PMax Ayarları -------------------", defval=false)
src = input(hl2, title="Kaynak")
Periods = input(title="ATR uzunluğu", type=input.integer, defval=10)
Multiplier = input(title="ATR Multiplier", type=input.float, step=0.1, defval=3.0)
mav = input(title="Moving Average Tipi", defval="VAR", options=["SMA", "EMA", "WMA", "TMA", "VAR", "WWMA", "ZLEMA", "TSF"])
length =input(13, "Moving Average uzunluğu", minval=1)
filtrelemeacik = input(title="Filtreleme Açık/Kapalı", type=input.bool, defval=false)
filtreleme = input(title="Filtreleme T3/Src (T3 Açık/Src Kapalı)", type=input.bool, defval=false)
changeATR= input(title="ATR Hesaplama Yöntemi Değişsin mi?", type=input.bool, defval=true)
showsupport = input(title="Moving Average i göster?", type=input.bool, defval=false)
showsignalsk = input(title="Al Sat Sinyallerini göster?", type=input.bool, defval=true)
showsignalsc = input(title="Fiyat/Pmax kesişim sinyallerini göster?", type=input.bool, defval=false)
highlighting = input(title="Bulut Açık/Kapalı?", type=input.bool, defval=false)


baslik4 = input(title="-------------------- T3 Ayarları --------------------", defval=false)
length1 = input(89, "T3 Uzunluğu")
length2 = input(5, "T3 Filter Uzunluğu")
a1 = input(0.84, "T3 Volume Faktörü")
a13 = 0.84
length12 = input(5, "Fibo T3 Uzunluğu")
a12 = input(0.618, "T3 Fİbo Volume Faktörü")
T31Show = input(title="T3 ü göster?", type=input.bool, defval=false)
T32Show = input(title= "T3 filtreyi göster?", type=input.bool, defval=false)
T3FiboLine = input(false, title="T3 Fibonacci Oranlı Çizgiler?")

shownum = true

baslik7 = input(title="---------------- Take Profit Ayarları --------------", defval=false)

len = input(25, "Yılan Genişliği")
domcycle = input(20, minval=10, title="Dominant Döngü Genişliği")
rapida = input(8, "Hızlı Ort")
lenta = input(26, "Yavaş Ort")
stdv = input(0.8, "Genişlik")
tpfiltre = input(false, title="TP Filtresi avg2/avg4?")
tplevelshow = input(false, title="TP Level ve Exit Level Sayım Açık Kapalı?")
tp1show =  input(false, title="Erken TP Açık Kapalı")

baslik8 = input(title="------------------- MOST Ayarları ------------------", defval=false)

src_most=input(close,"Source")
AP2 = input(defval=8,title="Length",minval=1)
AF2 = input(defval=2,title="Percent",minval=0.1)/100
mav1 = input(title="Moving Average Tipi", defval="ZLEMovA", options=["EMovA","ZLEMovA"])
plotbuysell = input(true, "Al Sat Etiketleri", input.bool)


///T3 1&2
e1 = ema((high + low + 2 * close) / 4, length1)
e2 = ema(e1, length1)
e3 = ema(e2, length1)
e4 = ema(e3, length1)
e5 = ema(e4, length1)
e6 = ema(e5, length1)
c1 = -a1 * a1 * a1
c2 = 3 * a1 * a1 + 3 * a1 * a1 * a1
c3 = -6 * a1 * a1 - 3 * a1 - 3 * a1 * a1 * a1
c4 = 1 + 3 * a1 + a1 * a1 * a1 + 3 * a1 * a1
T3 = c1 * e6 + c2 * e5 + c3 * e4 + c4 * e3

e13 = ema((high + low + 2 * close) / 4, length2)
e23 = ema(e13, length2)
e33 = ema(e23, length2)
e43 = ema(e33, length2)
e53 = ema(e43, length2)
e63 = ema(e53, length2)
c13 = -a13 * a13 * a13
c23 = 3 * a13 * a13 + 3 * a13 * a13 * a13
c33 = -6 * a13 * a13 - 3 * a13 - 3 * a13 * a13 * a13
c43 = 1 + 3 * a13 + a13 * a13 * a13 + 3 * a13 * a13
T33 = c13 * e63 + c23 * e53 + c33 * e43 + c43 * e33


///PMax

atr2 = sma(tr, Periods)
atr= changeATR ? atr(Periods) : atr2
valpha=2/(length+1)
vud1=src>src[1] ? src-src[1] : 0
vdd1=src<src[1] ? src[1]-src : 0
vUD=sum(vud1,9)
vDD=sum(vdd1,9)
vCMO=nz((vUD-vDD)/(vUD+vDD))
VAR=0.0
VAR:=nz(valpha*abs(vCMO)*src)+(1-valpha*abs(vCMO))*nz(VAR[1])
wwalpha = 1/ length
WWMA = 0.0
WWMA := wwalpha*src + (1-wwalpha)*nz(WWMA[1])
zxLag = length/2==round(length/2) ? length/2 : (length - 1) / 2
zxEMAData = (src + (src - src[zxLag]))
ZLEMA = ema(zxEMAData, length)
lrc = linreg(src, length, 0)
lrc1 = linreg(src,length,1)
lrs = (lrc-lrc1)
TSF = linreg(src, length, 0)+lrs
getMA(src, length) =>
    ma = 0.0
    if mav == "SMA"
        ma := sma(src, length)
        ma

    if mav == "EMA"
        ma := ema(src, length)
        ma

    if mav == "WMA"
        ma := wma(src, length)
        ma

    if mav == "TMA"
        ma := sma(sma(src, ceil(length / 2)), floor(length / 2) + 1)
        ma

    if mav == "VAR"
        ma := VAR
        ma

    if mav == "WWMA"
        ma := WWMA
        ma

    if mav == "ZLEMA"
        ma := ZLEMA
        ma

    if mav == "TSF"
        ma := TSF
        ma

    if mav == "T3"
        ma := T3
        ma
    ma

MAvg=getMA(src, length)
longStop = MAvg - Multiplier*atr
longStopPrev = nz(longStop[1], longStop)
longStop := MAvg > longStopPrev ? max(longStop, longStopPrev) : longStop
shortStop = MAvg + Multiplier*atr
shortStopPrev = nz(shortStop[1], shortStop)
shortStop := MAvg < shortStopPrev ? min(shortStop, shortStopPrev) : shortStop
dir = 1
dir := nz(dir[1], dir)
dir := dir == -1 and MAvg > shortStopPrev ? 1 : dir == 1 and MAvg < longStopPrev ? -1 : dir
PMax = dir==1 ? longStop: shortStop


///MOST
zxLag1 = AP2/2==round(AP2/2) ? AP2/2 : (AP2 - 1) / 2
zxEMAData1 = (src_most + (src_most - src_most[zxLag1]))
ZLEMA1 = ema(zxEMAData1, AP2)

getMA1(src, length) =>
    ma1 = 0.0
    if mav1 == "EMovA"
        ma1 := ema(close, 8)
        ma1

    if mav1 == "ZLEMovA"
        ma1 := ZLEMA1
        ma1

Trail1 = getMA1(src, length)
SL2 = Trail1*AF2 // Stop Loss

Trail2 = 0.0
Trail2 := iff(Trail1>nz(Trail2[1],0) and Trail1[1]>nz(Trail2[1],0),max(nz(Trail2[1],0),Trail1-SL2),iff(Trail1<nz(Trail2[1],0) and Trail1[1]<nz(Trail2[1],0),min(nz(Trail2[1],0),Trail1+SL2),iff(Trail1>nz(Trail2[1],0),Trail1-SL2,Trail1+SL2)))

Buy = crossover(Trail1, Trail2)
Sell = crossunder(Trail1, Trail2)
SR=(iff(Trail1 > Trail2 ,1, iff(Trail2 > Trail1,-1,0)))


////T3 TILLSON 1


col1 = T3 > T3[1]
col3 = T3 < T3[1]
col4 = T33 > T33[1]
col5 = T33 < T33[1]
color_1 = col1 ? color.green : col3 ? color.red : color.yellow
color_4 = col4 ? color.green : col5 ? color.red : color.yellow


e12 = ema((high + low + 2 * close) / 4, length12)
e22 = ema(e12, length12)
e32 = ema(e22, length12)
e42 = ema(e32, length12)
e52 = ema(e42, length12)
e62 = ema(e52, length12)
c12 = -a12 * a12 * a12
c22 = 3 * a12 * a12 + 3 * a12 * a12 * a12
c32 = -6 * a12 * a12 - 3 * a12 - 3 * a12 * a12 * a12
c42 = 1 + 3 * a12 + a12 * a12 * a12 + 3 * a12 * a12
T32 = c12 * e62 + c22 * e52 + c32 * e42 + c42 * e32

col12 = T32 > T32[1]
col32 = T32 < T32[1]


///TP BB ve SNAKE

h = ema(high, len)
l = ema(low, len)

hp = h / h[len]
lp = l / l[len]

avg = avg(hp, lp)

havg = ema(highest(avg, len), len)
lavg = ema(lowest(avg, len), len)

avg2 = avg(havg, lavg)
avg3 = avg(havg, avg2)
avg4 = avg(havg, avg3)

dif = havg - avg2

ust = havg + dif
alt = lavg - dif

///BB on MACD

SDev = 0.0
banda_supe = 0.0
banda_inf = 0.0
m_rapida = ema(close,rapida)
m_lenta = ema(close,lenta)
BBMacd = m_rapida - m_lenta
Avg = ema(BBMacd,9)
SDev := stdev(BBMacd,9)
banda_supe := Avg + stdv * SDev
banda_inf := Avg - stdv * SDev

color2 = col12 ? color.blue : col32 ? color.purple : color.yellow

TS1 = plot(Trail1, "ExMov", style=plot.style_line,color=Trail1 > Trail2 ? color.blue : color.yellow, linewidth=2)
TS2 = plot(Trail2, "Most", style=plot.style_line,color=Trail1 > Trail2 ? color.green : color.red, linewidth=2)


tp1 = tpfiltre ? crossunder(BBMacd,banda_supe)  and (avg>avg2) and (MAvg>PMax) and nz(MAvg[10]) > nz(PMax[10]) : crossunder(BBMacd,banda_supe)  and (avg>avg4) and (MAvg>PMax) and nz(MAvg[15]) > nz(PMax[15])
plotshape(tp1 and tp1show, title="TP1", text="TP1", location=location.abovebar, style=shape.labeldown, size=size.tiny, color=color.aqua, textcolor=color.white,transp=0)

plot(T31Show ? T3 : na, color=color_1, linewidth=3, title="T3")
plot(T32Show ? T33 : na, color=color_4, linewidth=3, title="T3 Filter")
plot(T3FiboLine and T32 ? T32 : na, color=color2, linewidth=2, title="T3fibo")
plot(showsupport ? MAvg : na, color=#0585E1, linewidth=2, title="Moving Avg Line")
pALL=plot(PMax, color=color.red, linewidth=2, title="PMax", transp=100)
alertcondition(crossover(MAvg, PMax), title="1- Alım Sinyali", message="{{ticker}}, kapanış fiyatı = {{close}} için Alım Sinyali!")
alertcondition(crossunder(MAvg, PMax), title="2- Satım Sinyali", message="{{ticker}}, kapanış fiyatı = {{close}} için Satım Sinyali!")


buySignalk = filtrelemeacik ? filtreleme ? (crossover(MAvg, PMax) and T33>T3) : (crossover(MAvg, PMax) and src>T3): crossover(MAvg, PMax)


plotshape(buySignalk and showsignalsk ? PMax*0.995 : na, title="AL", text="AL", location=location.absolute, style=shape.labelup, size=size.tiny, color=color.green, textcolor=color.white, transp=0)
sellSignallk = crossunder(MAvg, PMax)
plotshape(sellSignallk and showsignalsk ? PMax*1.005 : na, title="Sat", text="SAT", location=location.absolute, style=shape.labeldown, size=size.tiny, color=color.red, textcolor=color.white, transp=0)
buySignalc = crossover(src, PMax)
plotshape(buySignalc and showsignalsc ? PMax*0.995 : na, title="AL-Fiyat", text="AL", location=location.absolute, style=shape.labelup, size=size.tiny, color=#0F18BF, textcolor=color.white, transp=0)
sellSignallc = crossunder(src, PMax)
plotshape(sellSignallc and showsignalsc ? PMax*1.005 : na, title="Sat-Fiyat", text="SAT", location=location.absolute, style=shape.labeldown, size=size.tiny, color=#0F18BF, textcolor=color.white, transp=0)
mPlot = plot(ohlc4, title="", style=plot.style_circles, linewidth=0,display=display.none)
longFillColor = highlighting ? (MAvg>PMax ? color.green : na) : na
shortFillColor = highlighting ? (MAvg<PMax ? color.red : na) : na
fill(mPlot, pALL, title="Yükseliş Trend Bulutu", color=longFillColor)
fill(mPlot, pALL, title="Düşüş Trend Bulutu", color=shortFillColor)


tplevel = 0
//tplevel := tp1 ? nz(tplevel[1])==0 ? 1 : nz(tplevel[1])==1 ? 2 : 0 : nz(tplevel[1])==0 ? 0 : nz(tplevel[1])==1 ? 1 : nz(tplevel[1])==2 ? 2 : sellSignallk ? 0 : 0
//tplevel := sellSignallk or MAvg < PMax ? 0 : tp1 and nz(tplevel[1])==8 ? 9 : tp1 and nz(tplevel[1])==7 ? 8 : tp1 and nz(tplevel[1])==6 ? 7 : tp1 and nz(tplevel[1])==5 ? 6 : tp1 and nz(tplevel[1])==4 ? 5 : tp1 and nz(tplevel[1])==3 ? 4 : tp1 and nz(tplevel[1])==2 ? 3 : tp1 and nz(tplevel[1])==1 ? 2 : nz(tplevel[1])==1 ? 1 : nz(tplevel[1])==2 ? 2 : nz(tplevel[1])==3 ? 3 : nz(tplevel[1])==4 ? 4 : nz(tplevel[1])==5 ? 5 : nz(tplevel[1])==6 ? 6 : nz(tplevel[1])==7 ? 7 : nz(tplevel[1])==8 ? 8 : nz(tplevel[1])==9 ? 9 : 1
tplevel := sellSignallk or MAvg < PMax ? 0 : Trail1 < Trail2 ? 0 : tp1 and nz(tplevel[1])==1 ? 2 : nz(tplevel[1])==1 ? 1 : nz(tplevel[1])==2 ? 2 : 1

exitlevel = 0

exitlevel := sellSignallk or MAvg < PMax ? 0 : Sell and  nz(tplevel[1])==2 and nz(exitlevel[1])==1 ? 2 : Sell and  nz(tplevel[1])==2 and nz(exitlevel[1])==2 ? 3 : Sell and  nz(tplevel[1])==2 and nz(exitlevel[1])==3 ? 4 :  Sell and  nz(tplevel[1])==2 and nz(exitlevel[1])==4 ? 5: nz(exitlevel[1])==1 ? 1  : nz(exitlevel[1])==2 ? 2 : nz(exitlevel[1])==3 ? 3 : nz(exitlevel[1])==4 ? 4 : nz(exitlevel[1])==5 ? 5:  1

plotchar(tplevel==0 and tplevelshow, char='0', color=color.green)
plotchar(tplevel==1 and tplevelshow , char='1', color=color.green)
plotchar(tplevel==2 and tplevelshow, char='2', color=color.green)


plotshape(exitlevel==0 and tplevelshow , text='0', location=location.belowbar, style=shape.triangledown, color=color.red)
plotshape(exitlevel==1 and tplevelshow , text='1', location=location.belowbar, style=shape.triangledown, color=color.red)
plotshape(exitlevel==2 and tplevelshow , text='2', location=location.belowbar, style=shape.triangledown, color=color.red)
plotshape(exitlevel==3 and tplevelshow , text='3', location=location.belowbar, style=shape.triangledown, color=color.red)
plotshape(exitlevel==4 and tplevelshow , text='4', location=location.belowbar, style=shape.triangledown, color=color.red)
plotshape(exitlevel==5 and tplevelshow , text='5', location=location.belowbar, style=shape.triangledown, color=color.red)

plotshape(nz(tplevel[1])==2 and Sell and exitlevel>=2, title="TP", text="TP", location=location.abovebar, style=shape.labeldown, size=size.tiny, color=color.lime, textcolor=color.white,transp=0)

if (buySignalk)
    strategy.entry("Buy", strategy.long)

if nz(tplevel[1])==2 and Sell and exitlevel==2
    strategy.exit ("Exit1", from_entry="Buy", limit=close, qty_percent = 33.3)

//if nz(tplevel[1])==2 and Sell and exitlevel==3
  //  strategy.exit ("Exit2", from_entry="Buy", limit=close, qty_percent = 33.3)

if nz(tplevel[1])==2 and Sell and exitlevel==3
    strategy.exit ("Exit2", from_entry="Buy", limit=close, qty_percent = 50)

if nz(tplevel[1])==2 and Sell and exitlevel==4
    strategy.exit ("Exit3", from_entry="Buy", limit=close)


if (sellSignallk)
    strategy.close_all()