Estratégia de acompanhamento de tendências com base em EMA e stop loss de ATR

Visão geral
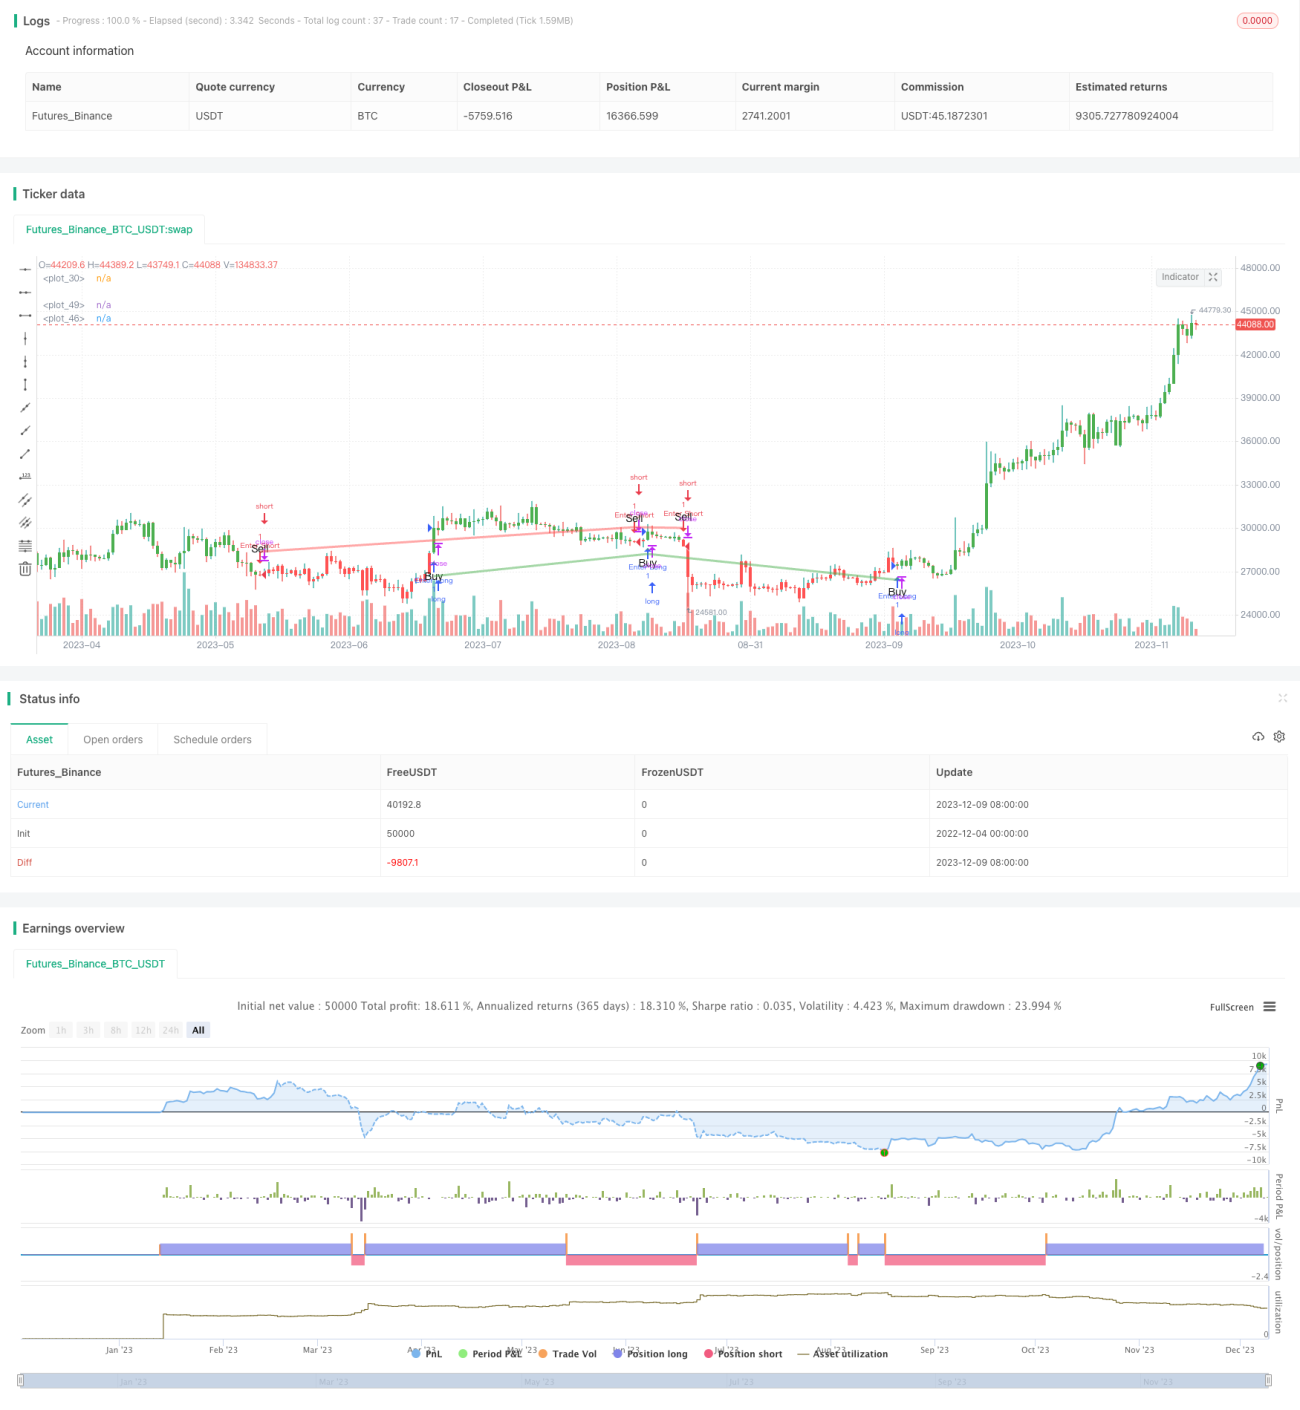
A estratégia usa a linha de golden cross da EMA para gerar um sinal de negociação, ou seja, um sinal de compra quando a linha de EMA rápida atravessa a linha de EMA lenta e um sinal de venda quando a linha de EMA rápida atravessa a linha de EMA lenta. A estratégia é uma estratégia típica de acompanhamento de tendências. Ao mesmo tempo, a estratégia usa o indicador ATR para definir um ponto de parada dinâmico e, ao mesmo tempo, controlar o risco para garantir o lucro.
Princípio da estratégia
- Define um ciclo médio de EMA rápido de 13, e um ciclo médio de EMA lento de 48.
- Quando a linha EMA rápida atravessa a linha EMA lenta, gera um sinal de compra; quando a linha EMA rápida atravessa a linha EMA lenta, gera um sinal de venda.
- A função ta.crossover e a função ta.crossunder determinam o forquilho linear uniforme.
- O ponto de parada dinâmico é calculado usando o indicador ATR, com um ponto de parada de cerca de 1,5 vezes o ATR.
- A visualização de sinais de negociação e de stop loss através de mudanças de cores, sinais de compra e venda e linhas de stop loss.
Análise de vantagens estratégicas
- O Gold Fork Dead Fork, baseado na linha média da EMA, gera sinais para evitar perder as principais tendências do mercado, com ganhos consideráveis.
- O ATR Dynamic Tracking Stop Loss garante um bom lucro de corrida, mas também controla o risco de retração, e o risco-benefício geral é mais equilibrado.
- O indicador de sinais e o indicador de travamento são intuitivos, fáceis de usar e adequados para a maioria das pessoas.
- Os parâmetros ajustáveis são menos e são mais fáceis de aprender e de otimizar.
Análise de risco estratégico
- A queda de preços provocada por um evento inesperado pode desencadear uma parada.
- Os sinais de invalidez podem ser frequentes em situações de tremores.
- A configuração inadequada dos parâmetros pode levar a uma entrada de campo excessivamente intensa ou a uma perda de campo excessivamente relaxada.
- Optimizar adequadamente os parâmetros EMA e ATR.
Solução:
- A flexibilidade apropriada no ATR pode garantir uma certa amortização do stop loss em relação ao pico mais recente.
- Pode-se considerar um mecanismo de confirmação após o surgimento do sinal, como o pico anterior à ruptura do preço.
- Recomenda-se que a otimização de parâmetros leve em consideração várias situações de mercado.
Direção de otimização da estratégia
- É possível testar diferentes combinações de parâmetros para encontrar o melhor.
- Pode-se considerar a inclusão de outros indicadores para filtragem de sinal, como indicadores de volume de transação, indicadores de taxa de flutuação, etc., para melhorar a qualidade do sinal.
- Os parâmetros do EMA podem ser ajustados de acordo com as tendências de grande escala para capturar melhor as principais tendências.
- Pode-se considerar a possibilidade de ajustar dinamicamente o multiplicador de stop loss do ATR, ampliando o alcance do stop loss em situações de tendência.
- Pode ser combinado com algoritmos de aprendizado de máquina para se adaptar a parâmetros de otimização.
Resumir
A estratégia em geral é mais simples e fácil de usar, com base em EMA, gerando sinais, além de ser complementada com o indicador ATR para rastrear o stop loss, o que pode ser eficaz para controlar o risco. Embora haja algum sinal falso, a capacidade de capturar as principais tendências é forte, os rendimentos são mais estáveis e são adequados como uma das estratégias básicas de negociação quantitativa.
/*backtest
start: 2022-12-04 00:00:00
end: 2023-12-10 00:00:00
period: 1d
basePeriod: 1h
exchanges: [{"eid":"Futures_Binance","currency":"BTC_USDT"}]
*/

// This source code is subject to the terms of the Mozilla Public License 2.0 at https://mozilla.org/MPL/2.0/
// © byee322

/// This strategy uses the EMA to generate buy and sell signals with a 1.5x ATR stop loss- 1