Estratégia de negociação quantitativa baseada na reversão do pivô


Data de criação: 2023-12-12 11:07:46 última modificação: 2023-12-12 11:07:46
cópia: 0 Cliques: 724
1
focar em
1621
Seguidores

Estratégia de negociação quantitativa baseada na reversão do pivô

Visão geral

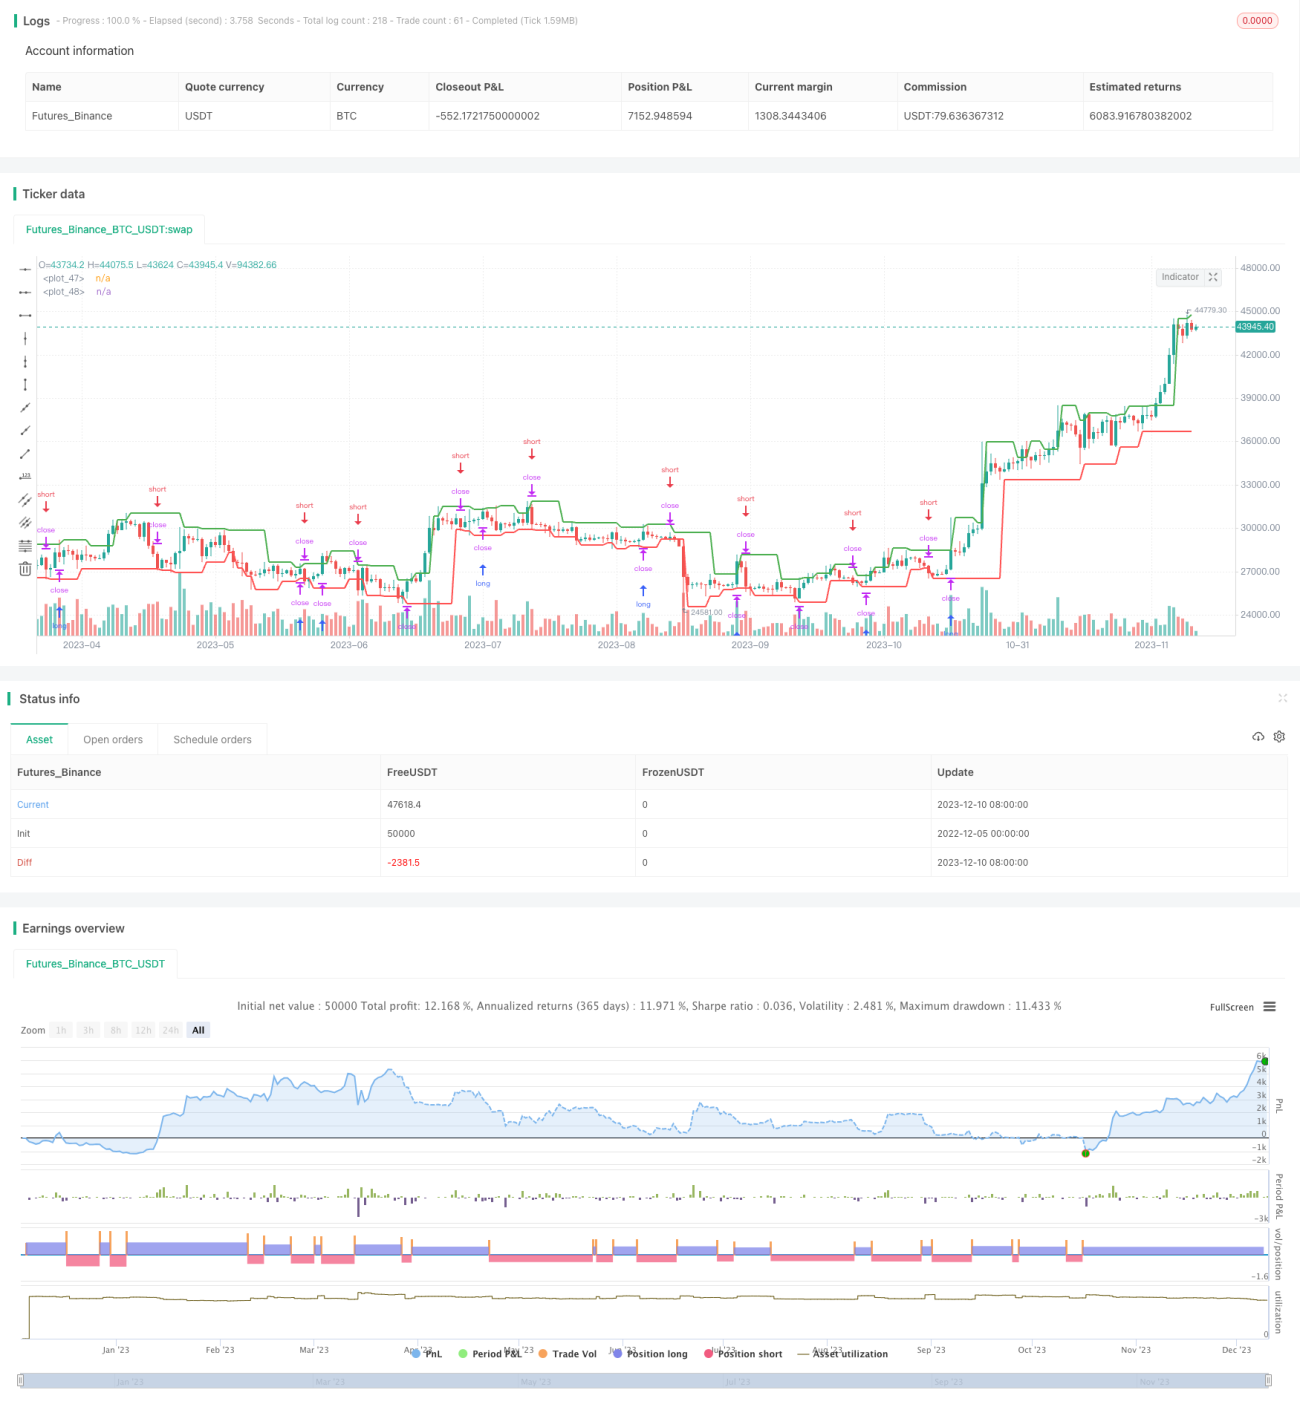
Esta é uma estratégia de negociação quantitativa que utiliza os pontos de apoio como sinal de entrada. Calcula os pontos de apoio ascendentes e descendentes e inicia posições longas ou curtas assim que o preço os ultrapassa.

Princípio da estratégia

A estratégia baseia-se principalmente na teoria da inversão dos pontos de apoio. Primeiro, calcula os pontos de apoio da linha K da raiz N à esquerda e da linha K da raiz M à direita.

Quando o preço quebra o suporte de subida, a força de ranchang já não é suficiente para continuar a elevar o preço, então o shorting pode obter melhores ganhos. Quando o preço quebra o suporte de queda, a força aérea está esgotada, então fazer mais pode obter melhores ganhos.

Concretamente, a estratégia calcula os pontos de apoio de alta e baixa através das funções ta.pivothigh e ta.pivotlow. Em seguida, compara se o preço mais alto atual quebrou o ponto de apoio de alta e o preço mais baixo quebrou o ponto de apoio de baixa. Se for quebrado, inicie a estratégia de fazer mais curto correspondente.

Além disso, a estratégia também usa o stop loss para controlar o risco. A prática específica é, quando o preço quebra o ponto de apoio, imediatamente pedir, ao mesmo tempo em que o stop loss está localizado do outro lado do ponto de apoio, para evitar o máximo possível a expansão dos perdas causadas pelo single falho.

Análise de vantagens

A estratégia baseada na inversão dos pontos de apoio tem as seguintes vantagens:

  1. O sinal de inversão do ponto de apoio é mais confiável e tem maior taxa de vitória
  2. Controle de risco, parâmetros de stop loss razoáveis
  3. Fácil de implementar, código simples
  4. Adaptável a diferentes variedades, com maior flexibilidade

Análise de Riscos

A estratégia também apresenta alguns riscos que devem ser lembrados:

  1. Ponto de apoio pode falhar, causando sinais errados
  2. A retardação pode ocorrer após a ruptura do ponto de apoio, causando o disparo do ponto de parada
  3. A frequência de transações pode ser alta, e as taxas de transação são um custo oculto.
  4. Efeitos relacionados com a variedade, configuração de parâmetros e necessidade de ajustes

Para reduzir o risco, considere:

  1. Optimizar o número de linhas K no lado direito e direito para garantir que o cálculo do ponto de apoio seja mais confiável
  2. Limpar adequadamente o limiar de perda para evitar perda excessiva
  3. Estabeleça metas de lucro mínimo para reduzir o número de transações repetidas
  4. Teste diferentes variedades e parâmetros para encontrar a melhor configuração

Direção de otimização

A estratégia ainda tem espaço para ser melhorada:

  1. Reliabilidade de ruptura de ponto de apoio em combinação com outros indicadores
  2. Adição de modelos de aprendizagem de máquina para determinar tendências de preços
  3. Utilização de dados de alta frequência para melhorar a sensibilidade dos sinais de transação
  4. Adição de módulo de gerenciamento de posições para ajustar posições de forma dinâmica de acordo com as condições
  5. Acesso ao módulo de contas detalhadas para calcular as taxas de transação reais

Essas otimizações podem melhorar a taxa de vitória, o nível de lucro e a estabilidade da estratégia.

Resumir

Resumindo, trata-se de uma estratégia de negociação quantitativa baseada na teoria do ponto de inflexão. Utiliza o ponto de inflexão do preço como sinal de negociação e controla o risco com o uso de um mecanismo de parada. A estratégia é fácil de implementar, de ampla aplicação e é uma estratégia de negociação quantitativa prática.

Código-fonte da estratégia
/*backtest
start: 2022-12-05 00:00:00
end: 2023-12-11 00:00:00
period: 1d
basePeriod: 1h
exchanges: [{"eid":"Futures_Binance","currency":"BTC_USDT"}]
*/

//@version=5
strategy('Weekly Returns with Benchmark', overlay=true, 
     default_qty_type=strategy.percent_of_equity, default_qty_value=25, 
     commission_type=strategy.commission.percent, commission_value=0.1)

////////////
// Inputs //

// Pivot points inputs
leftBars   = input(2, group = "Pivot Points")
rightBars  = input(1, group = "Pivot Points")

// Styling inputs
prec       = input(1, title='Return Precision',                            group = "Weekly Table")
from_date  = input(timestamp("01 Jan 3000 00:00 +0000"), "From Date", group = "Weekhly Table")
prof_color = input.color(color.green, title = "Gradient Colors", group = "Weeky Table", inline = "colors")
loss_color = input.color(color.red,   title = "",                group = "Weeky Table", inline = "colors")

// Benchmark inputs
use_cur    = input.bool(true,        title = "Use current Symbol for Benchmark", group = "Benchmark")
symb_bench = input('BTC_USDT:swap', title = "Benchmark",                        group = "Benchmark")
disp_bench = input.bool(false,       title = "Display Benchmark?",               group = "Benchmark")
disp_alpha = input.bool(false,       title = "Display Alpha?",                   group = "Benchmark")

// Pivot Points Strategy
swh = ta.pivothigh(leftBars, rightBars)
swl = ta.pivotlow (leftBars, rightBars)

hprice = 0.0
hprice := not na(swh) ? swh : hprice[1]

lprice = 0.0
lprice := not na(swl) ? swl : lprice[1]

le = false
le := not na(swh) ? true : le[1] and high > hprice ? false : le[1]

se = false
se := not na(swl) ? true : se[1] and low < lprice ? false : se[1]

if le
    strategy.entry('PivRevLE', strategy.long, comment='PivRevLE', stop=hprice + syminfo.mintick)

if se
    strategy.entry('PivRevSE', strategy.short, comment='PivRevSE', stop=lprice - syminfo.mintick)

plot(hprice, color=color.new(color.green, 0), linewidth=2)
plot(lprice, color=color.new(color.red, 0), linewidth=2)


///////////////////
// WEEKLY TABLE //

new_week = weekofyear(time[1]) != weekofyear(time)
new_year = year(time) != year(time[1])

eq       = strategy.equity
bench_eq = close

// benchmark eq
bench_eq_htf = request.security(symb_bench, timeframe.period, close)

if (not use_cur)
    bench_eq := bench_eq_htf

bar_pnl   = eq / eq[1] - 1
bench_pnl = bench_eq / bench_eq[1] - 1


// Current Weekly P&L
cur_week_pnl  = 0.0
cur_week_pnl := bar_index == 0 ? 0 : 
                 time >= from_date and (time[1] < from_date or new_week) ? bar_pnl : 
                 (1 + cur_week_pnl[1]) * (1 + bar_pnl) - 1

// Current Yearly P&L
cur_year_pnl  = 0.0
cur_year_pnl := bar_index == 0 ? 0 : 
                 time >= from_date and (time[1] < from_date or new_year) ? bar_pnl : 
                 (1 + cur_year_pnl[1]) * (1 + bar_pnl) - 1


// Current Weekly P&L - Bench
bench_cur_week_pnl  = 0.0
bench_cur_week_pnl := bar_index == 0 or (time[1] < from_date and time >= from_date) ? 0 : 
                       time >= from_date and new_week ? bench_pnl : 
                       (1 + bench_cur_week_pnl[1]) * (1 + bench_pnl) - 1 

// Current Yearly P&L - Bench
bench_cur_year_pnl  = 0.0
bench_cur_year_pnl := bar_index == 0 ? 0 : 
                       time >= from_date and (time[1] < from_date  or new_year) ? bench_pnl : 
                       (1 + bench_cur_year_pnl[1]) * (1 + bench_pnl) - 1


var week_time = array.new_int(0)
var year_time = array.new_int(0)

var week_pnl = array.new_float(0)
var year_pnl = array.new_float(0)

var bench_week_pnl = array.new_float(0)
var bench_year_pnl = array.new_float(0)


// Filling weekly / yearly pnl arrays
if array.size(week_time) > 0
    if weekofyear(time) == weekofyear(array.get(week_time, array.size(week_time) - 1))
        array.pop(week_pnl)
        array.pop(bench_week_pnl)
        array.pop(week_time)


if array.size(year_time) > 0
    if year(time) == year(array.get(year_time, array.size(year_time) - 1))
        array.pop(year_pnl)
        array.pop(bench_year_pnl)
        array.pop(year_time)


if (time >= from_date)
    array.push(week_time, time)
    array.push(year_time, time)
    
    array.push(week_pnl, cur_week_pnl)
    array.push(year_pnl, cur_year_pnl)
    
    array.push(bench_year_pnl, bench_cur_year_pnl)
    array.push(bench_week_pnl, bench_cur_week_pnl)


// Weekly P&L Table  

table_size = size.tiny
var weekly_table = table(na)

if array.size(year_pnl) > 0 and barstate.islastconfirmedhistory

    weekly_table := table.new(position.bottom_right, 
                 columns=56, rows=array.size(year_pnl) * 3 + 5, border_width=1)

// Fill weekly performance
    table.cell(weekly_table, 0, 0,  'Perf', 
                 bgcolor = #999999, text_size= table_size)


    for numW = 1 to 53 by 1
        table.cell(weekly_table, numW, 0,  str.tostring(numW), 
                 bgcolor= #999999, text_size= table_size)


    table.cell(weekly_table, 54, 0, ' ',    
                 bgcolor = #999999, text_size= table_size)
    table.cell(weekly_table, 55, 0, 'Year', 
                 bgcolor = #999999, text_size= table_size)

    max_abs_y = math.max(math.abs(array.max(year_pnl)), math.abs(array.min(year_pnl)))
    max_abs_m = math.max(math.abs(array.max(week_pnl)), math.abs(array.min(week_pnl)))

    
    for yi = 0 to array.size(year_pnl) - 1 by 1
        table.cell(weekly_table, 0,  yi + 1,
                 str.tostring(year(array.get(year_time, yi))), 
                 bgcolor=#cccccc, text_size=table_size)
                 
        table.cell(weekly_table, 53, yi + 1, ' ',   
                 bgcolor=#999999, text_size=table_size)
                 
        table.cell(weekly_table, 54, yi + 1, ' ',   
                 bgcolor=#999999, text_size=table_size)

        y_color = color.from_gradient(array.get(year_pnl, yi), -max_abs_y, max_abs_y, loss_color, prof_color) 

        table.cell(weekly_table, 55, yi + 1, 
                 str.tostring(math.round(array.get(year_pnl, yi) * 100, prec)), 
                 bgcolor=y_color, text_size=table_size)
    
    int iw_row= na
    int iw_col= na

    for wi = 0 to array.size(week_time) - 2 by 1
        w_row   = year(array.get(week_time, wi)) - year(array.get(year_time, 0)) + 1
        w_col   = weekofyear(array.get(week_time, wi))

        w_color = color.from_gradient(array.get(week_pnl, wi), -max_abs_m, max_abs_m, loss_color, prof_color)
        
        if iw_row + 1 == w_row and iw_col + 1 == w_col
            table.cell(weekly_table, w_col, w_row-1,
                 str.tostring(math.round(array.get(week_pnl, wi) * 100, prec)), 
                 bgcolor=w_color, text_size=table_size)
        else
            table.cell(weekly_table, w_col, w_row,
                 str.tostring(math.round(array.get(week_pnl, wi) * 100, prec)), 
                 bgcolor=w_color, text_size=table_size)
        
        
        iw_row:= w_row
        iw_col:= w_col


    // Fill benchmark performance
    next_row =  array.size(year_pnl) + 1  

    if (disp_bench)
    
        table.cell(weekly_table, 0,  next_row, 'Bench', 
                 bgcolor=#999999, text_size=table_size)
        
        for numW = 1 to 53 by 1
            table.cell(weekly_table, numW, next_row,  str.tostring(numW), 
                 bgcolor= #999999, text_size= table_size)

        table.cell(weekly_table, 54, next_row, ' '   ,   
                 bgcolor = #999999, text_size=table_size)
        table.cell(weekly_table, 55, next_row, 'Year',   
                 bgcolor = #999999, text_size=table_size)
    
        max_bench_abs_y = math.max(math.abs(array.max(bench_year_pnl)), math.abs(array.min(bench_year_pnl)))
        max_bench_abs_w = math.max(math.abs(array.max(bench_week_pnl)), math.abs(array.min(bench_week_pnl)))
    
        for yi = 0 to array.size(year_time) - 1 by 1
            table.cell(weekly_table, 0,  yi + 1 + next_row + 1, 
                 str.tostring(year(array.get(year_time, yi))), 
                 bgcolor=#cccccc, text_size=table_size)

            table.cell(weekly_table, 53, yi + 1 + next_row + 1, ' ',   
                 bgcolor=#999999, text_size=table_size)
            
            table.cell(weekly_table, 54, yi + 1 + next_row + 1, ' ', 
                 bgcolor=#999999, text_size=table_size)
                 
            y_color = color.from_gradient(array.get(bench_year_pnl, yi), -max_bench_abs_y, max_bench_abs_y, loss_color, prof_color)
            table.cell(weekly_table, 55, yi + 1 + next_row + 1, 
                 str.tostring(math.round(array.get(bench_year_pnl, yi) * 100, prec)), 
                 bgcolor=y_color, text_size=table_size)
     
    
        int iw_row1= na
        int iw_col1= na

        for wi = 0 to array.size(week_time) - 1 by 1
            w_row   = year(array.get(week_time, wi)) - year(array.get(year_time, 0)) + 1
            w_col   = weekofyear(array.get(week_time, wi))
        
            w_color = color.from_gradient(array.get(bench_week_pnl, wi), -max_bench_abs_w, max_bench_abs_w, loss_color, prof_color)
    
            if iw_row1 + 1 == w_row and iw_col1 + 1 == w_col
                table.cell(weekly_table, w_col, w_row  + next_row    , 
                 str.tostring(math.round(array.get(bench_week_pnl, wi) * 100, prec)),
                 bgcolor=w_color, text_size=table_size)
            else
                table.cell(weekly_table, w_col, w_row  + next_row + 1, 
                 str.tostring(math.round(array.get(bench_week_pnl, wi) * 100, prec)), 
                 bgcolor=w_color, text_size=table_size)
                
            iw_row1:= w_row
            iw_col1:= w_col
    
    
// Fill Alpha
    if (disp_alpha)
    
        // columns
        next_row :=  array.size(year_pnl) * 2 + 3   
        table.cell(weekly_table, 0,  next_row, 'Alpha', 
                 bgcolor=#999999, text_size= table_size)


        for numW = 1 to 53 by 1
            table.cell(weekly_table, numW, next_row,  str.tostring(numW), 
                 bgcolor= #999999, text_size= table_size)


        table.cell(weekly_table, 54, next_row, ' '   ,  
                 bgcolor=#999999, text_size= table_size)
        table.cell(weekly_table, 55, next_row, 'Year',  
                 bgcolor=#999999, text_size= table_size)


        max_alpha_abs_y = 0.0
        for yi = 0 to array.size(year_time) - 1 by 1
            if (math.abs(array.get(year_pnl, yi)  - array.get(bench_year_pnl, yi)) > max_alpha_abs_y)
                max_alpha_abs_y := math.abs(array.get(year_pnl, yi)  - array.get(bench_year_pnl, yi))
    
        max_alpha_abs_w = 0.0
        for wi = 0 to array.size(week_pnl) - 1 by 1
            if (math.abs(array.get(week_pnl, wi) - array.get(bench_week_pnl, wi)) > max_alpha_abs_w)
                max_alpha_abs_w := math.abs(array.get(week_pnl, wi) - array.get(bench_week_pnl, wi))
    
    
        for yi = 0 to array.size(year_time) - 1 by 1
            table.cell(weekly_table, 0,  yi + 1 + next_row + 1, 
                 str.tostring(year(array.get(year_time, yi))), 
                 bgcolor=#cccccc, text_size= table_size)
                 
            table.cell(weekly_table, 53, yi + 1 + next_row + 1, ' ',   
                 bgcolor=#999999, text_size= table_size)
                 
            table.cell(weekly_table, 54, yi + 1 + next_row + 1, ' ',   
                 bgcolor=#999999, text_size= table_size)

            y_color = color.from_gradient(array.get(year_pnl, yi)  - array.get(bench_year_pnl, yi), -max_alpha_abs_y, max_alpha_abs_y, loss_color, prof_color)
            table.cell(weekly_table, 55, yi + 1 + next_row + 1,
                 str.tostring(math.round((array.get(year_pnl, yi)  - array.get(bench_year_pnl, yi)) * 100, prec)), 
                 bgcolor=y_color, text_size= table_size)
     
     
        int iw_row2= na
        int iw_col2= na
        
        for wi = 0 to array.size(week_time) - 1 by 1
            w_row   = year(array.get(week_time, wi)) - year(array.get(year_time, 0)) + 1
            w_col   = weekofyear(array.get(week_time, wi))
            w_color = color.from_gradient(array.get(week_pnl, wi) - array.get(bench_week_pnl, wi), -max_alpha_abs_w, max_alpha_abs_w, loss_color, prof_color)
    
            if iw_row2 + 1 == w_row and iw_col2 + 1 == w_col
                table.cell(weekly_table, w_col, w_row  + next_row , 
                     str.tostring(math.round((array.get(week_pnl, wi) - array.get(bench_week_pnl, wi)) * 100, prec)), 
                     bgcolor=w_color, text_size= table_size)
            else
                table.cell(weekly_table, w_col, w_row  + next_row + 1 , 
                     str.tostring(math.round((array.get(week_pnl, wi) - array.get(bench_week_pnl, wi)) * 100, prec)), 
                     bgcolor=w_color, text_size= table_size)
        
            iw_row2:= w_row
            iw_col2:= w_col