Estratégias de negociação baseadas em tendências de ondas

Visão geral
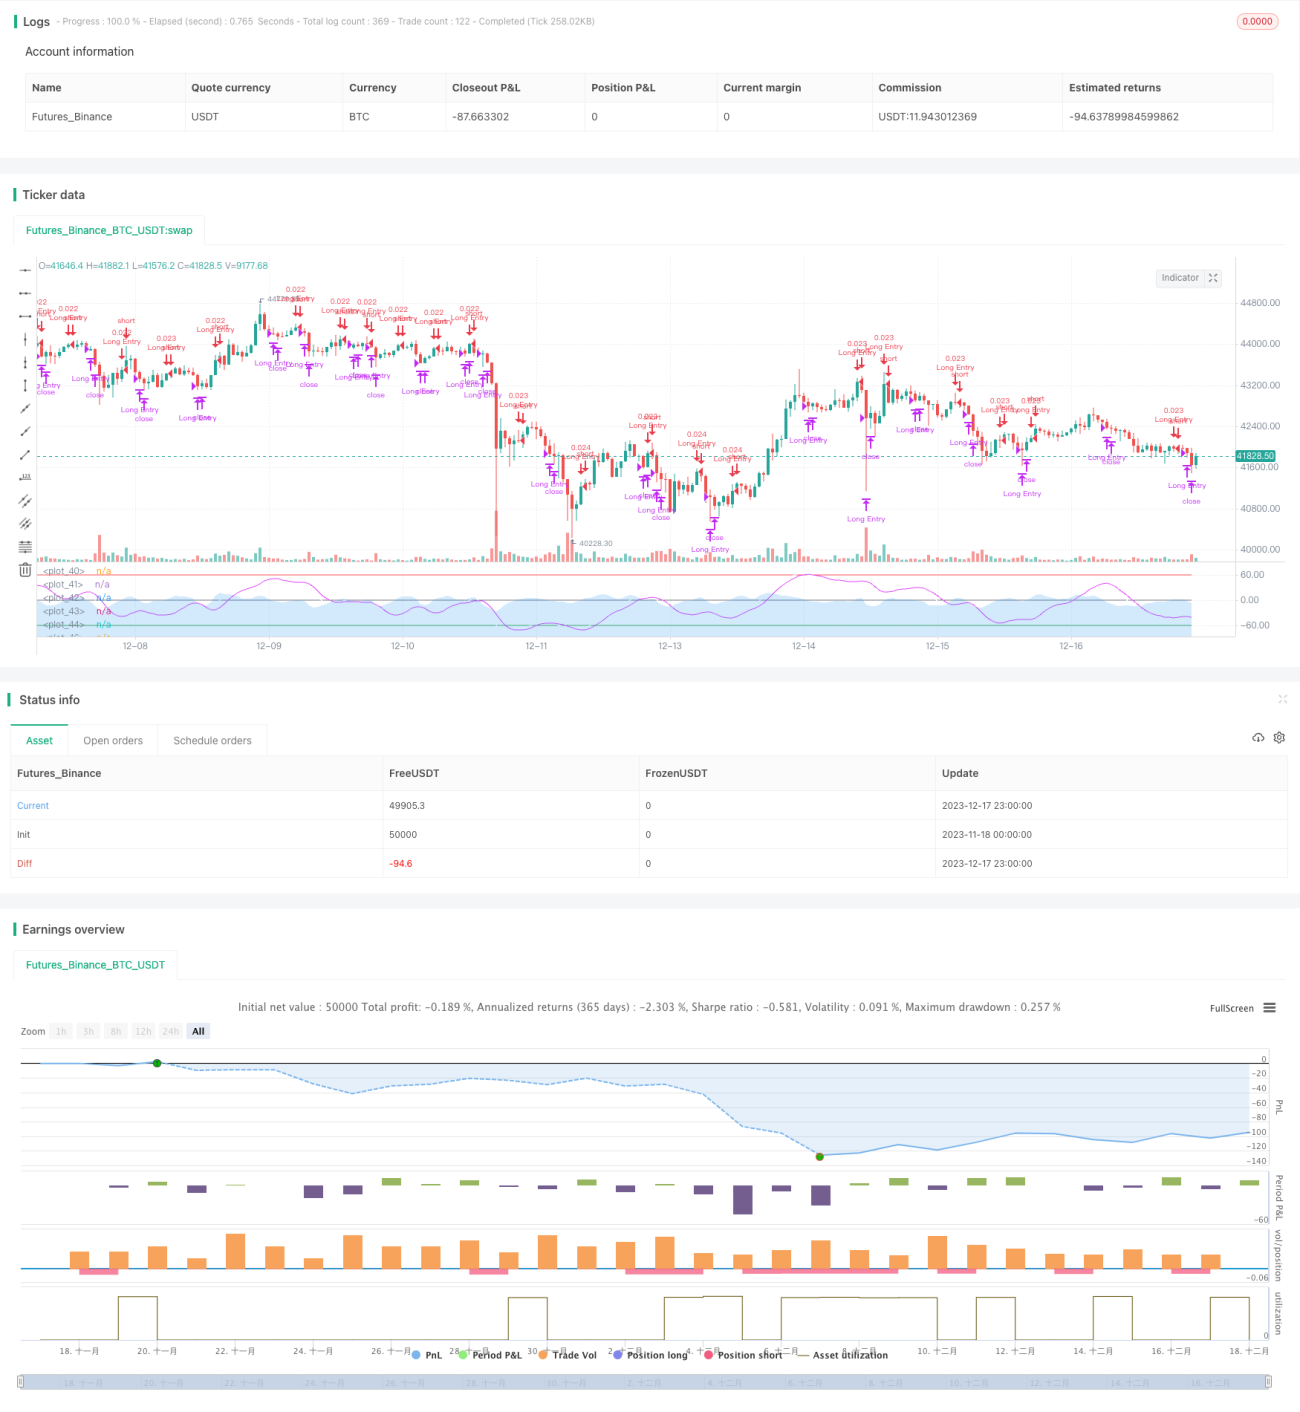
Esta é uma estratégia de negociação baseada no indicador de tendências de ondas do LazyBear. A estratégia de negociação baseia-se na tendência de ondas de fluctuantes de preços, julgando sobrecompra e sobrevenda no mercado, longing e shorting.
Princípio da estratégia
A estratégia é baseada principalmente no indicador de tendência de ondas do LazyBear. Primeiro, calcula-se o preço médio ((AP)), depois a média móvel indexada ((ESA) do AP e a média móvel indexada da mudança de preço absoluta ((D)). Com base nisso, calcula-se o índice de flutuação ((CI)), e depois a média móvel indexada do CI, obtendo a linha de tendência de ondas ((WT)). A WT gera WT1 e WT2 através de uma média móvel simples.
Análise de vantagens
Esta é uma estratégia de acompanhamento de tendências muito simples, mas muito prática. Tem as seguintes vantagens:
- Indicadores de tendências de ondas, que permitem identificar claramente tendências de preços e sentimentos de mercado
- A operação é simples, com a cruz de ouro e a cruz de morte do WT para julgar o ponto de fazer e fazer
- Parâmetros personalizáveis ajustam a sensibilidade do fio WT para diferentes períodos
- Pode ser adicionado um sinal de filtragem condicional adicional, como uma janela de tempo de negociação limitada
Análise de Riscos
A estratégia também apresenta alguns riscos:
- Como uma estratégia de acompanhamento de tendências, é fácil gerar uma grande quantidade de sinais errôneos em mercados consolidados.
- O WT-line é muito atrasado e pode perder o ponto de viragem rápido dos preços.
- Os parâmetros padrão podem não ser adequados para todas as variedades e períodos e precisam ser otimizados
- Não há um mecanismo de stop loss, o que pode levar muito tempo
Os principais soluções são:
- Parâmetros de otimização para ajustar a sensibilidade das linhas WT
- Adicionar outros indicadores para verificação e evitar sinais errados
- Configuração de stop loss e stop loss
- Limitar o número de transações ou posições por dia
Direção de otimização
A estratégia ainda tem espaço para ser melhorada:
- Optimizar os parâmetros do WT para torná-lo mais sensível ou mais estável
- Combinações de parâmetros diferentes com base em diferentes períodos
- Adição de indicadores de preço de quantidade, indicadores de taxa de flutuação, etc. como sinal de confirmação
- Adição de Stop Loss e Stop Stop Logic
- Enriquecimento de posições, tais como pirâmides, negociação de grades etc.
- Melhores características e regras de negociação com métodos como o aprendizado de máquina
Resumir
Esta estratégia é uma estratégia de acompanhamento de tendências de ondas muito simples e práticas. Ela emite um sinal de negociação usando o cruzamento do ouro com o cruzamento da morte no WT line, calculando a tendência de flutuação dos preços, identificando o estado de sobrecompra e sobrevenda do mercado.
- 1