Estratégia de negociação multi-timeframe baseada em indicador de volatilidade e indicador estocástico
Visão geral
Esta estratégia combina o indicador de volatilidade VIX e o indicador aleatório RSI, combinando indicadores de diferentes períodos de tempo, para alcançar uma posição de parada de perda de compra e venda excessiva de compra e venda excessiva. A estratégia tem um grande espaço de otimização e pode ser adaptada a diferentes condições de mercado.
Princípio da estratégia
Calcule o indicador de volatilidade VIX: leve os preços mais altos e mais baixos dos últimos 20 dias e calcule a volatilidade. Quando a volatilidade é superior à trajetória superior, indica pânico no mercado; Quando é inferior à trajetória inferior, indica complacência no mercado.
Calcule o indicador aleatório RSI: se o RSI estiver acima de 70 é uma zona de supera compra e se estiver abaixo de 30 é uma zona de supera venda.
A fusão de dois indicadores, fazendo mais quando a volatilidade é maior do que o percentual superior ou superior; e fazendo equilíbrio quando o RSI é superior a 70.
Vantagens estratégicas
- A integração de vários indicadores para avaliar o momento do mercado.
- Indicadores de diferentes períodos de tempo se verificam mutuamente, aumentando a precisão da tomada de decisão.
- Os parâmetros de ajuste podem ser otimizados para diferentes variedades de negociação.
Análise de Riscos
- A configuração incorreta dos parâmetros pode causar vários falsos sinais.
- O indicador de posição de equilíbrio simples é capaz de ignorar a reversão de preços.
Recomendações de otimização
- Adicionar mais indicadores de verificação, como a linha média, a faixa de brinquedo e outros, para determinar o tempo de entrada.
- Adicionar mais indicadores de equilíbrio, como a inversão da forma da linha K.
Resumir
Esta estratégia usa o indicador VIX para avaliar o momento e o nível de risco do mercado, em conjunto com o indicador RSI para filtrar os pontos de negociação desfavoráveis de sobrecompra e sobrevenda, para comprar e parar o prejuízo em momentos eficientes. A estratégia tem um grande espaço de otimização e pode ser adaptada a um ambiente de mercado mais amplo.
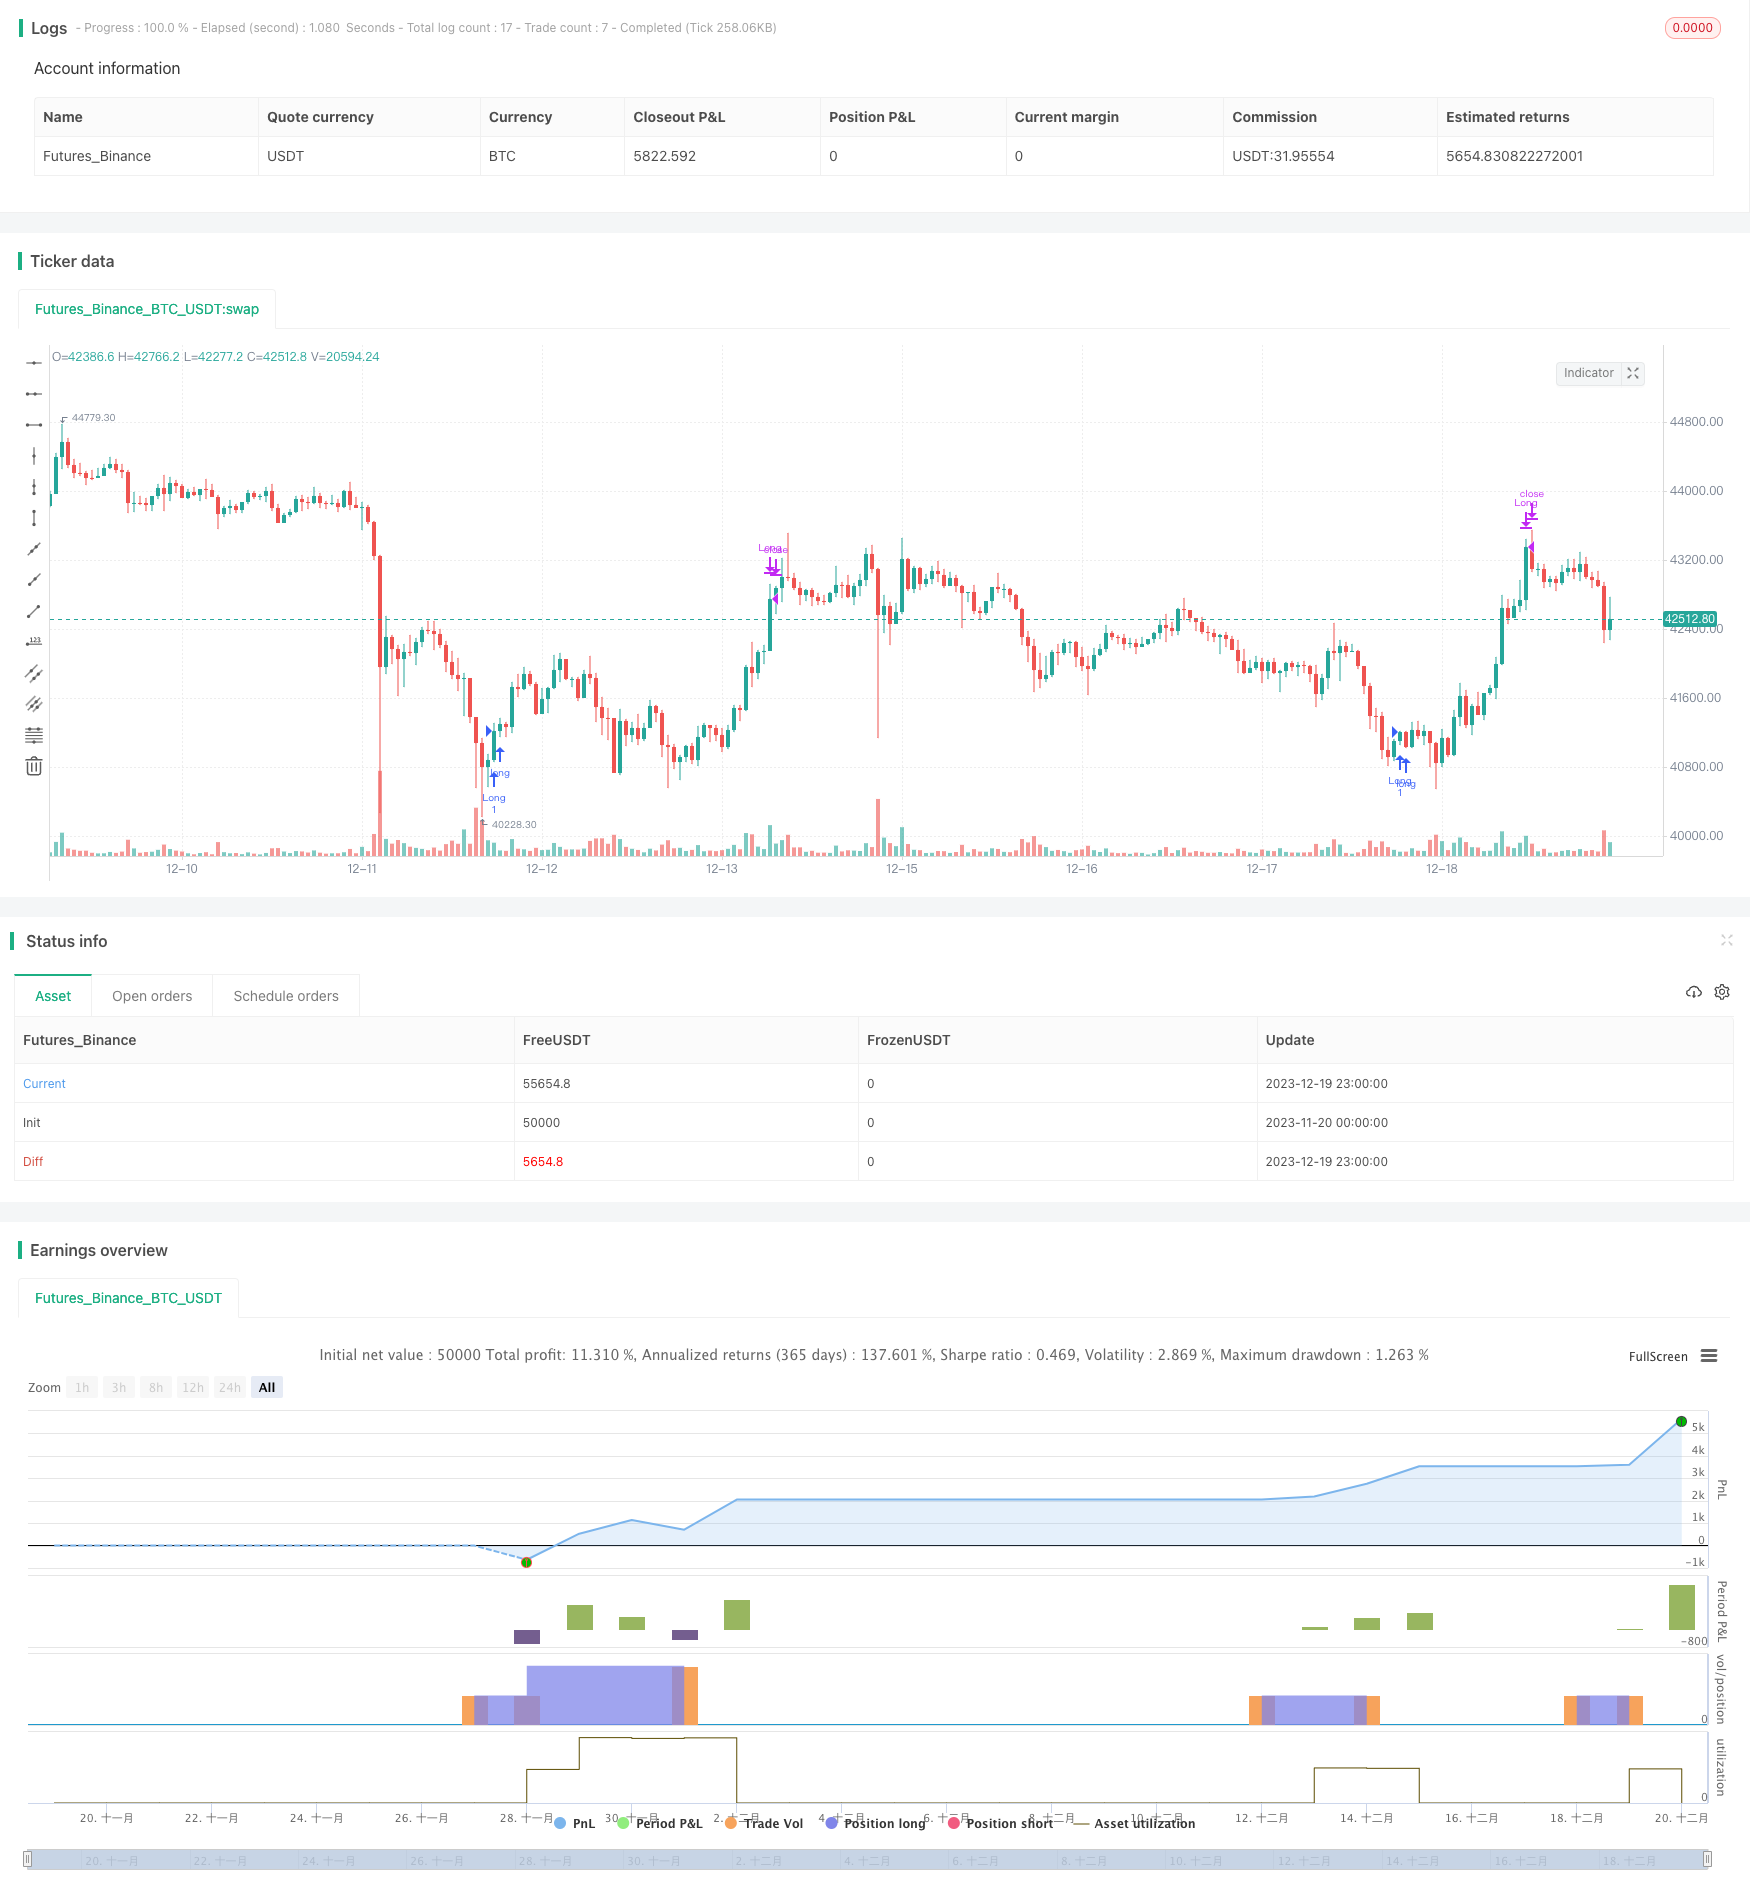
/*backtest
start: 2023-11-20 00:00:00
end: 2023-12-20 00:00:00
period: 1h
basePeriod: 15m
exchanges: [{"eid":"Futures_Binance","currency":"BTC_USDT"}]
*/

//@version=5
// This source code is subject to the terms of the Mozilla Public License 2.0 at https://mozilla.org/MPL/2.0/
// © timj

strategy('Vix FIX / StochRSI Strategy', overlay=true, pyramiding=9, margin_long=100, margin_short=100)

Stochlength = input.int(14, minval=1, title="lookback length of Stochastic")
StochOverBought = input.int(80, title="Stochastic overbought condition")
StochOverSold = input.int(20, title="Stochastic oversold condition")
smoothK = input(3, title="smoothing of Stochastic %K ")
smoothD = input(3, title="moving average of Stochastic %K")
k = ta.sma(ta.stoch(close, high, low, Stochlength), smoothK)
d = ta.sma(k, smoothD)

///////////// RSI
RSIlength = input.int( 14, minval=1 , title="lookback length of RSI")
RSIOverBought = input.int( 70  , title="RSI overbought condition")
RSIOverSold = input.int( 30  , title="RSI oversold condition")
RSIprice = close
vrsi = ta.rsi(RSIprice, RSIlength)

///////////// Double strategy: RSI strategy + Stochastic strategy

pd = input(22, title="LookBack Period Standard Deviation High")
bbl = input(20, title="Bolinger Band Length")
mult = input.float(2.0    , minval=1, maxval=5, title="Bollinger Band Standard Devaition Up")
lb = input(50  , title="Look Back Period Percentile High")
ph = input(.85, title="Highest Percentile - 0.90=90%, 0.95=95%, 0.99=99%")
new = input(false, title="-------Text Plots Below Use Original Criteria-------" )
sbc = input(false, title="Show Text Plot if WVF WAS True and IS Now False")
sbcc = input(false, title="Show Text Plot if WVF IS True")
new2 = input(false, title="-------Text Plots Below Use FILTERED Criteria-------" )
sbcFilt = input(true, title="Show Text Plot For Filtered Entry")
sbcAggr = input(true, title="Show Text Plot For AGGRESSIVE Filtered Entry")
ltLB = input.float(40, minval=25, maxval=99, title="Long-Term Look Back Current Bar Has To Close Below This Value OR Medium Term--Default=40")
mtLB = input.float(14, minval=10, maxval=20, title="Medium-Term Look Back Current Bar Has To Close Below This Value OR Long Term--Default=14")
str = input.int(3, minval=1, maxval=9, title="Entry Price Action Strength--Close > X Bars Back---Default=3")
//Alerts Instructions and Options Below...Inputs Tab
new4 = input(false, title="-------------------------Turn On/Off ALERTS Below---------------------" )
new5 = input(false, title="----To Activate Alerts You HAVE To Check The Boxes Below For Any Alert Criteria You Want----")
sa1 = input(false, title="Show Alert WVF = True?")
sa2 = input(false, title="Show Alert WVF Was True Now False?")
sa3 = input(false, title="Show Alert WVF Filtered?")
sa4 = input(false, title="Show Alert WVF AGGRESSIVE Filter?")

//Williams Vix Fix Formula
wvf = ((ta.highest(close, pd)-low)/(ta.highest(close, pd)))*100
sDev = mult * ta.stdev(wvf, bbl)
midLine = ta.sma(wvf, bbl)
lowerBand = midLine - sDev
upperBand = midLine + sDev
rangeHigh = (ta.highest(wvf, lb)) * ph

//Filtered Bar Criteria
upRange = low > low[1] and close > high[1]
upRange_Aggr = close > close[1] and close > open[1]
//Filtered Criteria
filtered = ((wvf[1] >= upperBand[1] or wvf[1] >= rangeHigh[1]) and (wvf < upperBand and wvf < rangeHigh))
filtered_Aggr = (wvf[1] >= upperBand[1] or wvf[1] >= rangeHigh[1]) and not (wvf < upperBand and wvf < rangeHigh)

//Alerts Criteria
alert1 = wvf >= upperBand or wvf >= rangeHigh ? 1 : 0
alert2 = (wvf[1] >= upperBand[1] or wvf[1] >= rangeHigh[1]) and (wvf < upperBand and wvf < rangeHigh) ? 1 : 0
alert3 = upRange and close > close[str] and (close < close[ltLB] or close < close[mtLB]) and filtered ? 1 : 0
alert4 = upRange_Aggr and close > close[str] and (close < close[ltLB] or close < close[mtLB]) and filtered_Aggr ? 1 : 0

//Coloring Criteria of Williams Vix Fix
col = wvf >= upperBand or wvf >= rangeHigh ? color.lime : color.gray

isOverBought = (ta.crossover(k,d) and k > StochOverBought) ? 1 : 0
isOverBoughtv2 = k > StochOverBought ? 1 : 0
filteredAlert = alert3 ? 1 : 0
aggressiveAlert = alert4 ? 1 : 0


if (filteredAlert or aggressiveAlert)
    strategy.entry("Long", strategy.long)

if (isOverBought)
    strategy.close("Long")