Estratégia de negociação do oscilador de momentum dinâmico
Visão geral
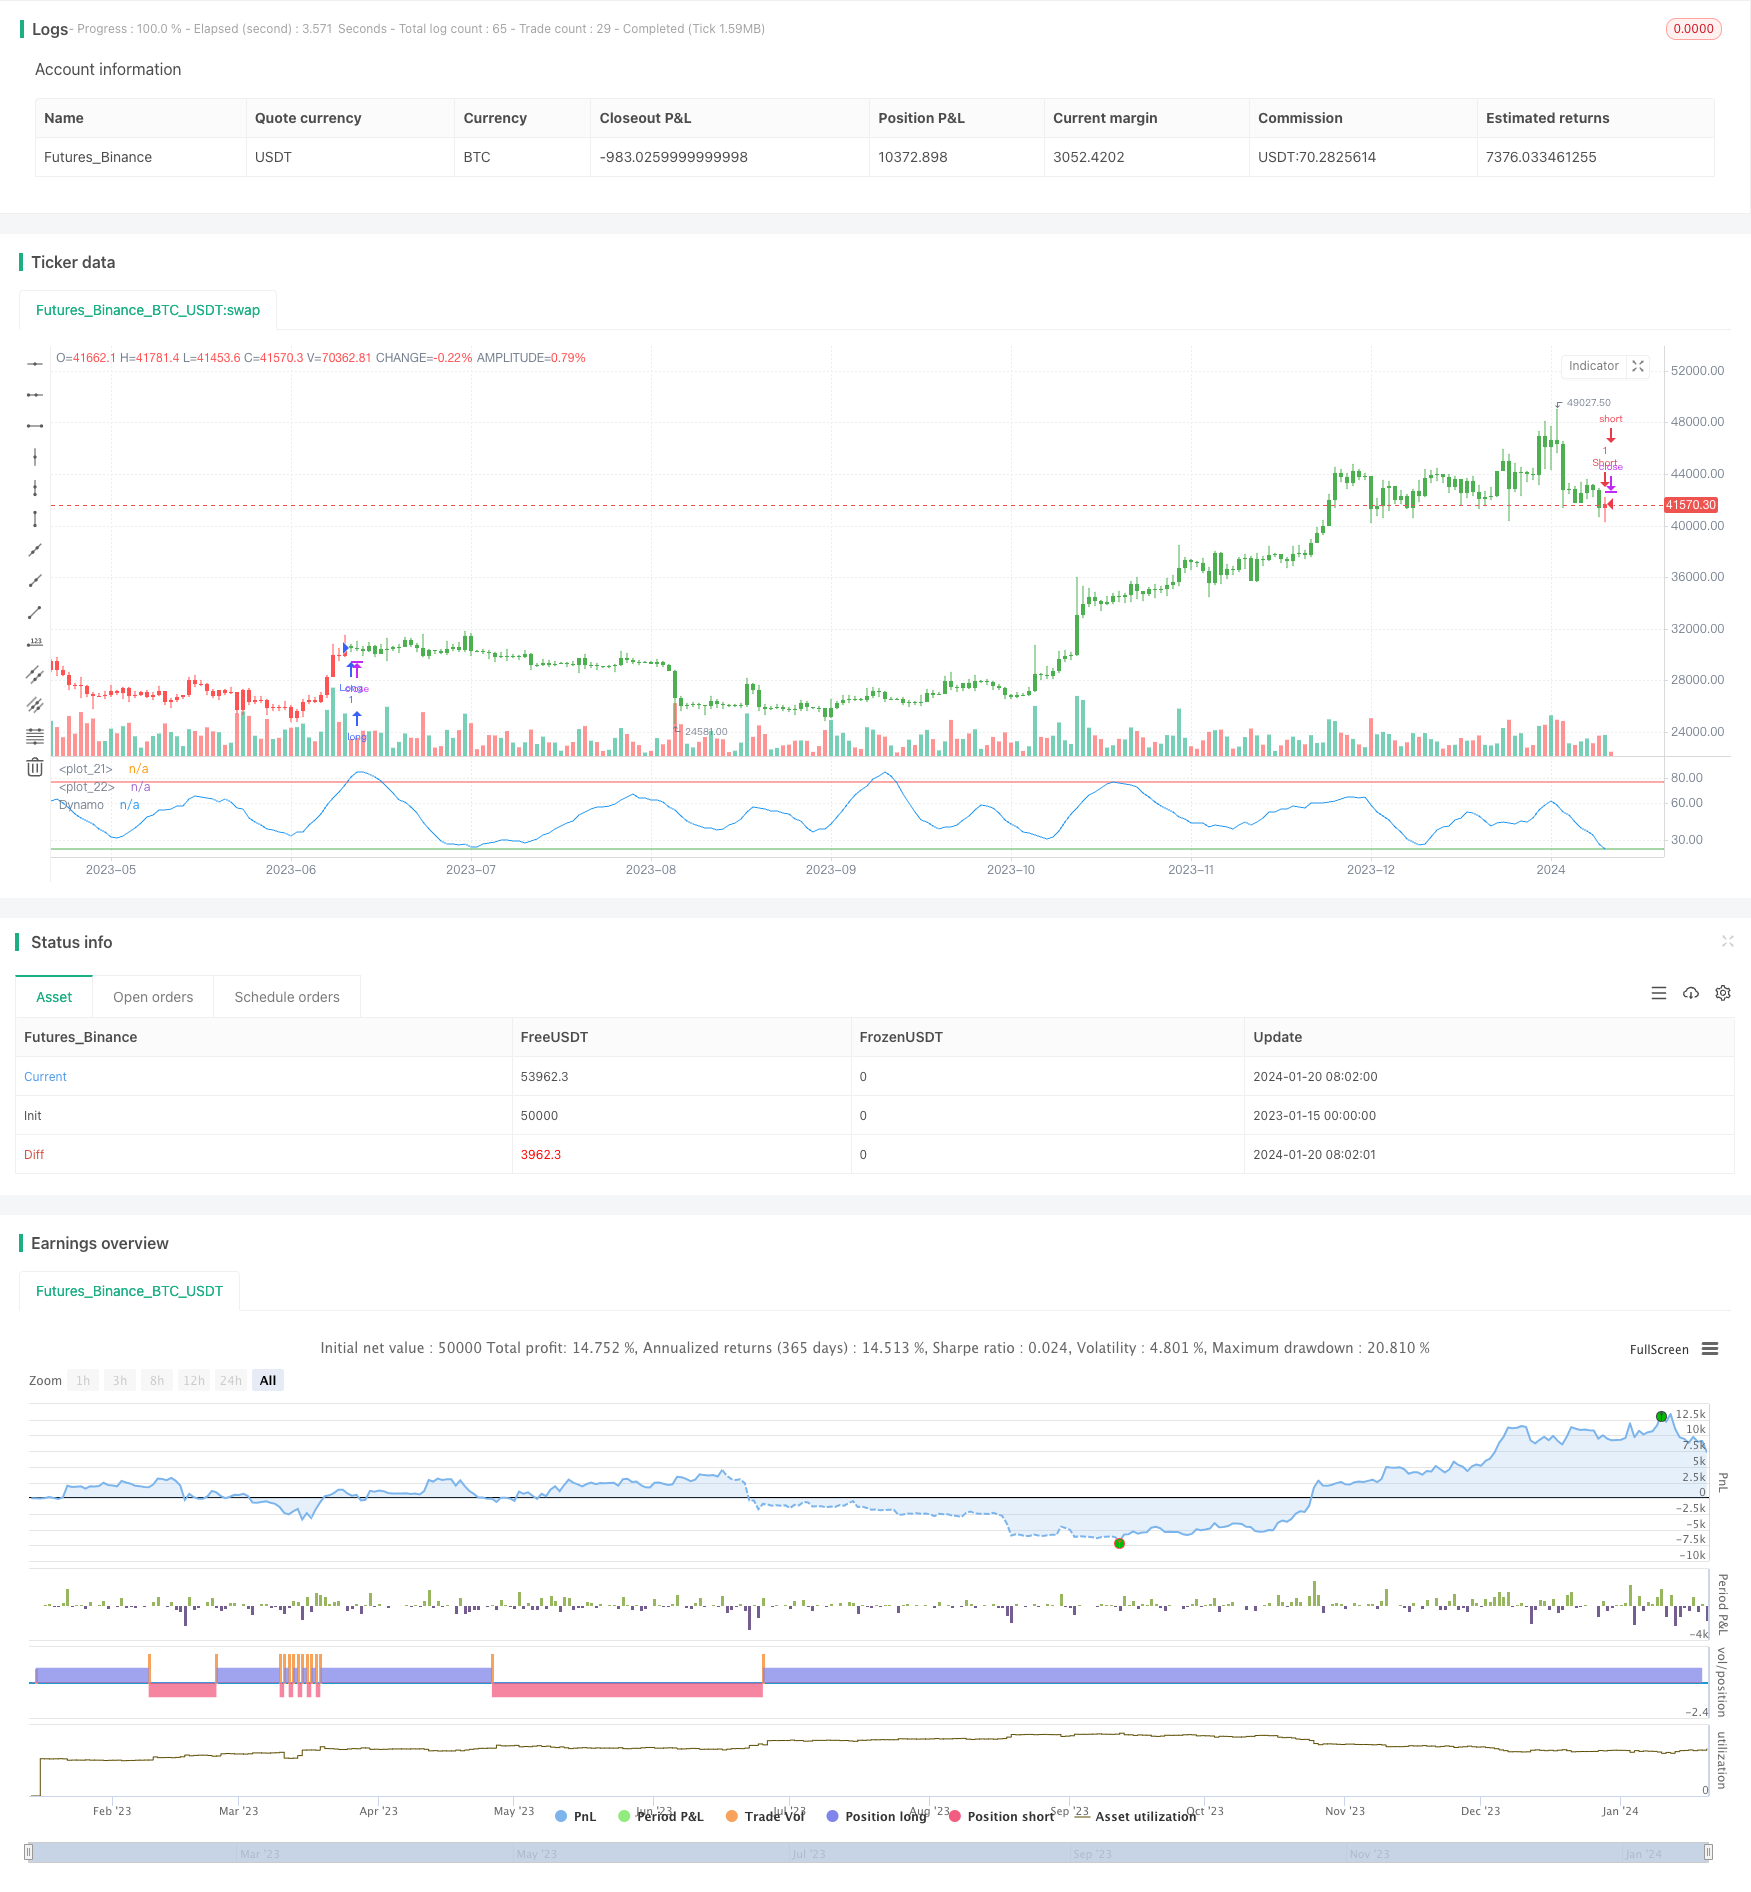
A estratégia de negociação do oscilador de momento dinâmico é baseada no indicador Dynamo, proposto por E. Marshall Wall em um artigo publicado em julho de 1996 na revista Futures Futures, com o tratamento normalizado do oscilador padrão para eliminar a influência da tendência.
Princípio da estratégia
A estratégia primeiro calcula um índice aleatório de 10 dias de duração (Stochastic Oscillator), depois calcula a média móvel simples de 10 dias desse índice, e com base nessa média móvel calcula a média móvel de 20 dias. Esta constitui a base de cálculo do oscilador de massa dinâmica.
A estratégia calcula o máximo e o mínimo do índice, e então calcula o valor médio. Ela diferencia a média de 20 dias do índice original, e depois subtrai esse diferencial do valor médio para formar o instrumento de oscilação padronizado. Quando esse valor padronizado é superior a 77, faça mais, e quando é inferior a 23, faça menos.
Análise de vantagens
As principais vantagens desta estratégia são:
O uso de um indicador de oscilador de dinâmica dinâmica elimina a influência da tendência, tornando os sinais de negociação mais confiáveis.
Combinado com a zona de sobrecompra e sobrevenda, pode-se gerar um sinal de negociação mais preciso no ponto de inflexão.
As regras são simples, claras e fáceis de implementar.
Análise de Riscos
Os principais riscos desta estratégia são:
Quando o mercado está em turbulência, há uma maior probabilidade de que os indicadores emitam sinais errados. Pode-se definir um stop loss para controlar o risco.
Em mercados de turbulência, os sinais falsos são frequentes. Pode-se ajustar os parâmetros adequadamente, filtrando alguns ruídos.
A frequência de transações pode ser alta, e os custos de transação podem ter um impacto sobre os lucros.
Direção de otimização
A estratégia pode ser melhorada em vários aspectos:
Testar dados de diferentes mercados para encontrar os melhores contratos e combinações de parâmetros.
Aumentar as condições de filtragem para avaliar a intensidade da tendência antes de emitir o sinal, evitando ser preso em situações de choque.
Aumentar o mecanismo de parada de perda. Quando o preço ultrapassa uma barreira na direção negativa, opte por parar a perda e sair.
A partir dessa estratégia, podem ser desenvolvidos sistemas de negociação mais complexos para tomar decisões em combinação com vários outros indicadores.
Resumir
A estratégia de negociação do oscilador dinâmico elimina os efeitos da tendência e envia sinais de negociação mais precisos nas áreas de sobrevenda. A estratégia é simples e fácil de implementar, mas também possui um certo risco. A estabilidade e a lucratividade do sistema podem ser melhoradas ainda mais com a otimização de parâmetros e regras.
/*backtest
start: 2023-01-15 00:00:00
end: 2024-01-21 00:00:00
period: 1d
basePeriod: 1h
exchanges: [{"eid":"Futures_Binance","currency":"BTC_USDT"}]
*/

//@version=2
////////////////////////////////////////////////////////////
//  Copyright by HPotter v1.0 10/04/2017
// In July 1996 Futures magazine, E. Marshall Wall introduces the
// Dynamic Momentum Oscillator (Dynamo). Please refer to this article
// for interpretation.
// The Dynamo oscillator is a normalizing function which adjusts the
// values of a standard oscillator for trendiness by taking the difference
// between the value of the oscillator and a moving average of the oscillator
// and then subtracting that value from the oscillator midpoint.
//
// You can change long to short in the Input Settings
// Please, use it only for learning or paper trading. Do not for real trading
////////////////////////////////////////////////////////////
strategy(title="Dynamo", shorttitle="Dynamo")
OscLen = input(10, minval=1)
MALen = input(20, minval=1)
HiBand = input(77, minval=1)
LowBand = input(23)
reverse = input(false, title="Trade reverse")
hline(HiBand, color=red, linestyle=line)
hline(LowBand, color=green, linestyle=line)
xOscK = stoch(close, high, low, OscLen)
xOscAvg = sma(xOscK, OscLen)
xMAVal = sma(xOscAvg, MALen)
maxNum = 9999999
LowestSoFar = iff(xOscAvg < nz(LowestSoFar[1], maxNum), xOscAvg, nz(LowestSoFar[1], maxNum))
HighestSoFar = iff(xOscAvg > nz(HighestSoFar[1]), xOscAvg, nz(HighestSoFar[1]))
MidPnt = (LowestSoFar + HighestSoFar) / 2
nRes = MidPnt - (xMAVal - xOscAvg)
pos = iff(nRes > HiBand, 1,
	     iff(nRes < LowBand, -1, nz(pos[1], 0)))
possig = iff(reverse and pos == 1, -1,
          iff(reverse and pos == -1, 1, pos))
if (possig == 1)
    strategy.entry("Long", strategy.long)
if (possig == -1)
    strategy.entry("Short", strategy.short)
barcolor(possig == -1 ? red: possig == 1 ? green : blue )
plot(nRes, color=blue, title="Dynamo")