Estratégia de criador de mercado de limite de banda de Bollinger
Visão geral
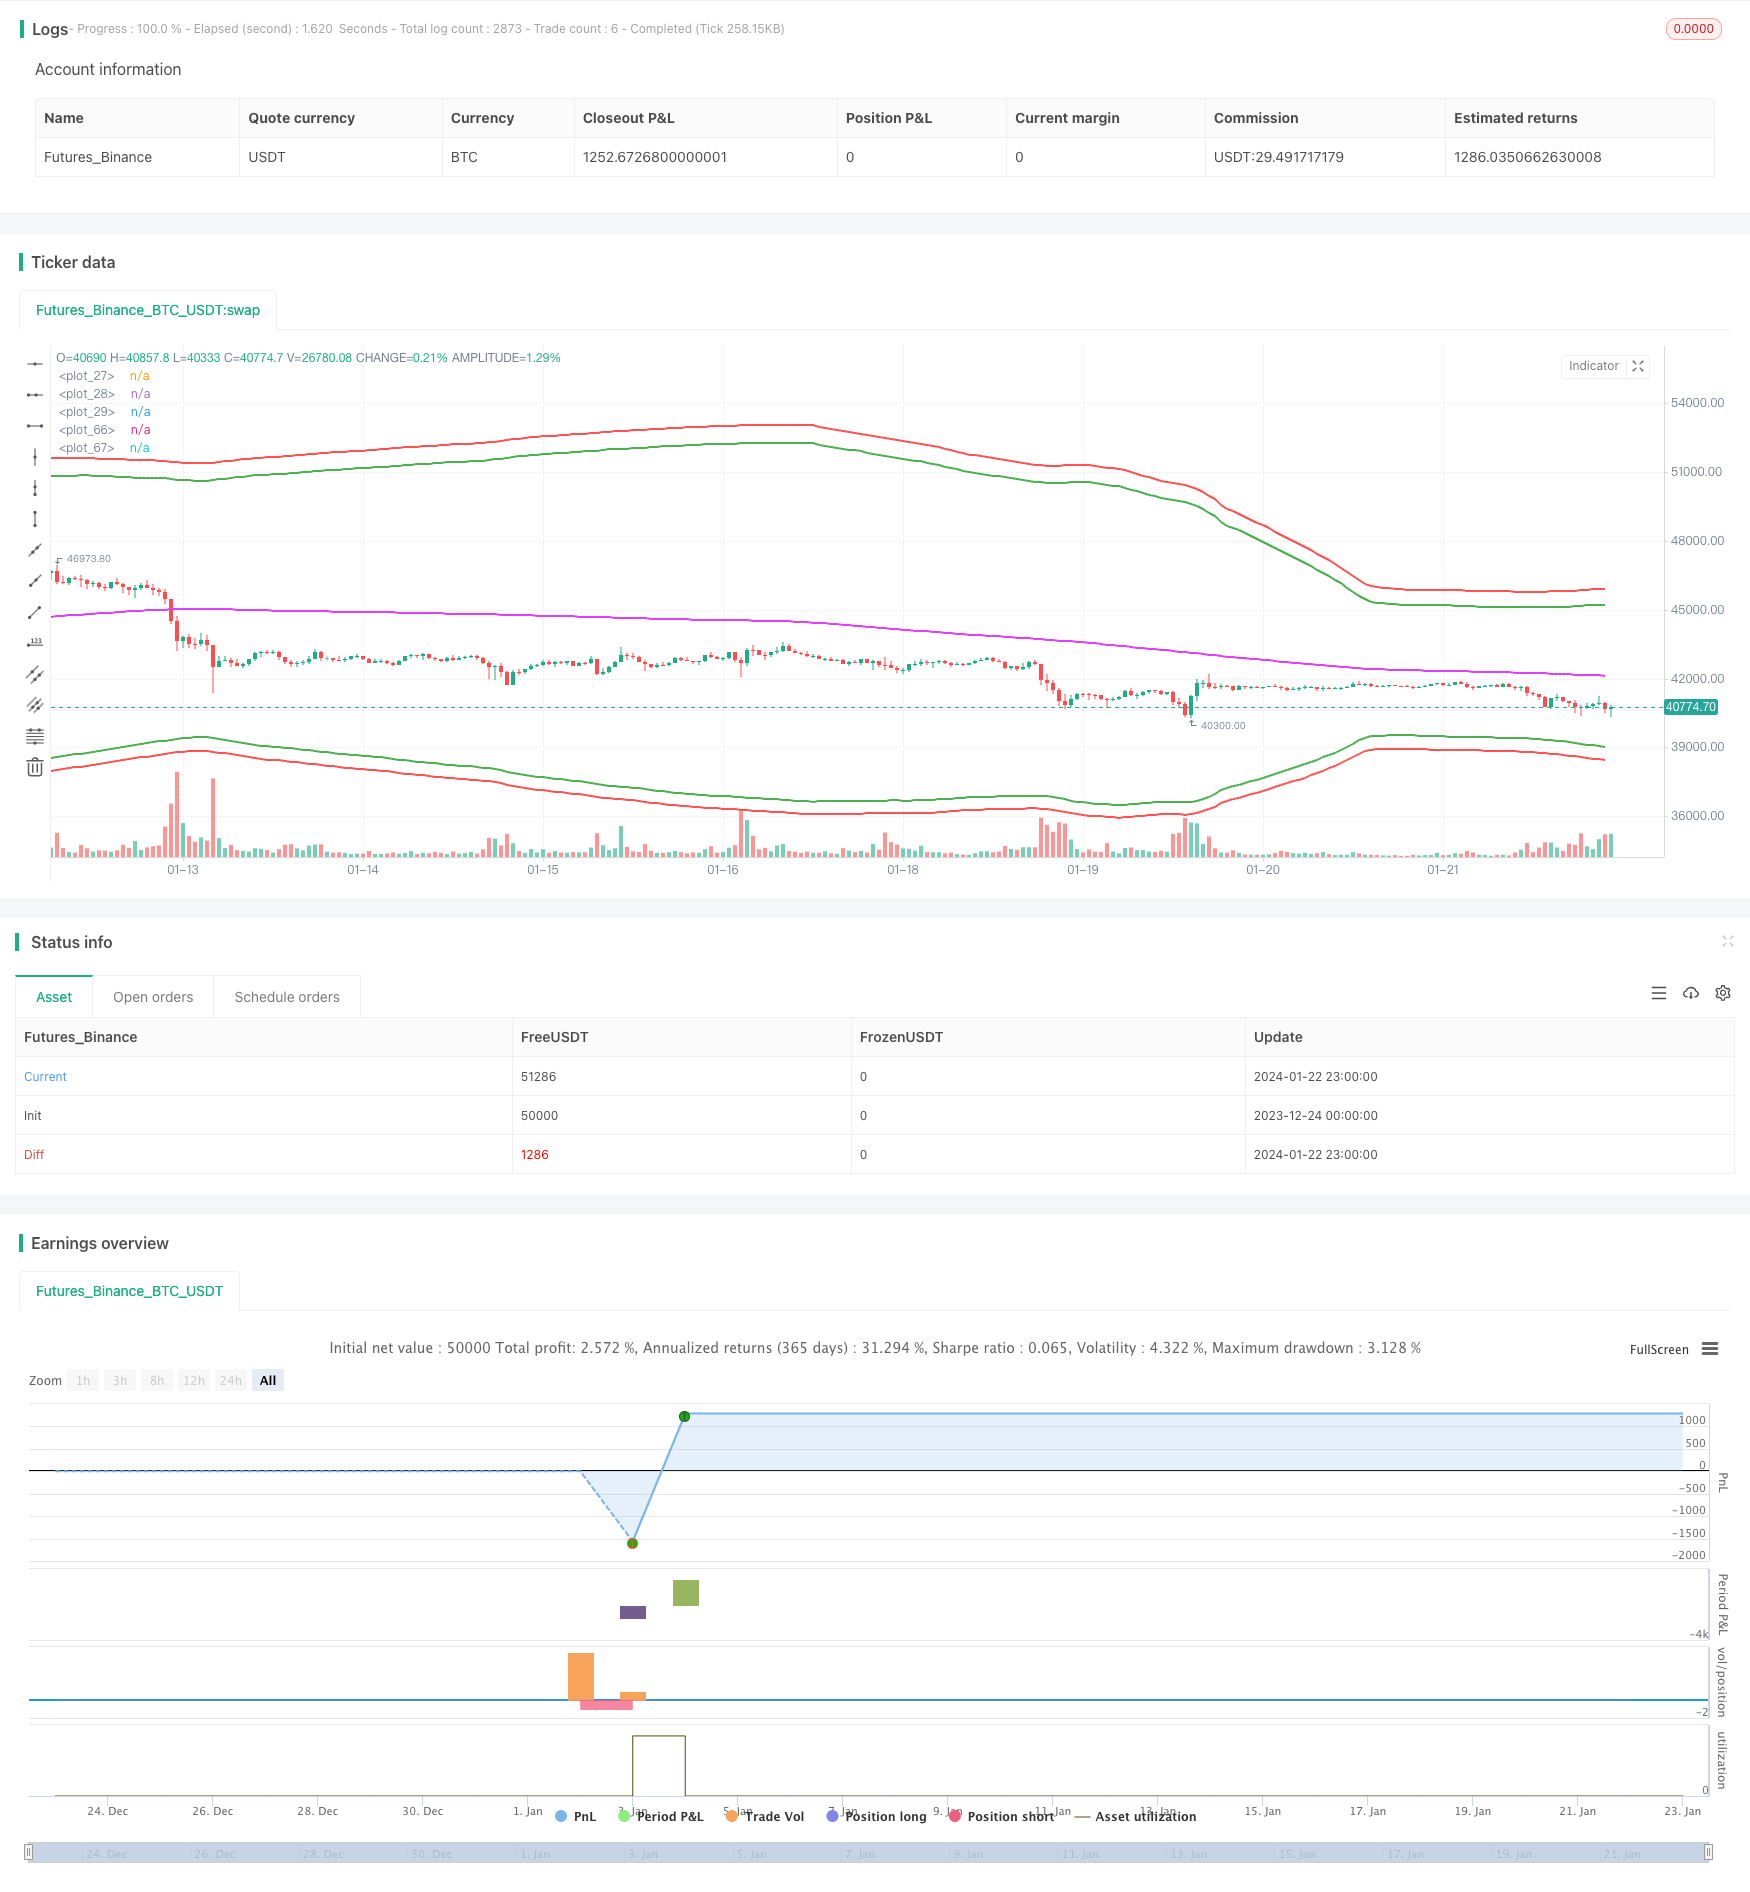
A estratégia é uma estratégia de comerciante que usa bandas de Brin como entradas, médias móveis como fechamento, e porcentagens de parada simples como parada de perda. Ela obteve um lucro muito alto em contratos de xtbtusd em junho de 2022.
Princípio da estratégia
A estratégia usa a linha superior e inferior da faixa de Brin como uma área de oportunidade para a construção de uma posição. Concretamente, quando o preço está abaixo da linha inferior, uma posição é aberta; quando o preço está acima da linha superior, uma posição é aberta.
Além disso, a estratégia também usa a média móvel como base para a posição de equilíbrio. Quando se detém vários pedidos, se o preço for superior à média móvel, será escolhido o equilíbrio; da mesma forma, quando se detém bilhetes vazios, se o preço for inferior à média móvel, será escolhido o equilíbrio.
Para o stop loss, a estratégia usa o preço de entrada multiplicado por uma determinada porcentagem de esta simples forma de stop loss rolante. Isso pode efetivamente evitar grandes perdas em situações unilaterais.
Análise de vantagens
As principais vantagens desta estratégia são:
- O uso de Brinks permite capturar a volatilidade dos preços de forma eficiente e oferece mais oportunidades de negociação quando a volatilidade aumenta.
- A estratégia de mercadotecnia permite obter receita de comissões de ambos os lados através de transações bidirecionais.
- O uso de percentual de stop loss pode controlar o risco de forma ativa, evitando perdas enormes em situações unilaterais.
Análise de Riscos
A estratégia também apresenta alguns riscos:
- A faixa de Bryn não é sempre um indicador de entrada confiável, às vezes dá sinais errados.
- A estratégia de marketing pode ser usada como uma armadilha em situações de turbulência.
- A percentagem de perdas pode ser muito arbitrária e não ser flexível para situações complexas.
Para minimizar esses riscos, podemos considerar filtros em combinação com outros indicadores, otimizar a configuração da estratégia de stop loss ou limitar adequadamente o tamanho da posição.
Direção de otimização
A estratégia ainda tem espaço para ser melhorada:
- Pode-se testar diferentes combinações de parâmetros para encontrar o melhor parâmetro.
- Pode-se adicionar mais indicadores de filtragem para a verificação multifatorial.
- Os parâmetros podem ser otimizados automaticamente usando métodos de aprendizado de máquina.
- Pode-se considerar o uso de métodos de perda mais refinados, como a perda de paralelo.
Resumir
A estratégia é, em geral, uma estratégia de mercado de alta frequência muito lucrativa. Ela usa a faixa de Brin para oferecer oportunidades de negociação e controlar o risco. Mas também precisamos estar cientes de seus problemas e deficiências e testá-los com cuidado no mercado real. Com mais otimização, a estratégia pode gerar retornos ultra-altos mais estáveis.
/*backtest
start: 2023-12-24 00:00:00
end: 2024-01-23 00:00:00
period: 1h
basePeriod: 15m
exchanges: [{"eid":"Futures_Binance","currency":"BTC_USDT"}]
*/

//@version=3
strategy(shorttitle="BBL", title="BB limit", overlay = true)


length = input(200, minval=1)
src = input(hlc3, title="Source")
xmult = input(44, minval=0.001, maxval=5000, title = "bb mult (0.1%)")
s = input(title="Trend source", defval = "sma", options = ["ema", "sma", "rma", "wma"])
basis = s == "ema" ? ema(src, length) : s == "sma" ? sma(src, length) : s =="rma" ? rma(src, length) : wma(src, length)
sd = input(title="Dev source", defval = "stdev", options = ["stdev", "dev"])
mult = xmult / 10
dev = sd == "stdev" ? mult * stdev(src, length) : mult * dev(src, length)
diff = input(0.5, title = "Spread")
LongPrice(p) =>
    LongPrice = diff == 0 ? p : floor(p / diff) * diff

ShortPrice(p) =>
    ShortPrice = diff == 0 ? p : ceil(p / diff) * diff

pyr = input(1, title = "Pyramiding")
useStopLoss = input(true)
stoploss_xmult = input(15, minval=0.001, maxval=5000, title = "StopLoss 0.1%")
stopLoss_mult = sd == "simple" ? 1 + stoploss_xmult / 10 / 100 : stoploss_xmult / 10
dev2 = sd == "stdev" ? stopLoss_mult * stdev(src, length) : sd == "dev" ? stopLoss_mult * dev(src, length) : (stopLoss_mult - 1) * basis
upper = basis + (1*dev)
lower = basis - (1*dev)
plot(basis, color=fuchsia, linewidth=2)
plot(upper, color=green, linewidth=2)
plot(lower, color=green, linewidth=2)


strategy.cancel_all()

if strategy.position_size > 0 and close <= basis + diff * 2
    strategy.order("Close long", strategy.short, strategy.position_size, limit = ShortPrice(basis))
else
    if strategy.position_size < 0 and close >= basis - diff * 2
        strategy.order("Close short", strategy.long, -strategy.position_size, limit = LongPrice(basis))

stopLossPrice1 = na
stopLossPrice2 = na
add = na
openOrderCondition = close > lower - 2 * diff and (strategy.opentrades < pyr or (strategy.position_size < 0 and strategy.position_avg_price > lower * (1 + stopLoss_mult / 100)))
if openOrderCondition
    add := strategy.position_size > 0 ? -strategy.position_size : close >= basis - diff * 2 ? 0 : -strategy.position_size
    strategy.order("Open long", strategy.long, strategy.equity / pyr / lower + add, limit = LongPrice(lower))
if useStopLoss and (strategy.position_size > 0 or openOrderCondition)
    add = openOrderCondition ? strategy.equity / pyr / lower : 0
    posPrice = strategy.position_size <= 0 ? lower : strategy.position_avg_price
    posSize = strategy.position_size <= 0 ? 0 : strategy.position_size
    stopLossPrice1 := posPrice * (1 - stopLoss_mult / 100)
    strategy.order("StopLoss open short ", strategy.short, posSize + add + strategy.equity / pyr / stopLossPrice1, stop = ShortPrice(stopLossPrice1))


openOrderCondition := close < upper + 2 * diff and (strategy.opentrades < pyr or (strategy.position_size > 0 and strategy.position_avg_price * (1 + stopLoss_mult / 100) < upper))
if openOrderCondition
    add := strategy.position_size < 0 ? strategy.position_size : close <= basis + diff * 2 ? 0 : strategy.position_size
    strategy.order("Open short", strategy.short, strategy.equity / pyr / upper + add, limit = ShortPrice(upper))
if useStopLoss and (strategy.position_size < 0 or openOrderCondition)
    add = openOrderCondition ? strategy.equity / pyr / upper : 0
    posPrice = strategy.position_size >= 0 ? upper : strategy.position_avg_price
    posSize = strategy.position_size >= 0 ? 0 : -strategy.position_size
    stopLossPrice2 := posPrice * (1 + stopLoss_mult / 100)
    strategy.order("StopLoss open long", strategy.long, posSize + add + strategy.equity / pyr / stopLossPrice2, stop = LongPrice(stopLossPrice2))

plot(not useStopLoss ? na : stopLossPrice1, color=red, linewidth=2)
plot(not useStopLoss ? na : stopLossPrice2, color=red, linewidth=2)

// === Backtesting Dates ===
testPeriodSwitch = input(false, "Custom Backtesting Dates")
testStartYear = input(2018, "Backtest Start Year")
testStartMonth = input(1, "Backtest Start Month")
testStartDay = input(1, "Backtest Start Day")
testStartHour = input(0, "Backtest Start Hour")
testPeriodStart = timestamp(testStartYear,testStartMonth,testStartDay,testStartHour,0)
testStopYear = input(2018, "Backtest Stop Year")
testStopMonth = input(12, "Backtest Stop Month")
testStopDay = input(14, "Backtest Stop Day")
testStopHour = input(14, "Backtest Stop Hour")
testPeriodStop = timestamp(testStopYear,testStopMonth,testStopDay,testStopHour,0)
testPeriod() =>
    time >= testPeriodStart and time <= testPeriodStop ? true : false
isPeriod = testPeriodSwitch == true ? testPeriod() : true
// === /END
if not isPeriod
    strategy.cancel_all()
    strategy.close_all()