Estratégia de rastreamento de momento de filtragem de alcance adaptável bidirecional
Data de criação:
2024-01-24 11:31:51
última modificação:
2024-01-24 11:32:23
cópia:
1
Cliques:
705
1
focar em
1750
Seguidores
Visão geral
A estratégia é uma estratégia bidirecional de rastreamento de variações de variação de variação de variação de variação. Utiliza um filtro de variação de variação de variação de variação de variação de variação de variação de variação de variação de variação de variação de variação de variação de variação de variação de variação.
Princípio da estratégia
- O tamanho do filtro é ajustado de acordo com o intervalo, a quantidade e a escala definidos pelo usuário.
- Os filtros são divididos em dois tipos: Type 1 e Type 2. O Type 1 é o tipo de rastreamento de alcance padrão, e o Type 2 é o tipo de rastreamento de escala.
- A direção da flutuação do preço é determinada pela relação entre o tamanho do filtro e o preço de fechamento. O preço é positivo acima da linha superior e negativo abaixo da linha inferior.
- Combinando o preço de fechamento com a queda e queda do dia anterior, a direção do valor é determinada. O valor subiu para o topo e desceu para o topo.
- Quando o preço quebra a trajetória e o valor sobe, é emitido um sinal de compra; Quando o preço despenca e o valor cai, é emitido um sinal de venda.
Análise de vantagens
- O filtro de alcance adaptável capta com precisão as flutuações do mercado.
- Os dois tipos de filtros podem atender a diferentes preferências de negociação.
- Os indicadores de potência combinada identificam de forma eficaz a direção do valor.
- A estratégia é flexível e pode ser ajustada de acordo com os parâmetros do mercado.
- Customize Selecione a lógica de condições de transação apropriada.
Análise de Riscos
- A configuração inadequada dos parâmetros pode levar a transações excessivas ou a fugas.
- O sinal de ruptura está atrasado.
- Os indicadores quantitativos mostram que há um risco de cartões.
- A quebra de alcance é fácil de ser apanhada.
Prevenção de riscos:
- Escolha a combinação de parâmetros apropriada e ajuste quando necessário.
- Em combinação com outros indicadores, identifique tendências.
- Comércio prudente perto de pontos críticos e reversão de tendência.
Direção de otimização
- Teste diferentes combinações de tamanhos de alcance e de parâmetros de ciclo de deslizamento para encontrar a melhor combinação.
- Experimente diferentes tipos de filtros e escolha o tipo de preferência pessoal.
- Testar outros indicadores de quantidade ou indicadores de tecnologia auxiliar.
- Otimizar e ajustar a lógica de condições de transação para reduzir transações irracionais.
- Combinado com a teoria de classificação de mercado, o setor de arbitragem adaptável é definido.
Código-fonte da estratégia
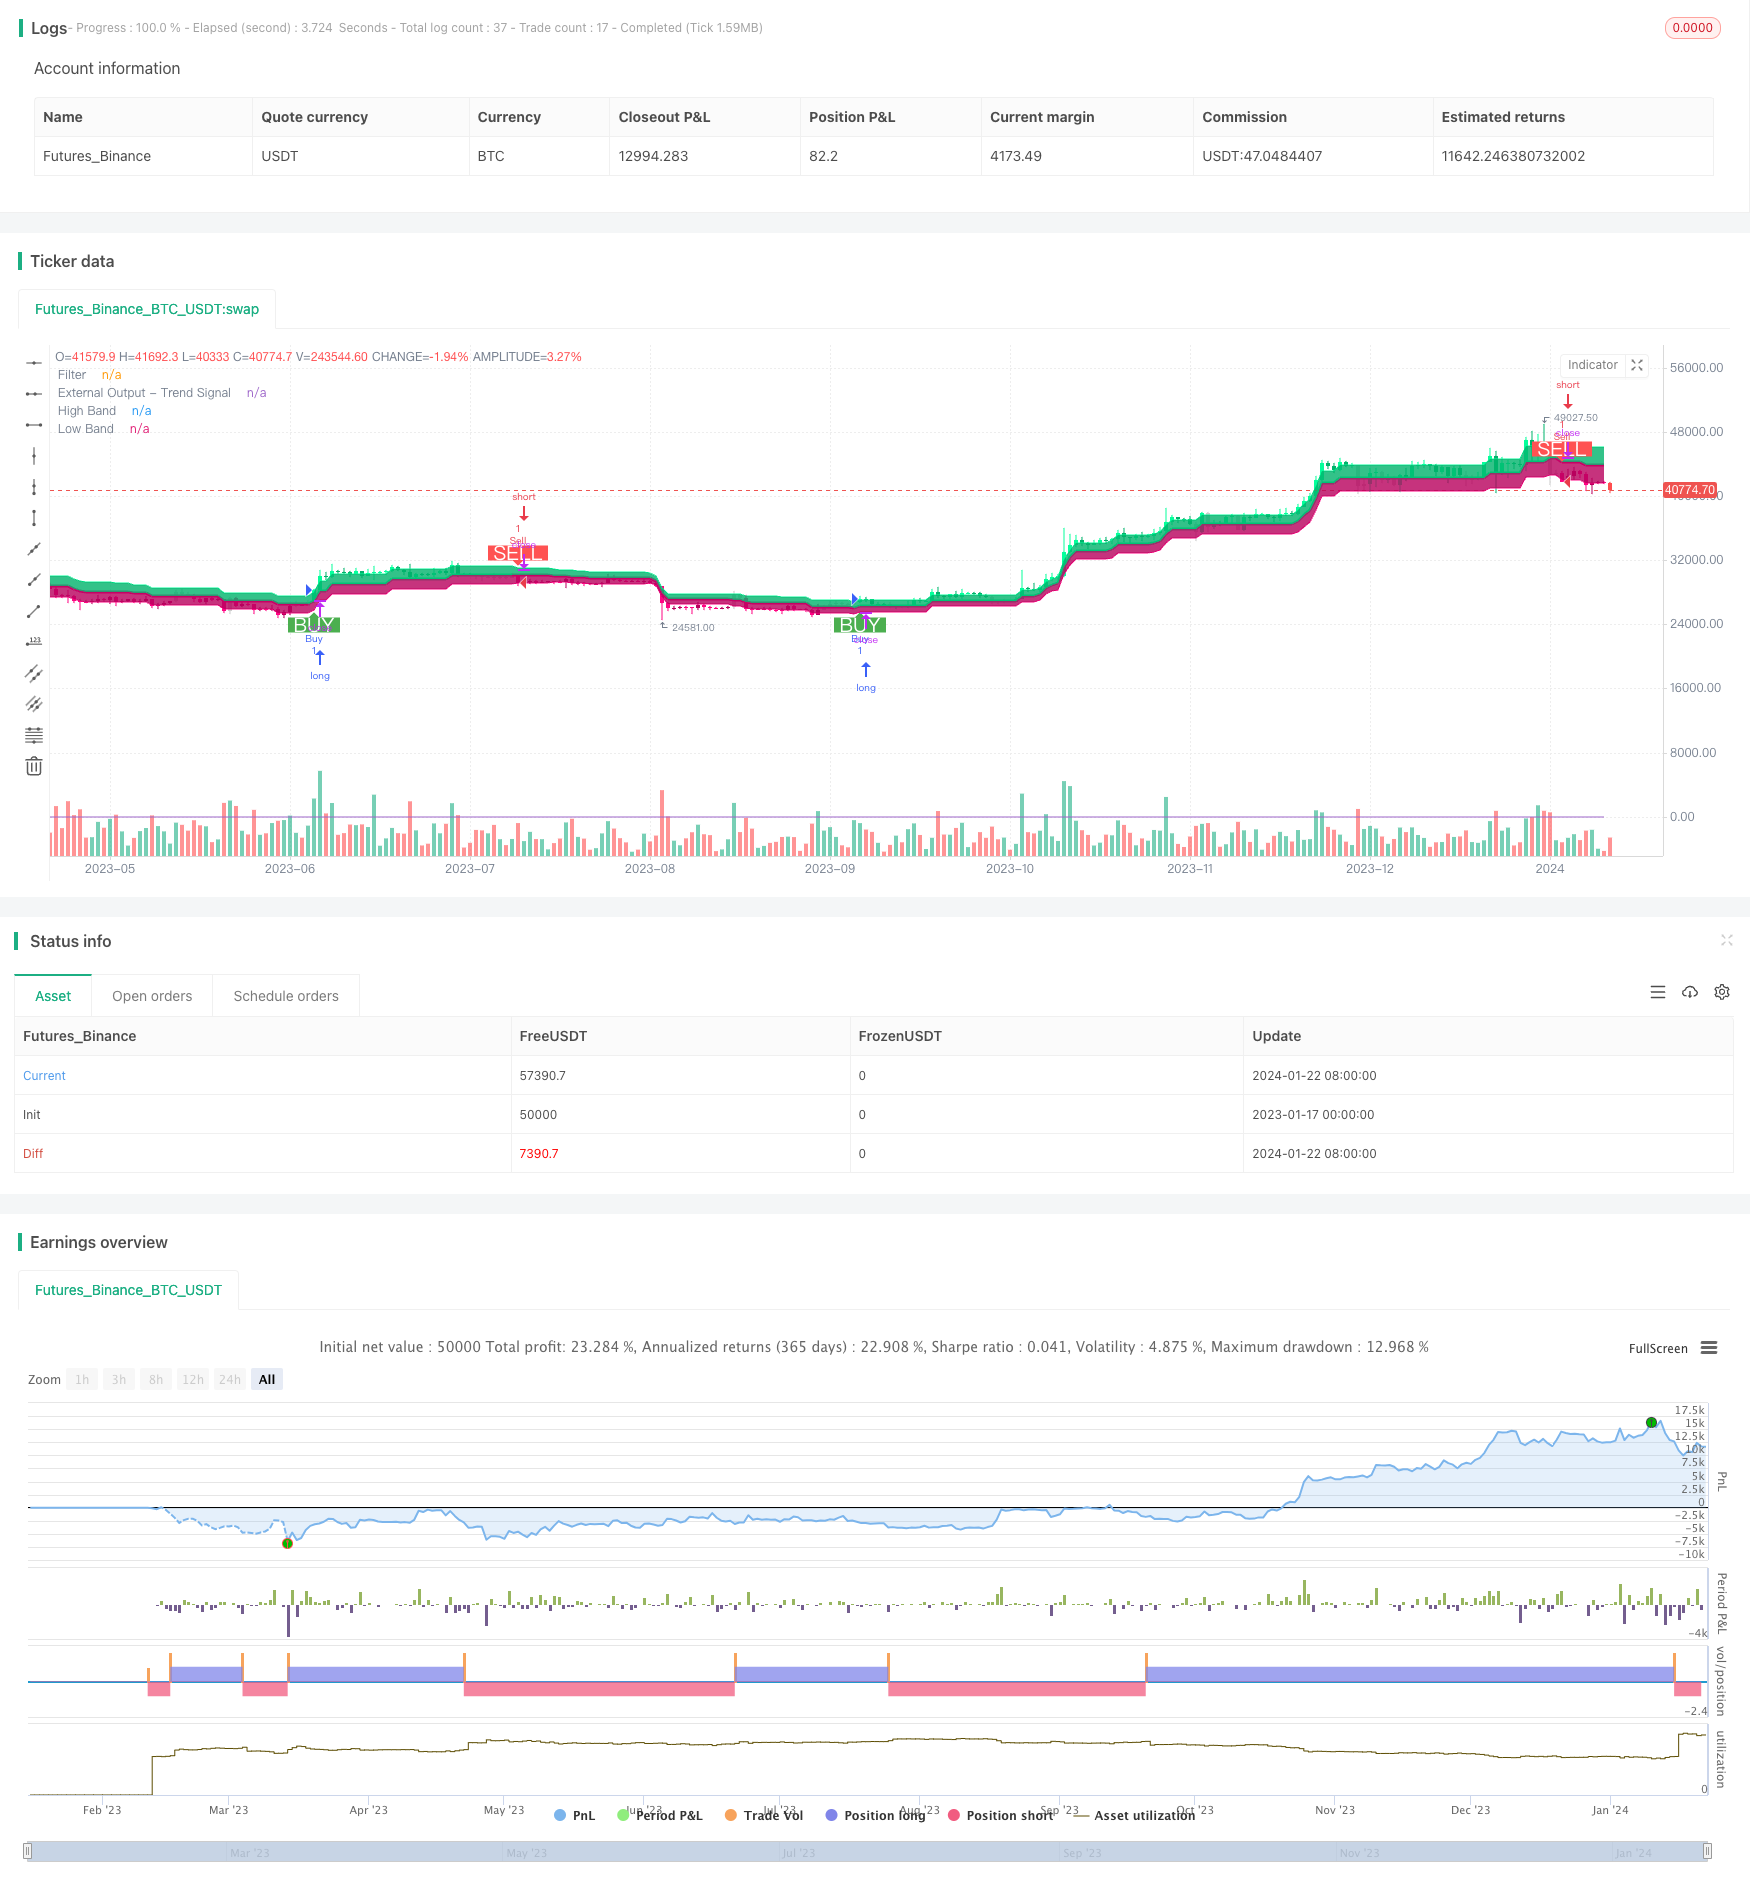
/*backtest
start: 2023-01-17 00:00:00
end: 2024-01-23 00:00:00
period: 1d
basePeriod: 1h
exchanges: [{"eid":"Futures_Binance","currency":"BTC_USDT"}]
*/

//@version=4
strategy("Range Filter [DW] & Labels", shorttitle="RF [DW] & Labels", overlay=true)


//Conditional Sampling EMA Function
Cond_EMA(x, cond, n)=>
    var val     = array.new_float(0)
    var ema_val = array.new_float(1)
    if cond
        array.push(val, x)
        if array.size(val) > 1
            array.remove(val, 0)
        if na(array.get(ema_val, 0))
            array.fill(ema_val, array.get(val, 0))
        array.set(ema_val, 0, (array.get(val, 0) - array.get(ema_val, 0))*(2/(n + 1)) + array.get(ema_val, 0))
    EMA = array.get(ema_val, 0)
    EMA

//Conditional Sampling SMA Function
Cond_SMA(x, cond, n)=>
    var vals = array.new_float(0)
    if cond
        array.push(vals, x)
        if array.size(vals) > n
            array.remove(vals, 0)
    SMA = array.avg(vals)
    SMA

//Standard Deviation Function
Stdev(x, n)=>
    sqrt(Cond_SMA(pow(x, 2), 1, n) - pow(Cond_SMA(x, 1, n), 2))

//Range Size Function
rng_size(x, scale, qty, n)=>
    ATR      = Cond_EMA(tr(true), 1, n)
    AC       = Cond_EMA(abs(x - x[1]), 1, n)
    SD       = Stdev(x, n)
    rng_size = scale=="Pips" ? qty*0.0001 : scale=="Points" ? qty*syminfo.pointvalue : scale=="% of Price" ? close*qty/100 : scale=="ATR" ? qty*ATR :
               scale=="Average Change" ? qty*AC : scale=="Standard Deviation" ? qty*SD : scale=="Ticks" ? qty*syminfo.mintick : qty

//Two Type Range Filter Function
rng_filt(h, l, rng_, n, type, smooth, sn, av_rf, av_n)=>
    rng_smooth = Cond_EMA(rng_, 1, sn)
    r          = smooth ? rng_smooth : rng_
    var rfilt  = array.new_float(2, (h + l)/2)
    array.set(rfilt, 1, array.get(rfilt, 0))
    if type=="Type 1"
        if h - r > array.get(rfilt, 1)
            array.set(rfilt, 0, h - r)
        if l + r < array.get(rfilt, 1)
            array.set(rfilt, 0, l + r)
    if type=="Type 2"
        if h >= array.get(rfilt, 1) + r
            array.set(rfilt, 0, array.get(rfilt, 1) + floor(abs(h - array.get(rfilt, 1))/r)*r)
        if l <= array.get(rfilt, 1) - r
            array.set(rfilt, 0, array.get(rfilt, 1) - floor(abs(l - array.get(rfilt, 1))/r)*r)
    rng_filt1 = array.get(rfilt, 0)
    hi_band1  = rng_filt1 + r
    lo_band1  = rng_filt1 - r
    rng_filt2 = Cond_EMA(rng_filt1, rng_filt1 != rng_filt1[1], av_n)
    hi_band2  = Cond_EMA(hi_band1, rng_filt1 != rng_filt1[1], av_n)
    lo_band2  = Cond_EMA(lo_band1, rng_filt1 != rng_filt1[1], av_n)
    rng_filt  = av_rf ? rng_filt2 : rng_filt1
    hi_band   = av_rf ? hi_band2 : hi_band1
    lo_band   = av_rf ? lo_band2 : lo_band1
    [hi_band, lo_band, rng_filt]

//-----------------------------------------------------------------------------------------------------------------------------------------------------------------
//Inputs
//-----------------------------------------------------------------------------------------------------------------------------------------------------------------

//Filter Type
f_type = input(defval="Type 1", options=["Type 1", "Type 2"], title="Filter Type")

//Movement Source
mov_src = input(defval="Close", options=["Wicks", "Close"], title="Movement Source")

//Range Size Inputs
rng_qty   = input(defval=2.618, minval=0.0000001, title="Range Size")
rng_scale = input(defval="Average Change", options=["Points", "Pips", "Ticks", "% of Price", "ATR", "Average Change", "Standard Deviation", "Absolute"], title="Range Scale")

//Range Period
rng_per = input(defval=14, minval=1, title="Range Period (for ATR, Average Change, and Standard Deviation)")

//Range Smoothing Inputs
smooth_range = input(defval=true, title="Smooth Range")
smooth_per   = input(defval=27, minval=1, title="Smoothing Period")

//Filter Value Averaging Inputs
av_vals    = input(defval=true, title="Average Filter Changes")
av_samples = input(defval=2, minval=1, title="Number Of Changes To Average")

//-----------------------------------------------------------------------------------------------------------------------------------------------------------------
//Definitions
//-----------------------------------------------------------------------------------------------------------------------------------------------------------------

//High And Low Values
h_val = mov_src=="Wicks" ? high : close
l_val = mov_src=="Wicks" ? low : close

//Range Filter Values
[h_band, l_band, filt] = rng_filt(h_val, l_val, rng_size((h_val + l_val)/2, rng_scale, rng_qty, rng_per), rng_per, f_type, smooth_range, smooth_per, av_vals, av_samples)

//Direction Conditions
var fdir = 0.0
fdir    := filt > filt[1] ? 1 : filt < filt[1] ? -1 : fdir
upward   = fdir==1 ? 1 : 0
downward = fdir==-1 ? 1 : 0

//Colors
filt_color = upward ? #05ff9b : downward ? #ff0583 : #cccccc
bar_color  = upward and (close > filt) ? (close > close[1] ? #05ff9b : #00b36b) :
             downward and (close < filt) ? (close < close[1] ? #ff0583 : #b8005d) : #cccccc

//-----------------------------------------------------------------------------------------------------------------------------------------------------------------
//Outputs
//-----------------------------------------------------------------------------------------------------------------------------------------------------------------

//Filter Plot
filt_plot = plot(filt, color=filt_color, transp=0, linewidth=3,  title="Filter")

//Band Plots
h_band_plot = plot(h_band, color=#05ff9b, transp=100, title="High Band")
l_band_plot = plot(l_band, color=#ff0583, transp=100, title="Low Band")

//Band Fills
fill(h_band_plot, filt_plot, color=#00b36b, transp=85, title="High Band Fill")
fill(l_band_plot, filt_plot, color=#b8005d, transp=85, title="Low Band Fill")

//Bar Color
barcolor(bar_color)

//External Trend Output
plot(fdir, transp=100, editable=false, display=display.none, title="External Output - Trend Signal")

// Trading Conditions Logic
longCond = close > filt and close > close[1] and upward > 0 or close > filt and close < close[1] and upward > 0
shortCond = close < filt and close < close[1] and downward > 0 or close < filt and close > close[1] and downward > 0

CondIni = 0
CondIni := longCond ? 1 : shortCond ? -1 : CondIni[1]
longCondition = longCond and CondIni[1] == -1
shortCondition = shortCond and CondIni[1] == 1

// Strategy Entry and Exit
strategy.entry("Buy", strategy.long, when = longCondition)
strategy.entry("Sell", strategy.short, when = shortCondition)

strategy.close("Buy", when = shortCondition)
strategy.close("Sell", when = longCondition)

// Plot Buy and Sell Labels
plotshape(longCondition, title = "Buy Signal", text ="BUY", textcolor = color.white, style=shape.labelup, size = size.normal, location=location.belowbar, color = color.green, transp = 0)
plotshape(shortCondition, title = "Sell Signal", text ="SELL", textcolor = color.white, style=shape.labeldown, size = size.normal, location=location.abovebar, color = color.red, transp = 0)

// Alerts
alertcondition(longCondition, title="Buy Alert", message = "BUY")
alertcondition(shortCondition, title="Sell Alert", message = "SELL")