Estratégia de rompimento de alta com base em Bandas de Bollinger e VWAP

1
Follow
1782
Followers
Visão geral
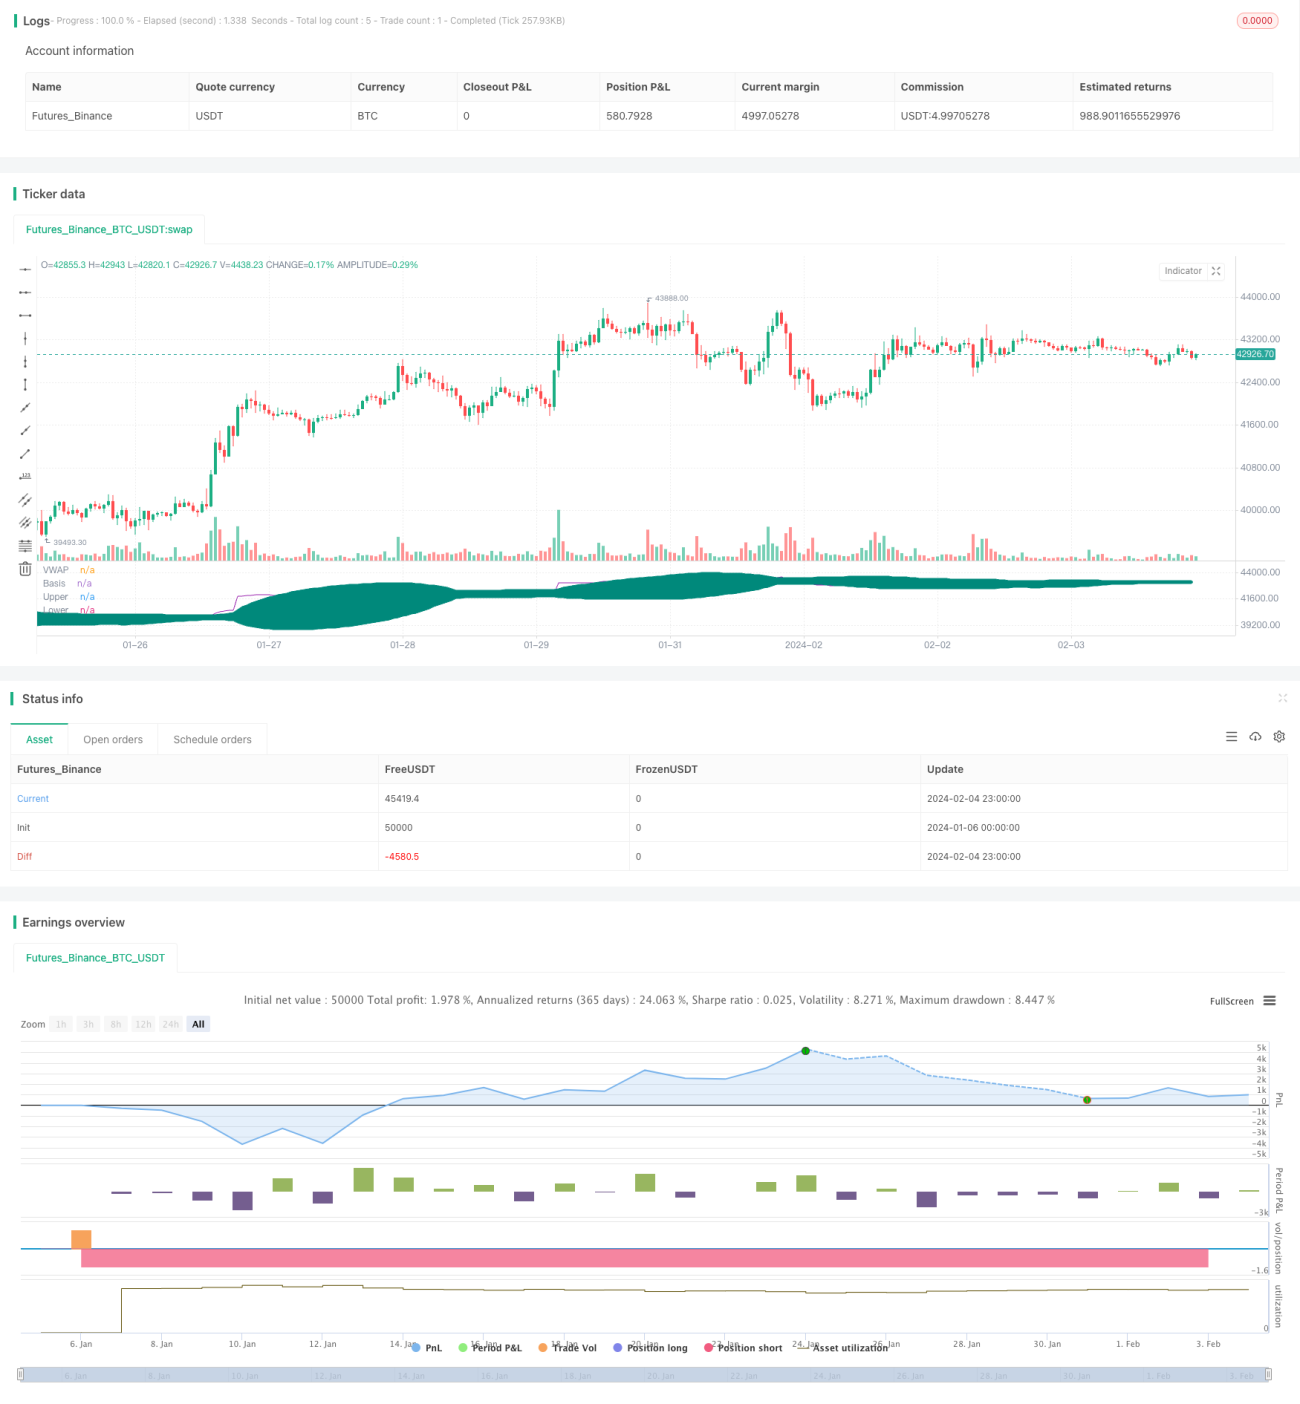
Esta estratégia usa o indicador da faixa de Brin para rastrear o VWAP e adota uma estratégia de múltiplos cabeças quando o VWAP se move para cima e quebra a faixa de Brin, sendo julgado como uma quebra de múltiplos cabeças; e quando o VWAP se move para baixo e quebra a faixa de Brin, é julgado como uma confirmação de cabeça vazia, e a posição de equilíbrio sai do campo. Ao mesmo tempo, a estratégia também introduz o Pivot Point, o principal ponto de apoio, como um critério auxiliar para o sinal de entrada, para filtrar algumas falsas quebras.
Princípio da estratégia
- Calcular o valor do VWAP.
- Calcule o VWAP da faixa de Brin, que inclui a faixa superior, a faixa média e a faixa inferior
- Para avaliar se o VWAP irá romper o meio do trajeto da faixa de Bryn para cima, e se for e o preço estiver acima do Pivot Point do suporte principal, use uma entrada de estratégia multi-cabeça.
- O Stop Loss está definido em 5%.
- Se o VWAP derrubar a linha de descida de Brin para baixo, a cabeça-vazia é confirmada e o equilíbrio é desligado; se o stop-loss for acionado, também é desligado.
Análise de vantagens
- O VWAP possui uma forte capacidade de rastreamento de tendências, combinado com a inicialização de um Brinks que pode determinar com precisão as tendências.
- A adição do Pivot Point como condição auxiliar pode filtrar muitas brechas falsas e evitar perdas desnecessárias.
- Adotar estratégias de saída parcial para bloquear parte dos lucros e controlar os riscos.
- A retrospectiva mostrou que a estratégia teve um excelente desempenho em um mercado de ações com alta estabilidade.
Análise de Riscos
- Em situações de turbulência, a falha de ruptura pode causar prejuízos.
- O Pivot Point não pode evitar completamente a falsa ruptura, mas precisa ser combinado com mais indicadores de filtragem.
- A saída de alguns jogadores aumentou a frequência das operações e também o custo das transações.
- O resultado não é o ideal em um mercado de ações, e é preciso ter um bom controle de riscos.
Direção de otimização
- Pode ser combinado com MACD, KDJ e outros indicadores para auxiliar na filtragem de sinais de entrada e saída.
- A combinação de parâmetros ótima pode ser encontrada através da optimização do comprimento e do desvio padrão da faixa de Bryn.
- Algoritmos de aprendizagem de máquina podem ser introduzidos para otimizar dinamicamente os parâmetros da faixa de Bryn.
- Pode-se testar diferentes níveis de perda para encontrar o ponto de perda ideal.
- Pode-se adicionar um mecanismo de adaptação de saída, ajustando o lucro-alvo de acordo com a volatilidade do mercado.
Resumir
Esta estratégia é, em geral, um sistema de ruptura estável. Sua forma de operação padronizada, o espaço de otimização de parâmetros é grande e adequado para a transação quantitativa.
Source
Pine
Strategy parameters
Related strategies
Comment
All comments (0)
No data
- 1