Estratégia de Breakout de Bandeira
Visão geral
A estratégia de ruptura de bandeira é uma estratégia de análise técnica que visa capturar o início de uma tendência, identificando o gráfico de bandeira e entrando no ponto de ruptura. A estratégia usa o indicador de avaliação auxiliar do ATR para avaliar o alcance da bandeira após a clara bandeira, para selecionar oportunidades de entrada.
Princípio da estratégia
A estratégia é dividida em várias etapas:
- Determinar a bandeira: o que é necessário para atingir a alta de inovação de preços e a ruptura do canal ATR.
- Determine a altura do mastro: mede a distância entre o topo do mastro e o SMA anterior.
- Determine o alcance da bandeira: o ponto mais baixo da bandeira é 33% da altura do mastro, como o alcance mínimo da bandeira.
- Determine o tipo de bandeira: determine se as 3 primeiras linhas K estão todas dentro da faixa da bandeira.
- Entradas: quando surgir uma bandeira.
- Saída: liquidação após 6 linhas de K mantidas.
Ao julgar o mastro e a bandeira, a estratégia usa habilmente o indicador ATR para julgar brechas evidentes e limita rigorosamente a altura da bandeira a 33% da altura do mastro, evitando excessos de falsos sinais. Além disso, julgar que 3 linhas K consecutivas constituem a bandeira é de alta confiabilidade. Em geral, as regras da estratégia são rigorosamente projetadas e têm uma certa vantagem em capturar brechas iniciais de tendências.
Análise de vantagens
A estratégia tem as seguintes vantagens:
- O uso de estruturas de bandeiras para determinar tendências é um método mais clássico na análise técnica, com uma maior taxa de sucesso.
- Os indicadores ATR e as restrições de alcance rigorosas evitam uma grande quantidade de falsos sinais e aumentam a precisão de entrada.
- O lançamento de 6 linhas K fixas pode bloquear parte dos lucros e evitar o risco de reversão da tendência.
- As regras da estratégia são claras, fáceis de implementar, de aprender e de seguir.
- A flexibilidade é melhor quando se procura oportunidades em diferentes situações.
Análise de Riscos
Os principais riscos da estratégia incluem:
- A situação é que os modelos de bandeiras não conseguem avaliar completamente as tendências, e há casos de fracasso.
- A 6a linha K é muito arbitrária e pode sair prematuramente.
- A situação é muito turbulenta e pode gerar falsas bandeiras.
- Não é possível controlar efetivamente a perda individual.
Para os riscos acima, podemos definir uma estratégia de stop loss, ou otimizar o mecanismo de saída, para obter lucro em tempo hábil quando o lucro atinge uma certa proporção. Além disso, podemos filtrar em combinação com outros indicadores, evitando falsos sinais quando o mercado está muito volátil.
Direção de otimização
A estratégia pode ser otimizada em várias direções:
- A combinação de MACD, KD e outros indicadores é usada para evitar falsos sinais em situações de tremores.
- Para que a estratégia seja mais adaptável, o multiplicador ATR, o período de jogo, etc., são parametrizados de acordo com a categoria de mercado.
- Estabeleça um stop loss móvel ou considere a retirada de ganhos em vez de uma partida dinâmica.
- Experimente métodos de aprendizado de máquina para encontrar características mais precisas para determinar a altura da bandeira.
- Avaliação da taxa de ganhos e perdas reais e ajuste dinâmico do tamanho da posição.
Resumir
Em geral, a estratégia de ruptura de bandeira usa a tendência de julgamento da forma tecnológica para começar, é um método mais clássico, a estratégia é realmente rigorosa no design das regras de entrada e pode filtrar uma grande quantidade de falsos sinais. No entanto, o controle de risco e o mecanismo de saída ainda têm espaço para otimização. Podemos considerar a estratégia de forma global para que ela funcione de forma estável em diferentes mercados.
/*backtest
start: 2024-01-22 00:00:00
end: 2024-02-21 00:00:00
period: 1h
basePeriod: 15m
exchanges: [{"eid":"Futures_Binance","currency":"BTC_USDT"}]
*/
// © smith26
//This strategy enters on a bull flag and closes position 6 bars later. Average true range is used instead of a moving average.
//The reason for ATR instead of MA is because with volatile securities, the flagpole must stand up a noticable "distance" above the trading range---which you can't determine with a MA alone.
//This is broken up into multiple parts: Defining a flagpole, defining the pole height, and defining the flag, which will be constrained to the top third (33%) of the pole height to be considered a flag.
//@version=4
strategy("Bull Flag v1.00", overlay=true)
ATR = atr(10) //Average True Range over last 10 bars.
upperATR = ohlc4[1] + ATR[1] //Open + High + Low + Close divided by 4, + prior ATR. Just used here for visually plotting the ATR upper channel.
lowerATR = ohlc4[1] - ATR[1] //Open + High + Low + Close divided by 4, - prior ATR. Just used here for visually plotting the ATR lower channel.
//uncomment these two lines to see ATR channels
plot(upperATR, color=color.orange)
plot (lowerATR, color=color.orange)
//Current close higher than previous close, and current close minus current open is greater than 3 times the previous ATR. "3x ATR" is chosen because any less was not a noticeable distance above the trading range.
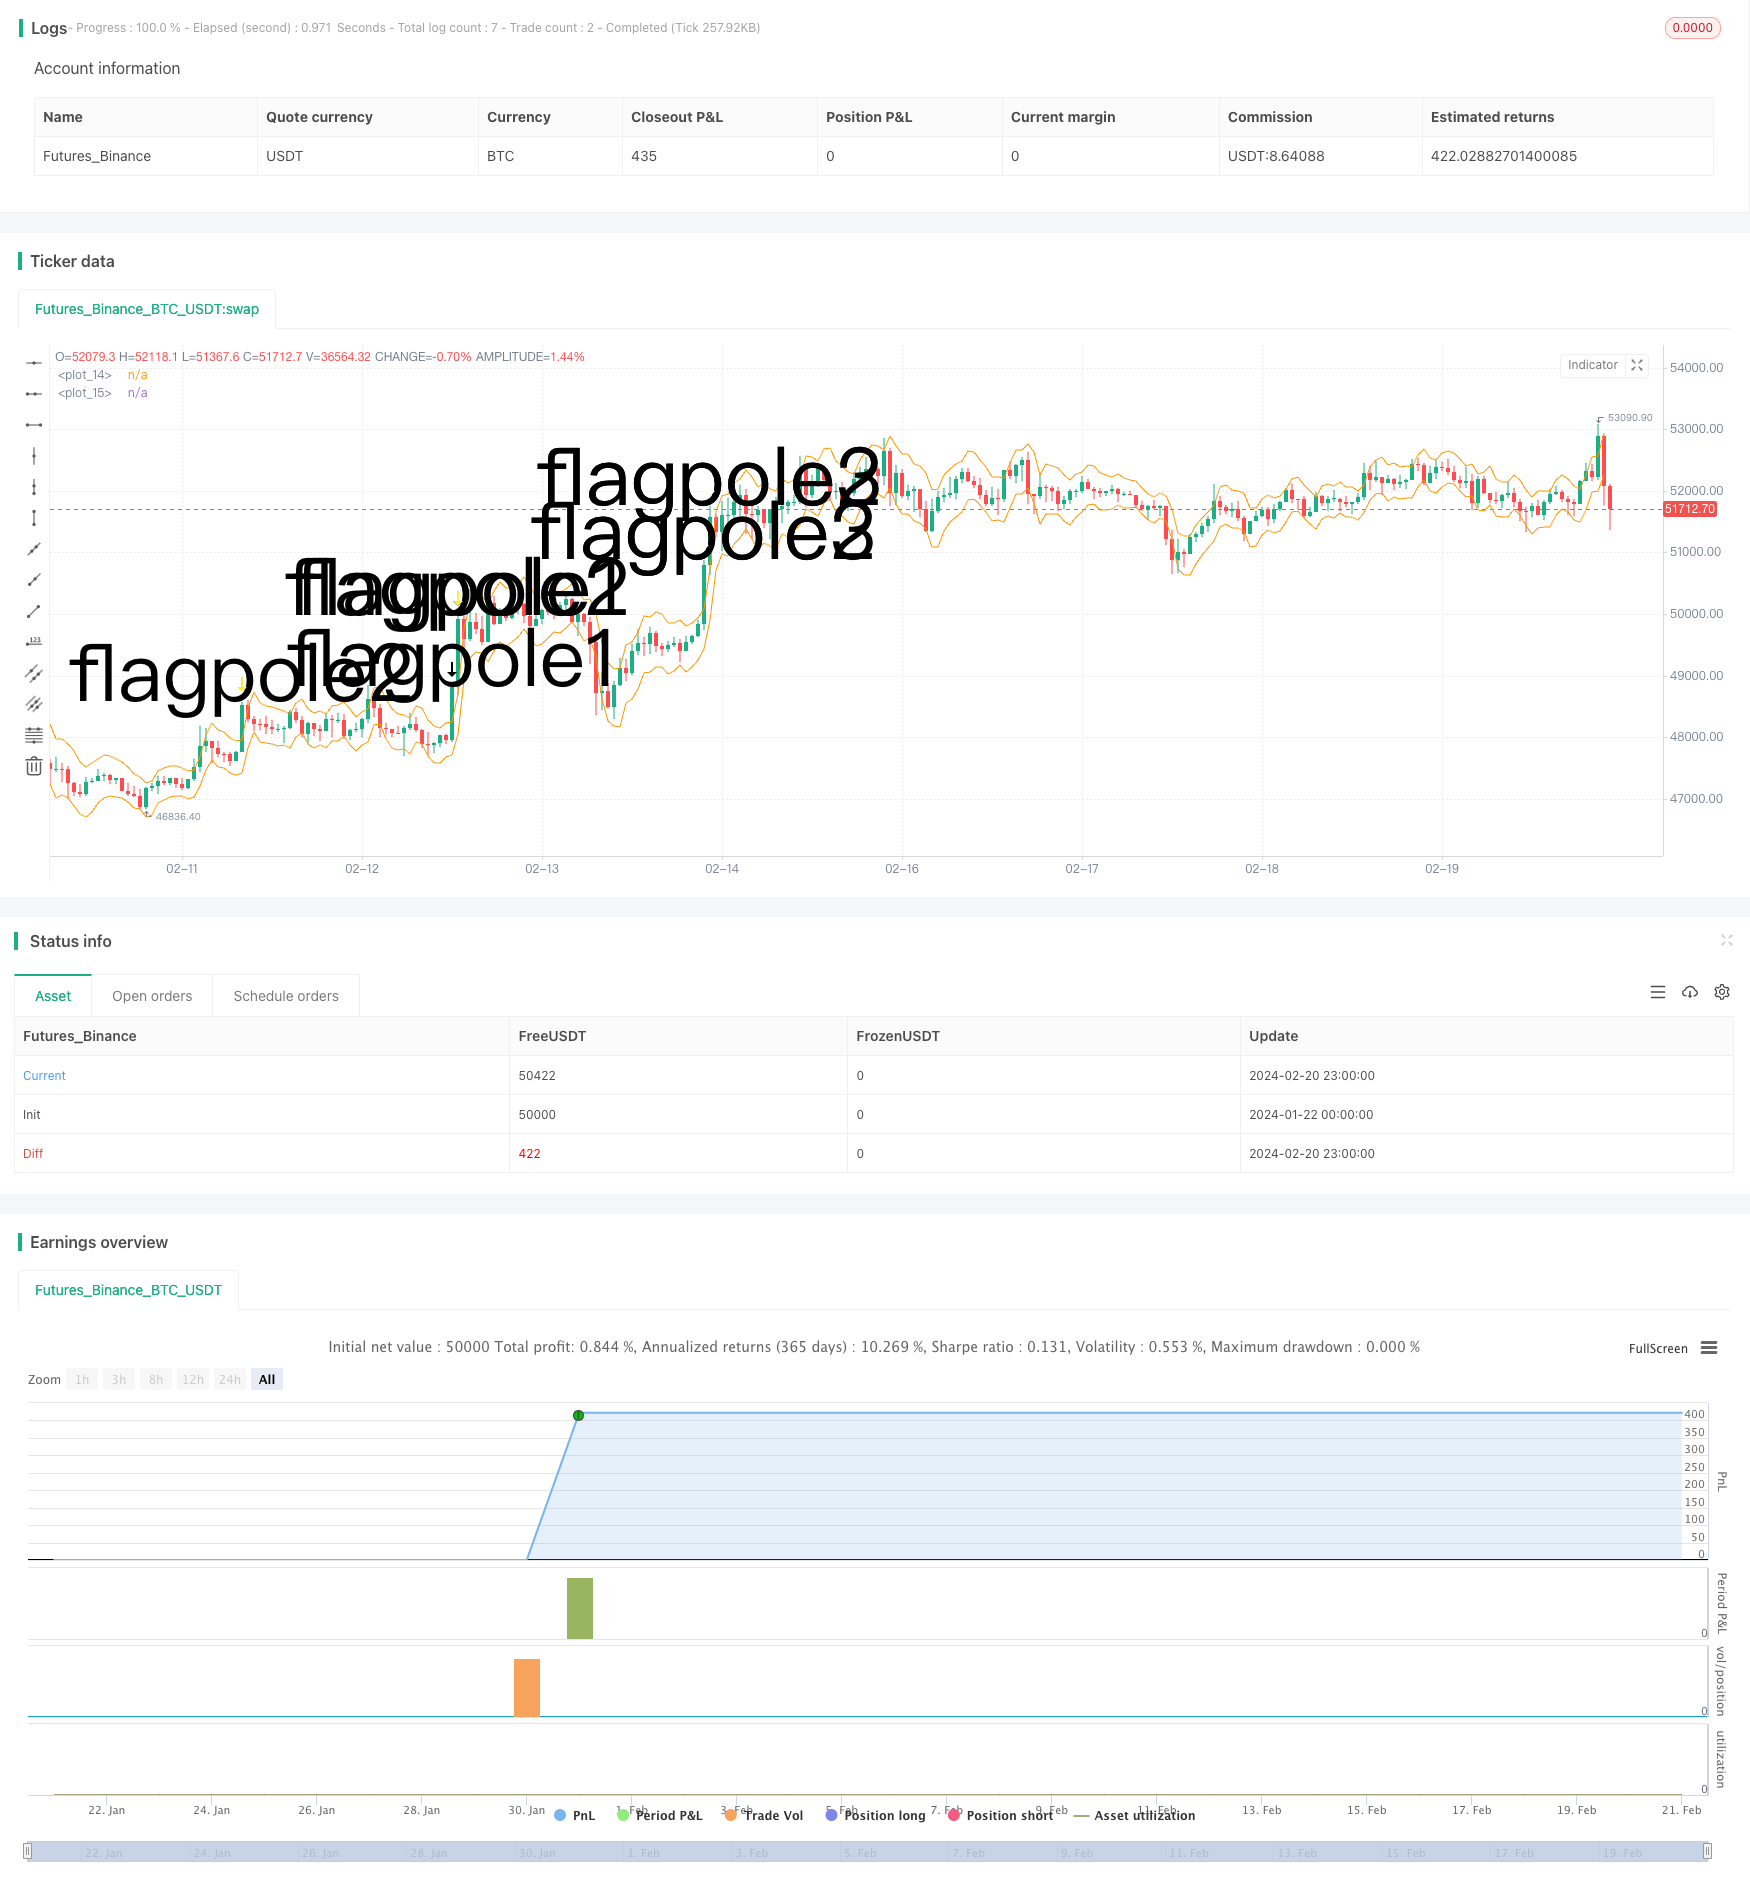
flagpole1 = close>close[1] and (close-open) > (ATR[1] * 3)
plotshape(flagpole1, text="flagpole1", style=shape.arrowdown, size=size.huge) //Plots an arrow for flagpole1 for QA testing
//Two consecutive close higer than their previous close, and current close minus PREVIOUS open is greater than 3 times the previous ATR.
flagpole2 = close>close[1] and close[1]>close[2] and (close-open[1]) > (ATR[1] * 3)
plotshape(flagpole2, text="flagpole2", style=shape.arrowdown, size=size.huge, color=color.yellow) //Plots an arrow for flagpole2 for QA testing
//Three consecutive close higer than their previous close, and current close minus open from 2 bars ago is greater than 3 times the previous ATR.
flagpole3 = close>close[1] and close[1]>close[2] and close[2]>close[3] and (close-open[2]) > (ATR[1] * 3)
plotshape(flagpole3, text="flagpole3", style=shape.arrowdown, size=size.huge, color=color.white) //Plots an arrow for flagpole3 for QA testing
//A flagpole can be any of the three definitions of flagpole.
flagpole = flagpole1 or flagpole2 or flagpole3
//This will return the number of bars since "flagpole" was true. Not being used, but could be useful.
//since_flagpole = barssince(flagpole)
after_pole_1 = flagpole[1] //This marks the bar directly after a flagpole.
//plotshape(after_pole_1, text="after_pole_1", style=shape.cross, size=size.large, color=color.white) //Plots a cross for after_pole_1 for QA testing
after_pole_2 = flagpole[2] //This marks the bar two bars after a flagpole.
after_pole_3 = flagpole[3] //This marks the bar three bars after a flagpole.
//This returns the price at the "top" of the flagpole (using close price) at the most recent occurence, 0.
pole_top = valuewhen(flagpole, close, 0)
//plot(pole_top, trackprice=true) //plots a horizontal line at the most recent pole_top
//Measures the distance between last pole top and the previous SMA.
pole_height = pole_top - sma(close, 10)[1]
//plot(pole_height)
//This marks 33% below the pole_top, which will be the lowest point a flag can be.
flag_bottom = pole_top - (.33 * pole_height)
//plot(flag_bottom)
//The first, second, and third bars after the pole are considered part of a flag when open and close are between the pole_top and flag_bottom
flag1 = after_pole_1 and (open >= flag_bottom) and (open <= pole_top) and (close >= flag_bottom) and (close <= pole_top)
//plotshape(flag1, text="flag1", style=shape.flag, size=size.large, color=color.teal)
flag2 = after_pole_2 and (open >= flag_bottom) and (open <= pole_top) and (close >= flag_bottom) and (close <= pole_top)
//plotshape(flag2, text="flag2", style=shape.flag, size=size.large, color=color.teal)
flag3 = after_pole_3 and (open >= flag_bottom) and (open <= pole_top) and (close >= flag_bottom) and (close <= pole_top)
//plotshape(flag3, text="flag3", style=shape.flag, size=size.large, color=color.teal)
//When all three bars after a flagpole are a flag, the criteria are met and we have a "bull_flag"
//Specifically, when current bar is flag3, previous bar is flag2, and 2 bars ago is flag1, we have a bull_flag.
bull_flag = flag3 and flag2[1] and flag1[2]
plotshape(bull_flag, text="bull_flag", style=shape.flag, size=size.large, color=color.white) //Plots a flag for bull_flag for QA testing
if (bull_flag)
strategy.entry("Long", strategy.long)
if barssince(bull_flag) == 6 //close 6 bars after entry.
strategy.close("Long")