Стратегия тройного SuperTrend и Stoch RSI

Обзор
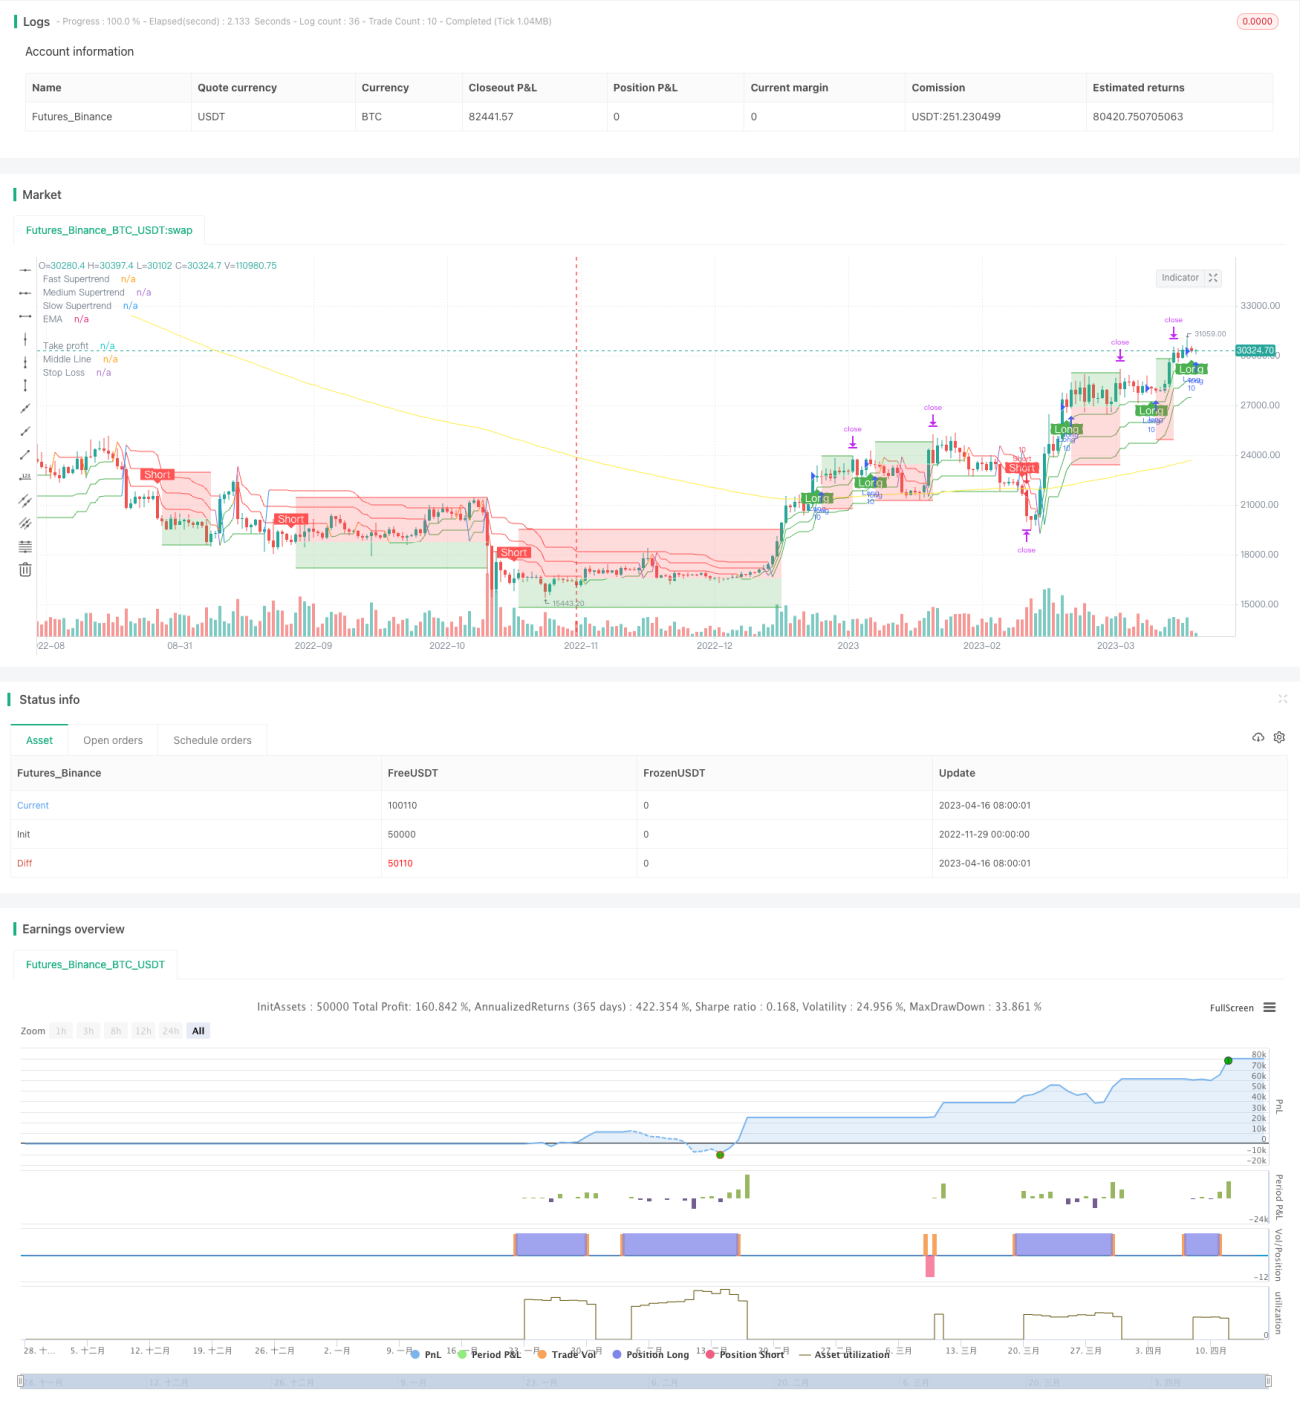
Стратегия «Тройной SuperTrend и Stoch RSI» представляет собой количественную торговую стратегию, объединяющую следование за трендом и индикаторы перекупленности/перепроданности на нескольких таймфреймах. Стратегия использует три индикатора SuperTrend с различными настройками для определения рыночного тренда и сигналы перекупленности/перепроданности от индикатора Stoch RSI для генерации торговых сигналов. В практическом применении, когда два более быстрых индикатора SuperTrend одновременно подают сигнал на покупку/продажу, и этот сигнал подтверждается индикатором Stoch RSI, стратегия открывает соответствующую длинную/короткую позицию.
Принцип стратегии
Основная логика стратегии «Тройной SuperTrend и Stoch RSI» заключается в комбинировании индикаторов SuperTrend с различными параметрами и индикатора Stoch RSI для фильтрации торговых сигналов, что повышает качество сигналов и снижает количество ложных.
Во-первых, стратегия использует три набора индикаторов SuperTrend с разными параметрами для определения основного рыночного тренда. Эти три набора имеют разные настройки и временные рамки – от быстрых до медленных – чтобы улавливать изменения тренда на разных уровнях. Когда самый быстрый и второй по скорости индикаторы SuperTrend одновременно подают сигнал на покупку/продажу, мы предварительно считаем этот сигнал достаточно надежным.
Во-вторых, стратегия вводит индикатор Stoch RSI для оценки того, является ли сигнал чрезмерно перекупленным или перепроданным. Stoch RSI сочетает преимущества RSI и стохастического осциллятора, эффективно определяя состояние перекупленности или перепроданности рынка. Если сигналы от самого быстрого и второго по скорости SuperTrend совпадают с сигналом Stoch RSI, мы выдаем окончательный сигнал на покупку/продажу.
Благодаря комбинации нескольких индикаторов и таймфреймов, стратегия «Тройной SuperTrend и Stoch RSI» эффективно фильтрует рыночный шум, повышает надежность сигналов и уменьшает количество ошибочных сделок.
Преимущества стратегии
Главное преимущество стратегии «Тройной SuperTrend и Stoch RSI» заключается в эффективном сочетании нескольких индикаторов и таймфреймов, что приносит следующие выгоды:
- Снижение количества ложных торговых сигналов. Комбинация трех индикаторов SuperTrend и Stoch RSI значительно уменьшает шумовые и ошибочные сигналы, присущие отдельным индикаторам.
- Повышение доли прибыльных сигналов. Хотя частота сигналов снижается, доля прибыльных сигналов заметно возрастает.
- Подходит для трендовых рынков. Многотаймфреймовая фильтрация помогает улавливать средне- и долгосрочные тренды, что особенно эффективно в условиях выраженного тренда.
- Легко оптимизируется через подбор параметров. Тройной набор индикаторов предоставляет широкие возможности для оптимизации параметров.
- Настраивается под индивидуальный стиль торговли. Параметры можно свободно регулировать, адаптируя стратегию к своему стилю.
Риски стратегии
Стратегия «Тройной SuperTrend и Stoch RSI» также несет определенные риски, которые сосредоточены в следующих аспектах:
- Снижение частоты сигналов. Многоуровневая фильтрация приводит к заметному уменьшению частоты сделок.
- Возможность пропуска некоторых сигналов. Консервативность стратегии может привести к упущению части потенциальных возможностей.
- Увеличение зависимости от параметров. Чем больше индикаторов и параметров, тем сложнее оптимизация стратегии.
- Ограниченная способность следовать за трендом. Комбинация разных таймфреймов также ограничивает гибкость следования за трендом.
Для снижения указанных рисков можно корректировать параметры индикаторов, вводить дополнительные вспомогательные индикаторы и другими способами оптимизировать стратегию, чтобы при контроле рисков получать более высокое качество прибыли.
Направления оптимизации стратегии
Стратегия «Тройной SuperTrend и Stoch RSI» имеет потенциал для дальнейшей оптимизации, в основном по следующим направлениям:
- Настройка комбинаций параметров индикаторов для поиска оптимального соответствия. Можно протестировать больше сочетаний параметров индикаторов, чтобы найти наилучшие.
- Добавление стоп-лосса и тейк-профита для контроля риска по каждой сделке. Это значительно повысит стабильность стратегии.
- Введение дополнительных индикаторов для подтверждения сигналов. Например, использование индикаторов объема для многосторонней оценки.
- Добавление функции адаптации. Стратегия может автоматически оптимизировать и настраивать параметры, подстраиваясь под изменения рынка.
- Комбинирование с алгоритмами машинного обучения для прогнозирования. Использование ИИ для предсказания точности сигналов индикаторов.
Благодаря непрерывной оптимизации стратегия «Тройной SuperTrend и Stoch RSI» может стать стабильной и эффективной количественной торговой стратегией, приносящей значительную альфу.
Заключение
Стратегия «Тройной SuperTrend и Stoch RSI» успешно объединила многотаймфреймовый анализ с оценкой перекупленности/перепроданности, сформировав уникальную стратегию следования за трендом. Она сохраняет как преимущества следования за трендом, так и фильтрацию индикаторов, одновременно снижая шумовые сигналы и повышая долю прибыльных. Несмотря на существующие риски и возможности для оптимизации, путем настройки параметров и улучшения стратегии можно дополнительно повысить ее прибыльность и стабильность. В целом, стратегия «Тройной SuperTrend и Stoch RSI» предоставляет качественный выбор для практики количественной торговли.
- 1