Стратегия прорыва скользящей средней Triple Supertrend
Обзор
Тройная сверхтяжелая среднелинейная стратегия - это наиболее распространенная стратегия, использующая сверхтяжелую среднюю линию с несколькими параметрами и EMA, определяющими тренд, для определения направления тенденции и совершения торгов. Основная идея этой стратегии заключается в том, чтобы создать многоголовую линию, когда по крайней мере две сверхтяжелые среднелинейные линии находятся в пустом состоянии выше EMA, определяющей большую тенденцию; создать пустую линию, когда по крайней мере две сверхтяжелые среднелинейные линии находятся в пустом состоянии ниже EMA, определяющей большую тенденцию.
Стратегический принцип
Стратегия определяет позиции на позиции и позиции на позиции, устанавливая среднюю линию сверхтенденции с тремя различными параметрами и EMA, определяющей направление большого тренда:
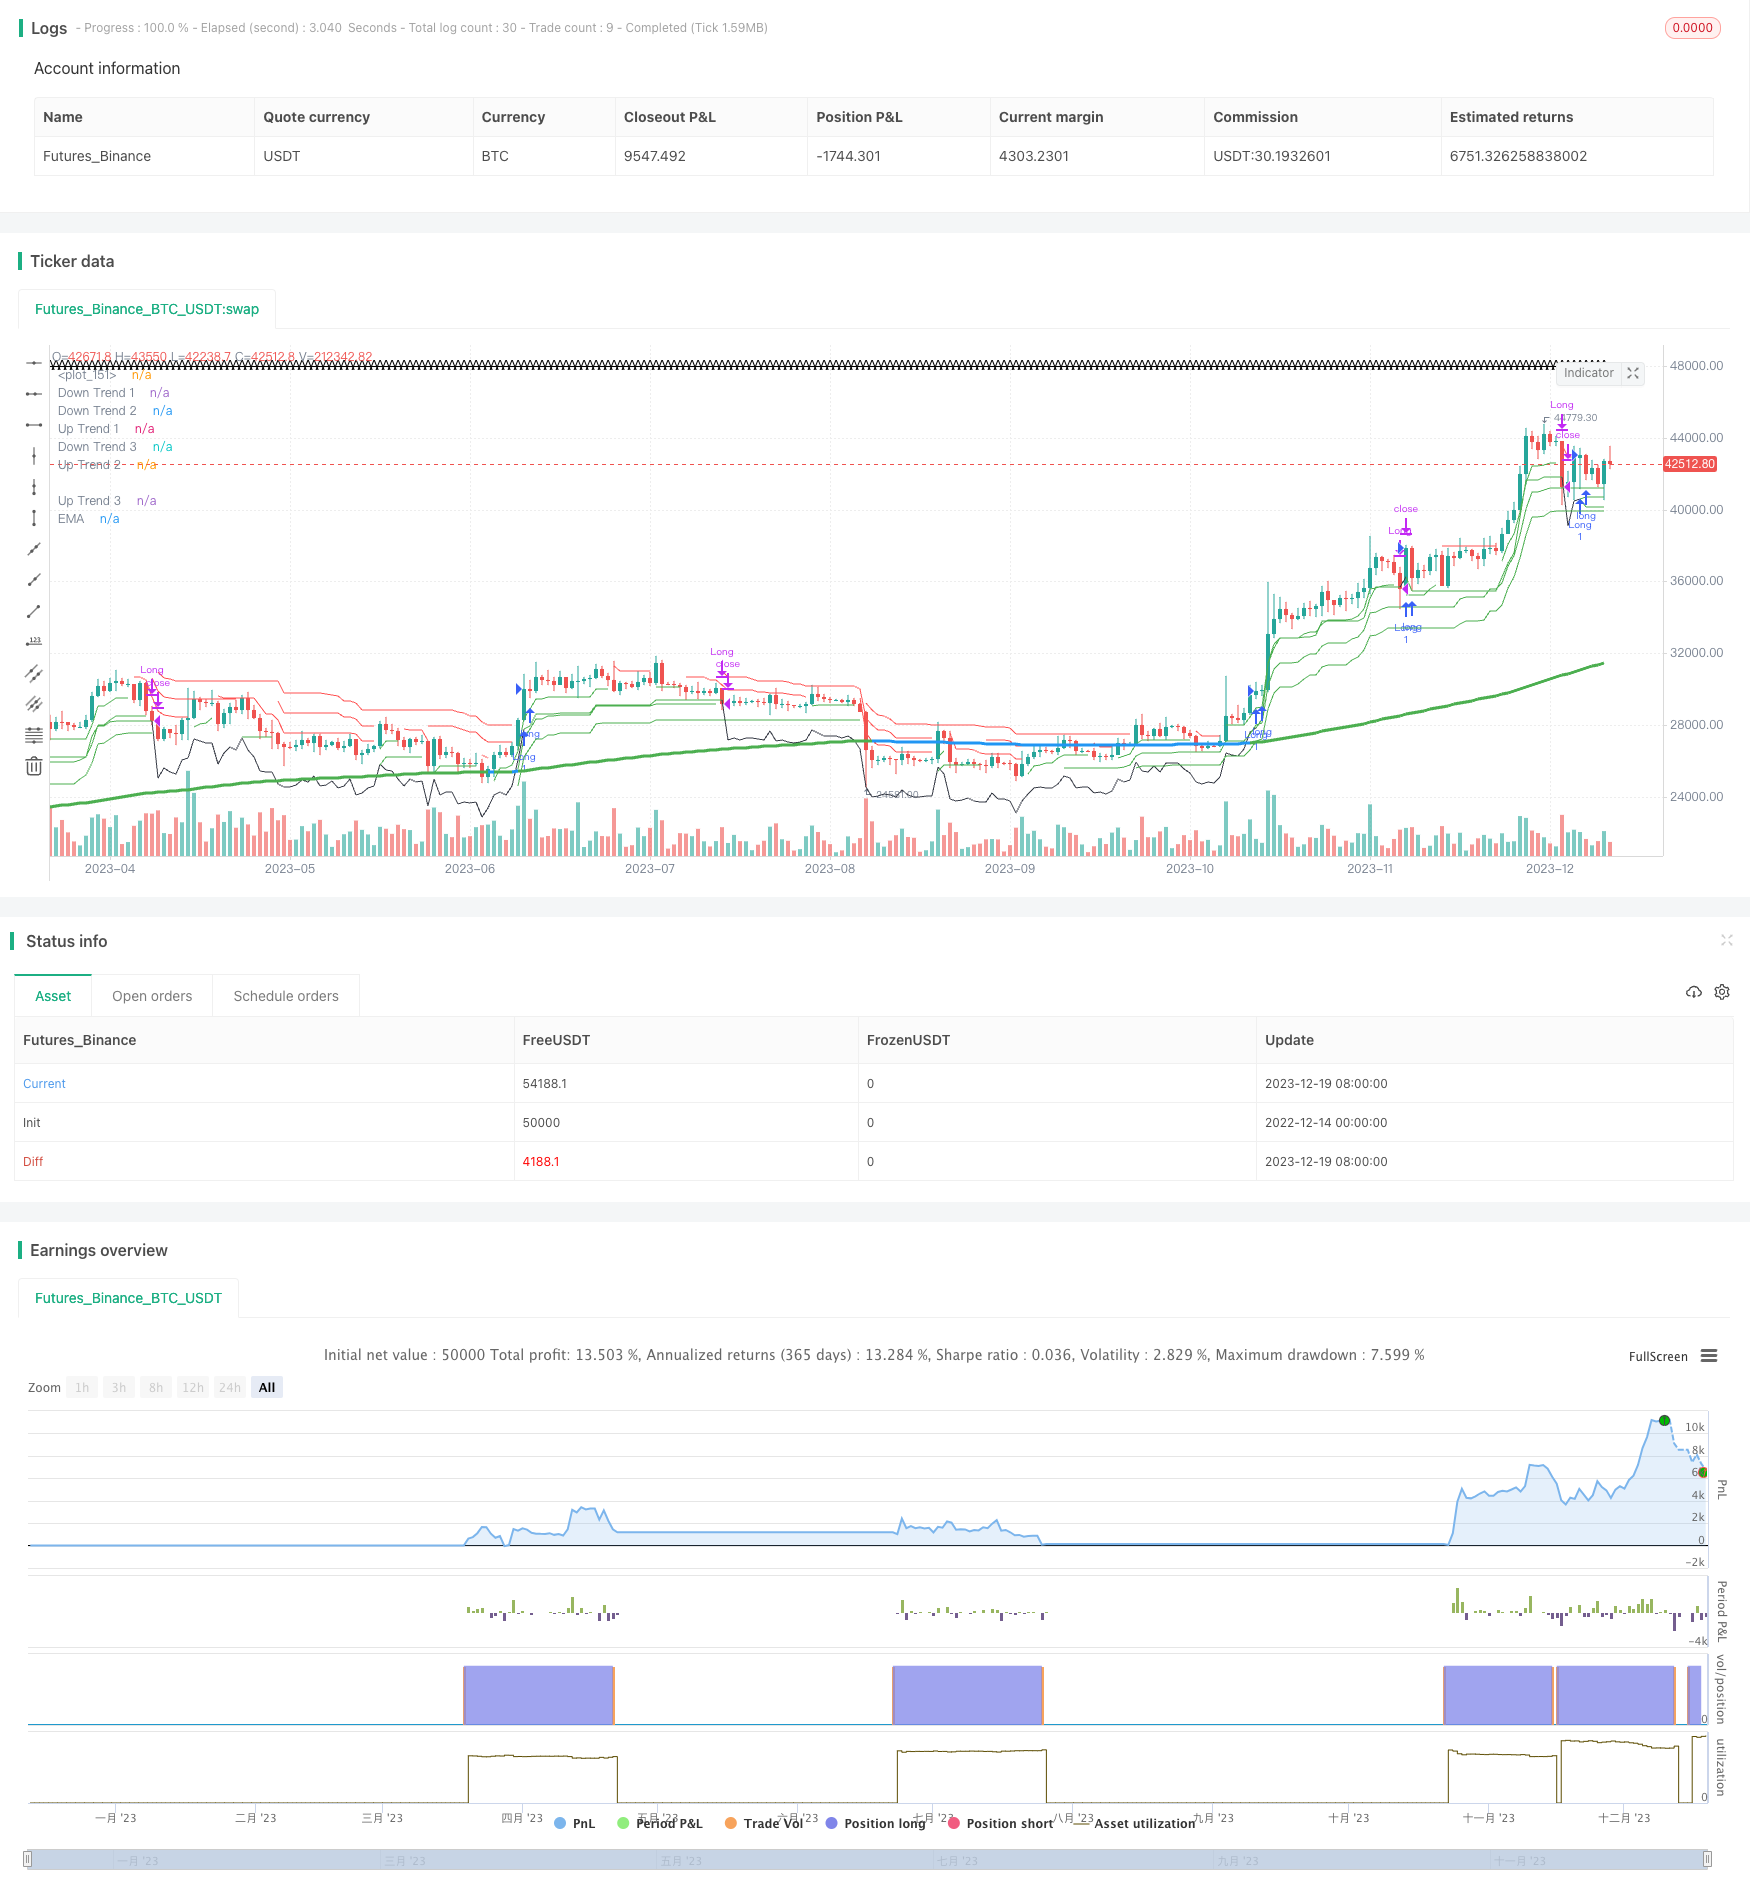
Установка трех сверхтрендовых средних линий supertrend1, supertrend2 и supertrend3, цвета зеленый означает повышающий тренд, красный - понижающий тренд.
Для определения большого тренда используется EMA с гладкой скользящей средней (ematrend), которая определяется как большое плюсовое движение, когда все три сверхтройные средние линии выше этой EMA, и, наоборот, как пустое движение.
Когда по крайней мере две сверхтяжелые средние линии на большом диске показывают одновременно многоголовый (зеленый) сигнал, то есть, если значение направления меньше 0, то это считается многоголовым сигналом; когда по крайней мере две сверхтяжелые средние линии на большом диске показывают одновременно пустой (красный) сигнал, то есть, если значение направления больше 0, то это считается пустым сигналом.
Затем, по сигналу, открыть позицию, чтобы сделать больше / сделать меньше.
Установка стоп-лосса. Установка фиксированного стоп-лосса - это коэффициент возврата риска, то есть коэффициент убытков; установка мобильного стоп-лосса - это коэффициент убытков, то есть ATR.
При снятии или остановке сделанных сделок.
Анализ преимуществ
Эта стратегия имеет следующие преимущества:
Используя тройную сверхтяжелую среднюю линию в сочетании с трендовым определением EMA, можно эффективно идентифицировать сигнал тренда.
Правила многопространственного условного суждения ясны, легко понятны и реализуемы.
Настройка мобильных стоп-паролей и фиксированных стоп-паролей для эффективного управления рисками.
В зависимости от необходимости можно корректировать гиперпараметры и оптимизировать стратегию.
Анализ рисков
Однако эта стратегия также несет в себе определенные риски:
Неправильная настройка гиперпараметров может привести к упущению хороших торговых возможностей. Можно тестировать различные ATR-циклы, ATR-множества, EMA-циклические параметры.
Вероятность прорыва существует, но ее можно снизить, скорректировав параметры гиперпробива.
Слишком мягкая установка стоп-лома или стоп-стоп увеличивает вероятность потери. Стоп-лома следует соответственно сузить.
Отзывные данные могут привести к проблемам с пересхождением. Следует обратить внимание на многорыночные многоциклические тесты.
Направление оптимизации
Эта стратегия может быть оптимизирована в следующих аспектах:
Тестирование оптимальных комбинаций сверхпараметров. Можно комбинировать тестирование различных ATR-циклов, ATR-множеств, EMA-средних циклов, чтобы найти оптимальные параметры.
Добавление разновидностей сделок. Для проверки эффективности стратегии можно добавить различные разновидности, такие как акции, цифровые валюты.
В сочетании с другими индикаторами фильтруйте сигналы. Например, можно добавить такие индикаторы, как RSI, MACD, чтобы избежать неправильного чтения трендовых сигналов.
Оптимизация механизмов остановки убытков. Можно тестировать методы остановки, которые отслеживают убытки, или убытки, основанные на изменениях ATR / волатильности.
Подвести итог
Тройная сверхтройная средняя линия взлома является более простой и практичной стратегией отслеживания тенденций. Она одновременно сочетает в себе несколько сверхтройных средних линий и трендовые оценки EMA для выявления возможностей и эффективного управления рисками.
/*backtest
start: 2022-12-14 00:00:00
end: 2023-12-20 00:00:00
period: 1d
basePeriod: 1h
exchanges: [{"eid":"Futures_Binance","currency":"BTC_USDT"}]
*/

// @version=5
// author=theasgard and moonshot-indicator (ms)
// year 2021
//
// This is a well knowen strategy by using 3 different Supertrends and a trend-defining EMA,
// feel free to play around with the settings, a backtest on 8h ETHUSDT pair brought some good results using
// the 233EMA and investing 75% of a 10k start capital
//
// the idea is to have at least 2 supertrnds going green above the trend-EMA to go long and exit by turning
// 2 supertrends red (idea: 1 supertrend in red could initialize a take profit)
// shorts work vice versa
// The EMA shows in green for uptrends and in red for downtrends, if it is blue no Signal will be taken because
// the 3 supertrends are not all above or below the trendline(EMA)
//
// Update 1:
// Fixed a minor input error
// Added ATR stoploss, and commented out the percentage stop loss
// Added time window to backtest
// Added exit on risk/revard is met
// This version is only buy...wait for next update adding shorts

strategy("ms hypertrender", overlay=true)

// set up 3 supertrendlines and colour the direction up/down
atrPeriod1 = input(10, "ATR Length 1")
factor1 = input.float(1.0, "ATR Factor 1", step = 0.01)
[supertrend1, direction1] = ta.supertrend(factor1, atrPeriod1)
upTrend1 = plot(direction1 < 0 ? supertrend1 : na, "Up Trend 1", color = color.green, style=plot.style_linebr)
downTrend1 = plot(direction1 < 0? na : supertrend1, "Down Trend 1", color = color.red, style=plot.style_linebr)

atrPeriod2 = input(11, "ATR Length 2")
factor2 = input.float(2.0, "ATR Factor 2", step = 0.01)
[supertrend2, direction2] = ta.supertrend(factor2, atrPeriod2)
upTrend2 = plot(direction2 < 0 ? supertrend2 : na, "Up Trend 2", color = color.green, style=plot.style_linebr)
downTrend2 = plot(direction2 < 0? na : supertrend2, "Down Trend 2", color = color.red, style=plot.style_linebr)

atrPeriod3 = input(12, "ATR Length 3")
factor3 = input.float(3.0, "ATR Factor 3", step = 0.01)
[supertrend3, direction3] = ta.supertrend(factor3, atrPeriod3)
upTrend3 = plot(direction3 < 0 ? supertrend3 : na, "Up Trend 3", color = color.green, style=plot.style_linebr)
downTrend3 = plot(direction3 < 0? na : supertrend3, "Down Trend 3", color = color.red, style=plot.style_linebr)

//set up the trend dividing EMA and color uptrend nutreal downtrend
len = input.int(233, minval=1, title="Trend-EMA Length")
src = input(close, title="Source")
offset = input.int(title="Offset", defval=0, minval=-500, maxval=500)

//general Bull or Bear Trend? Visualized by ema
ematrend = ta.ema(src, len)
generaluptrend = supertrend1 > ematrend and supertrend2 > ematrend and supertrend3 > ematrend
generaldowntrend = supertrend1 < ematrend and supertrend2 < ematrend and supertrend3 < ematrend
emacolor = if generaluptrend
    color.green
else if generaldowntrend
    color.red
else
    color.blue
plot(ematrend, title="EMA", color=emacolor, linewidth=3, offset=offset)

// Bullish? min 2 supertrends green
bullish = (direction1 < 0 and direction2 < 0) or (direction1 < 0 and direction3 < 0) or (direction2 < 0 and direction3 < 0) and generaluptrend
extremebullish = direction1 < 0 and direction2 < 0 and direction3 < 0 and generaluptrend //all 3 green

// Bearish? min 2 supertrends red
bearish = (direction1 > 0 and direction2 > 0) or (direction1 > 0 and direction3 > 0) or (direction2 > 0 and direction3 > 0) and generaldowntrend
extremebearish = direction1 > 0 and direction2 > 0 and direction3 > 0 and generaldowntrend //all 3 red

// Open Long
//plotchar(((bullish and not bullish[1]) or (extremebullish and not extremebullish[1])) and (emacolor==color.green)? close : na, title = 'Start Long', char='▲', color = #80eb34, location = location.belowbar, size = size.small)

// TP 10% Long
TP10long = ((generaluptrend and bullish[1]) or (generaluptrend and extremebullish[1])) and (direction1 > 0 or direction2 > 0 or direction3 > 0)
//plotchar(TP10long and not TP10long[1]? close : na, title = 'TP on Long', char='┼', color = #ffd000, location = location.abovebar, size = size.tiny)

// Exit Long
//plotchar(extremebearish and not extremebearish[1] or bearish and not bearish[1]? close : na, title = 'Close all Longs', char='Ꭓ', color = #ff0037, location = location.abovebar, size = size.tiny)
stopsupertrendup = if supertrend1 < supertrend2 and supertrend1 < supertrend3
    (supertrend1)
else if supertrend2 < supertrend1 and supertrend2 < supertrend3
    (supertrend2)
else if supertrend3 < supertrend1 and supertrend3 < supertrend2
    (supertrend3)
lowestLows = ta.lowest(low, 1)
// Open Short
//plotchar(((bearish and not bearish[1]) or (extremebearish and not extremebearish[1])) and (emacolor==color.red)? close : na, title = 'Start Short', char='▼', color = #0547e3, location = location.abovebar, size = size.small)

// TP 10% Short
TP10short = ((generaldowntrend and bearish[1]) or (generaldowntrend and extremebearish[1])) and (direction1 < 0 or direction2 < 0 or direction3 < 0)
//plotchar(TP10short and not TP10short[1]? close : na, title = 'TP on Short', char='┼', color = #ffd000, location = location.belowbar, size = size.tiny)

// Exit Short
//plotchar(extremebullish and not extremebullish[1] or bullish and not bullish[1]? close : na, title = 'Close all Shorts', char='Ꭓ', color = #ff0037, location = location.belowbar, size = size.tiny)
stopsupertrenddown = if supertrend1 > supertrend2 and supertrend1 > supertrend3
    (supertrend1)
else if supertrend2 > supertrend1 and supertrend2 > supertrend3
    (supertrend2)
else if supertrend3 > supertrend1 and supertrend3 > supertrend2
    (supertrend3)
highestHighs = ta.highest(high,1)
// Set stop loss level with input options (optional)
//longLossPerc = input.float(title="Long Stop Loss (%)",
//     minval=0.0, step=0.1, defval=1) * 0.01

//shortLossPerc = input.float(title="Short Stop Loss (%)",
//     minval=0.0, step=0.1, defval=1) * 0.01

// Determine stop loss price
//longStopPrice  = strategy.position_avg_price * (1 - longLossPerc)
//shortStopPrice = strategy.position_avg_price * (1 + shortLossPerc)

openlong = (extremebullish and not extremebullish[1]) and (emacolor==color.green)//(((bullish and not bullish[1]) or
openshort = (extremebearish and not extremebearish[1]) and (emacolor==color.red)//(((bearish and not bearish[1]) or
exitlong = lowestLows<(stopsupertrendup - ((stopsupertrendup / 100) * 0.1)) //(extremebearish and not extremebearish[1] or bearish and not bearish[1]) or TP10long or
exitshort = highestHighs>(stopsupertrenddown - ((stopsupertrenddown / 100) * 0.1)) //(extremebullish and not extremebullish[1] or bullish and not bullish[1]) or TP10short
//strategy.entry("buy", strategy.long, when=openlong)
//strategy.entry("sell", strategy.short, when=openshort)

//strategy.close("buy", when=exitlong)
//strategy.close("sell", when=exitshort)

// Submit exit orders based on calculated stop loss price
//if (strategy.position_size > 0)
//    strategy.exit(id="Long Stop", stop=longStopPrice)

//if (strategy.position_size < 0)
//    strategy.exit(id="Short Stop", stop=shortStopPrice)

backtest_timeframe_start = input(defval = timestamp("01 Apr 2016 13:30 +0000"), title = "Backtest Start Time")
USE_ENDTIME = input(false,title="Define the ending period for backtests (If false, will test up to most recent candle)")
backtest_timeframe_end = input(defval = timestamp("19 Mar 2021 19:30 +0000"), title = "Backtest End Time")
TARGET_PROFIT_MODE = input(false,title="Exit when Risk:Reward met")
REWARD_RATIO = input(3,title="Risk:[Reward] (i.e. 3) for exit")
// Trailing stop loss {
TSL_ON = input(true,title="Use trailing stop loss")
var entry_price = float(0)
ATR_multi_len = 26
ATR_multi = input(2, "ATR multiplier for stop loss")
ATR_buffer = ta.atr(ATR_multi_len) * ATR_multi
plotchar(ATR_buffer, "ATR Buffer", "A", location = location.top)
risk_reward_buffer = (ta.atr(ATR_multi_len) * ATR_multi) * REWARD_RATIO
take_profit_long = low > entry_price + risk_reward_buffer
take_profit_short = low < entry_price - risk_reward_buffer
var trailing_SL_buffer = float(0)
var stop_loss_price = float(0)
stop_loss_price := math.max(stop_loss_price, close - trailing_SL_buffer)
// plot TSL line
trail_profit_line_color = color.green
if strategy.position_size == 0  or not TSL_ON
    trail_profit_line_color := color.black
    stop_loss_price := close - trailing_SL_buffer
plot(stop_loss_price,color=trail_profit_line_color)
// }

if true
    buy_condition = openlong
    exit_condition = exitlong
    //ENTRY:
    if buy_condition
        if strategy.position_size == 0
            entry_price := close
            trailing_SL_buffer := ATR_buffer
            stop_loss_price := close - ATR_buffer

        msg = "entry"
        if strategy.position_size > 0
            msg := "pyramiding"
        strategy.entry("Long",strategy.long, comment=msg)

    //EXIT:
    // Case (A) hits trailing stop
    if TSL_ON and strategy.position_size > 0 and close <= stop_loss_price
        if close > entry_price
            strategy.close("Long", comment="take profit [trailing]")
        else if close <= entry_price
            strategy.close("Long", comment="stop loss")
    // Case (B) take targeted profit relative to risk
    if strategy.position_size > 0 and TARGET_PROFIT_MODE
        if take_profit_long
            strategy.close("Long", comment="take profits [risk:reward]")
    // Case (C)
    if strategy.position_size > 0 and exit_condition
        if take_profit_long
            strategy.close("Long", comment="exit[rsi]")