Количественная трендовая стратегия, объединяющая несколько факторов
Обзор
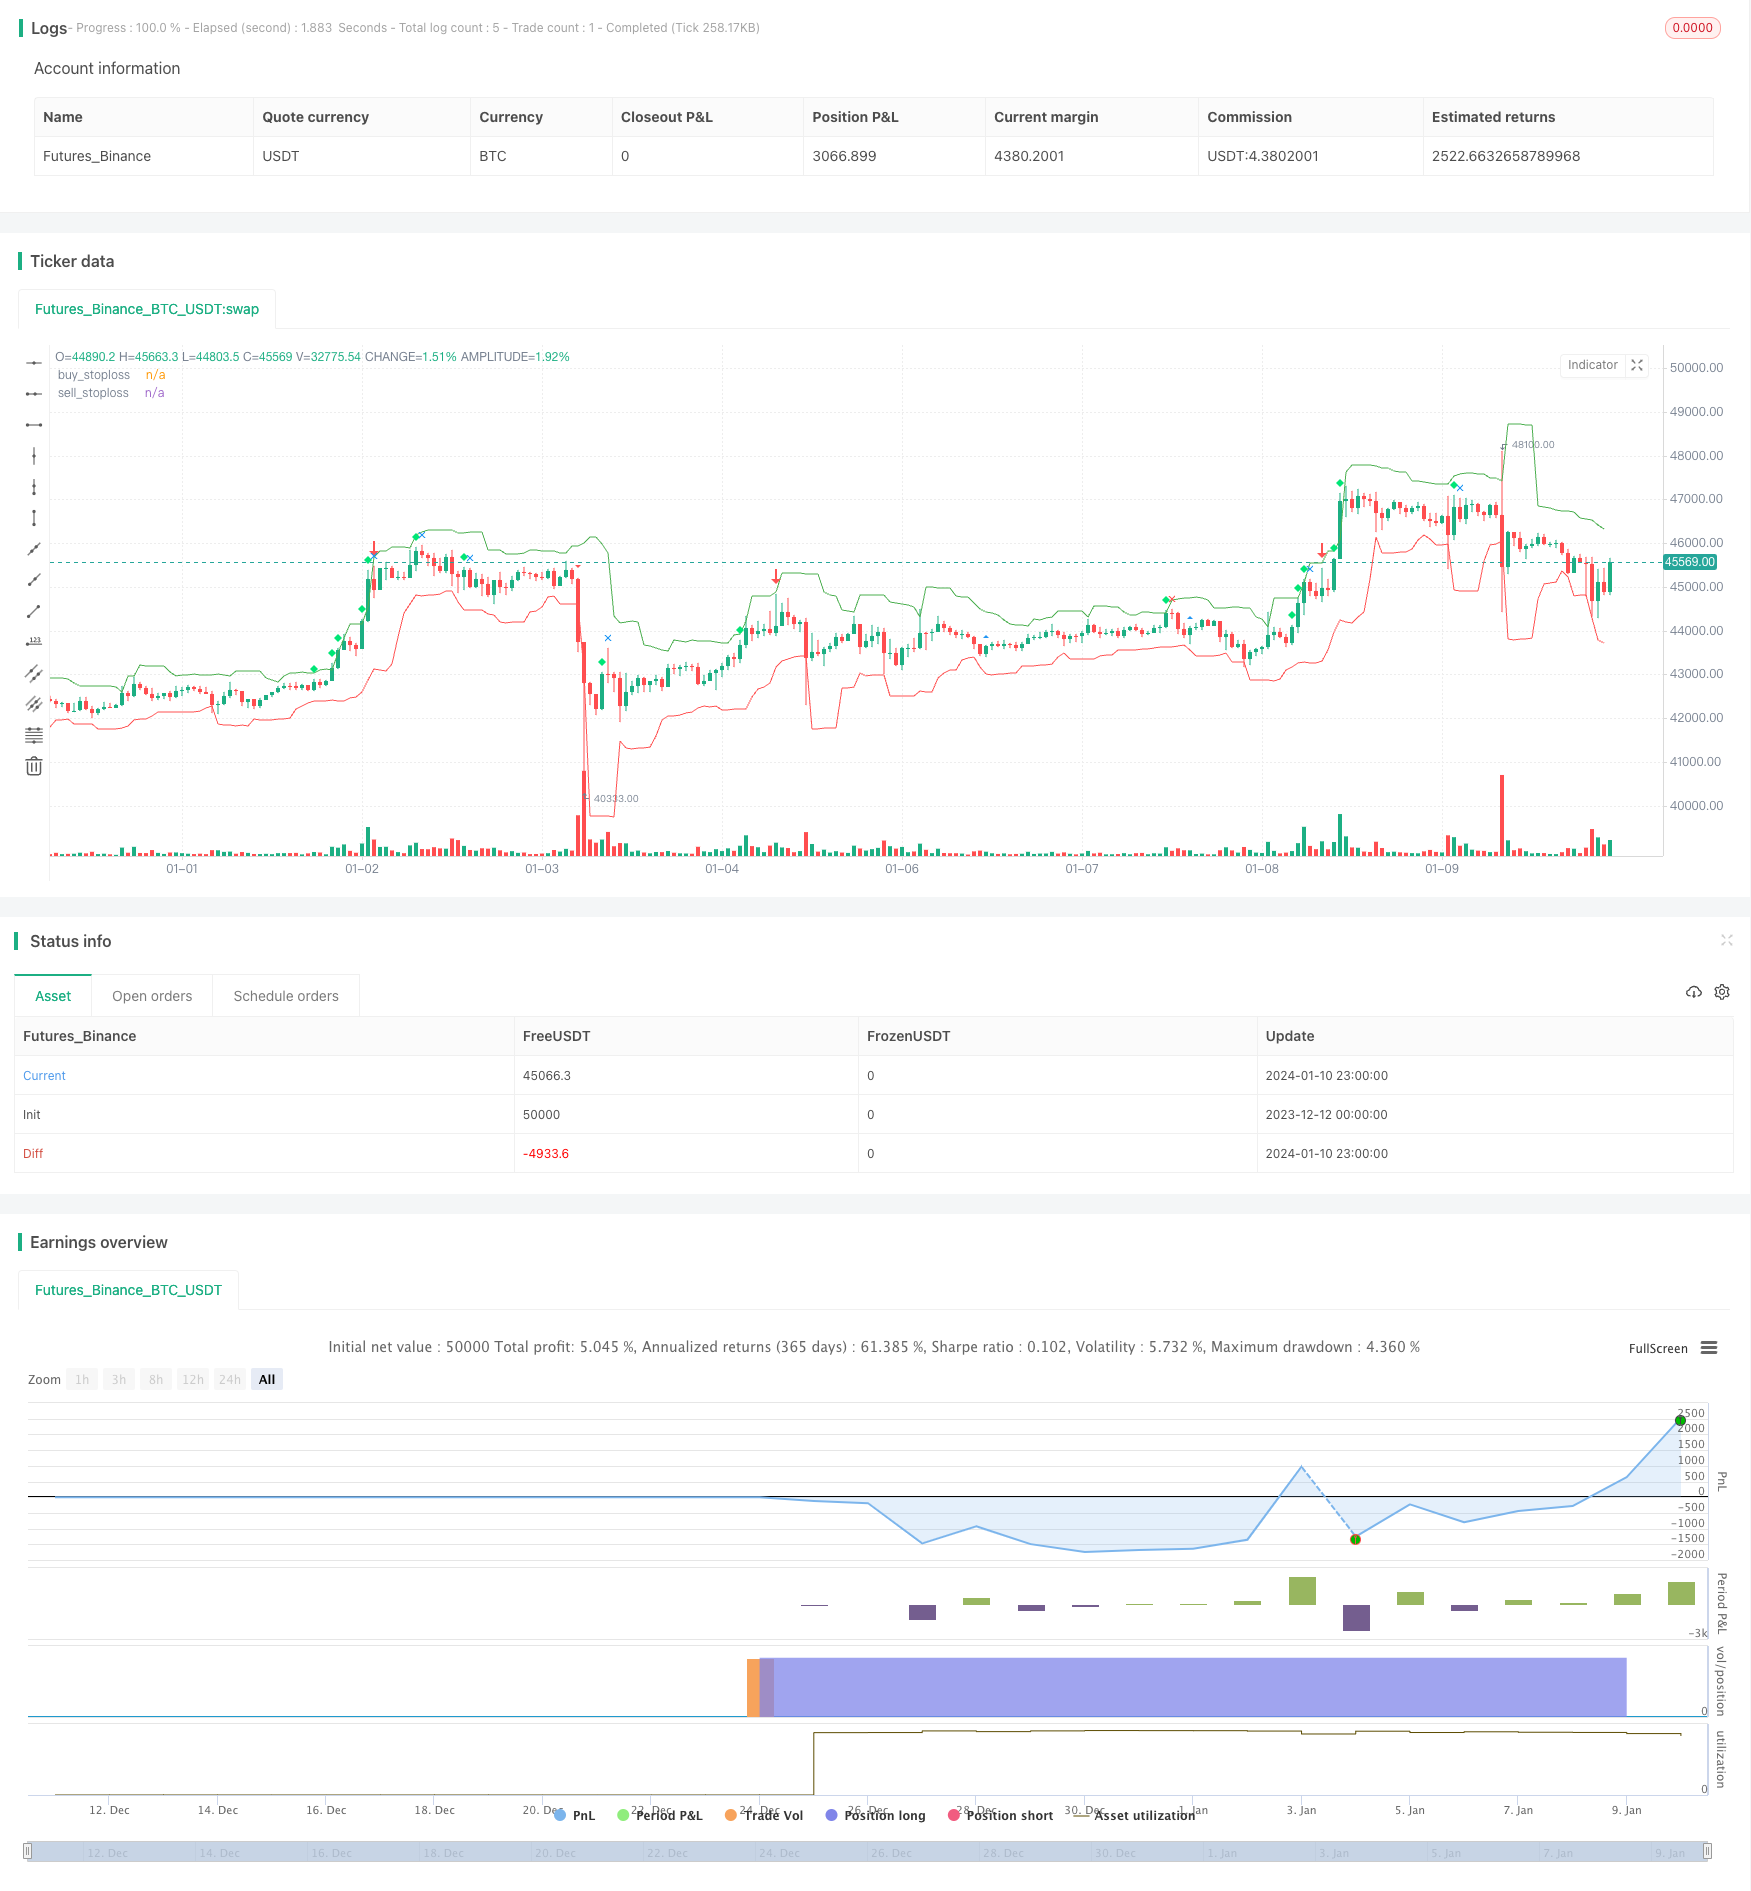
Этот комплекс стратегий учитывает множество факторов, таких как объем сделки, волатильность, место закрытия, тенденции и т. д., чтобы идентифицировать торговые возможности, которые относятся к типичной многофакторной количественной стратегии.
Стратегический принцип
Основная идея этой стратегии заключается в том, чтобы идентифицировать точки купли-продажи, объединяя множество факторов, таких как аномальный прорыв в объеме торговли, место закрытия и величина колебаний.
В частности, стратегия рассчитывает средний объем сделок за прошедший период времени, и если в текущем цикле наблюдается явный необычный прорыв в объеме сделок, это может указывать на изменение тренда. Кроме того, если цена закрытия близка к верхней или нижней границе колебаний, это также означает, что текущая тенденция может быть обращена.
Для проверки точки покупки и продажи стратегия также использует индикатор колебаний для оценки. Если колебания превышают средние значения за предыдущий период времени, формируется первое условие для сигнала покупки и продажи. Затем, если цена закрытия в период повышения находится в нижней части колебаний и объем торгов увеличивается, создается сигнал продажи.
Кроме того, эта стратегия используется в сочетании со среднелинейным индикатором для определения общей тенденции, а также в качестве условия для получения сигнала покупки или продажи, если произойдет изменение тенденции на средней и длинной линиях.
Благодаря сочетанию вышеперечисленных индикаторов, эта стратегия позволяет в полной мере оценить рыночные моменты покупки и продажи.
Стратегические преимущества
Основные преимущества этой стратегии заключаются в том, что решение принимается с учетом множества факторов, что делает результаты более надежными. В частности, основные преимущества заключаются в следующих аспектах:
- С учетом аномального прорыва в объеме трафика, можно заранее обнаружить признаки изменения тенденции.
- Чтобы избежать ошибочного восприятия краткосрочных рыночных шумов, необходимо определить реальные тенденции по величине колебаний и позиции закрытия.
- В сочетании со среднесрочной и долгосрочной средней линией оценивается направление общей тенденции, чтобы убедиться, что стратегия соответствует тенденциям крупных рынков.
- Многофакторный комплексный подход делает стратегию более устойчивой и надежной, и позволяет избежать больших потерь.
Стратегический риск
В этой стратегии также есть некоторые риски, о которых следует помнить:
- Определение многофакторного сочетания более сложно, параметрная настройка сложнее.
- Невозможно полностью избежать нежелательных сделок, вызванных ложными взломами.
- Если вы ошибаетесь в оценке основных тенденций, то общий эффект от работы будет снижен.
- Параметры флуктуации необходимо корректировать в зависимости от различных рыночных условий.
Направление оптимизации
В этой стратегии есть несколько основных улучшений:
- Автоматическая оптимизация параметров с использованием методов машинного обучения.
- Присоединяйтесь к стратегии управления рисками Stop Loss.
- Основные тенденции оцениваются в сочетании с другими факторами, такими как движение капитала.
- Дизайн адаптируется к параметрам волатильности.
Подвести итог
Стратегия комплексно учитывает различные факторы для выявления торговых возможностей. Преимущество стратегии заключается в том, что она является всеобъемлющей, стабильной и надежной; основные риски связаны с определением параметров и ошибками в определении основных тенденций; в будущем параметры могут быть оптимизированы с помощью машинного обучения и т. Д. В целом, идея стратегии обоснована, и ожидается реальный эффект.
/*backtest
start: 2023-12-12 00:00:00
end: 2024-01-11 00:00:00
period: 1h
basePeriod: 15m
exchanges: [{"eid":"Futures_Binance","currency":"BTC_USDT"}]
*/

//@version=3
strategy("volume spread analysis ", overlay=true)

volavg = sma(volume,40)
c= close
l=low
h=high
v=volume

volmean 			= 	stdev(volavg,30)
volupband3 			= 	volavg + 3*volmean
volupband2 			= 	volavg + 2*volmean
volupband1 			= 	volavg + 1*volmean
voldnband1 			= 	volavg -1*volmean
voldnband2 			= 	volavg -2*volmean
midprice			=	(high+low)/2
spread				=	(high-low)
avgspread			=	sma(spread,80)
avgspreadbar     	=   spread > avgspread
widerangebar		=	spread>(1.5*avgspread)
narrowrangebar	    =	spread<(0.7*avgspread)
lowvolume			=	volume<volume[1] and volume<volume[2]
upbar				=	close>close[1]
downbar			    =	close<close[1]
highvolume			=	volume>volume[1] and volume[1]>volume[2]
closefactor		    =	close-low
clsposition 		=	spread/closefactor

closeposition		=	iff(closefactor==0,avgspread,clsposition)
vb					=	volume>volavg or volume>volume[1]
upclose			    =	close>=((spread*0.7)+low)// close is above 70% of the bar
downclose			=	close<=((spread*0.3)+low)// close is below the 30% of the bar
aboveclose			=	close>((spread*0.5)+low)// close is between 50% and 70% of the bar
belowclose			=	close<((spread*0.5)+low)// close is between 50% and 30% of the bar
midclose			=	close>((spread*0.3)+low) and c<((spread*0.7)+l)// close is between 30% and 70% of the bar
verylowclose		=	closeposition>4//close is below 25% of the bar
veryhighclose		=	closeposition<1.35// close is above 80% of the bar
closepos			= 	iff(close<=((spread*0.2)+low),1,iff(close<=((spread*0.4)+low),2,iff(close<=((spread*0.6)+low),3,iff(close<=((spread*0.8)+low),4,5))))
                    // 1 = downclose, 2 = belowclose, 3 = midclose, 4 = aboveclose, 5 = upclose
volpos				=  	iff(volume>volavg*2,1,iff(volume>volavg*1.3,2,iff(volume>volavg,3,iff(volume<volavg and volume>volavg*0.7,4,5))))
                    //// 1 = very high, 2 = high, 3 = above average, 4 = less than average, 5 = low
freshgndhi          =  close > highestbars(h,5)
freshgndlo          =  close < lowestbars(l,5)


//========================trend estimation =========================
//jtrend=sma(close,5)
//trendlongterm     =  linreg(jtrend,40)
//trendmediumterm   =  linreg(jtrend,10)
//trendshortterm    =  linreg(jtrend,3)
//tls=linreg(jtrend,3)

minperiodsrwist = input(title="short term min periods",  defval=2, minval=1)
maxperiodsrwist = input(title="short term max periods",  defval=8, minval=1)


minperiodsrwilt = input(title="long term min periods",  defval=10, minval=1)
maxperiodsrwilt = input(title="long term max periods",  defval=40, minval=1)

rwhmins = (high - nz(low[minperiodsrwist])) / (atr(minperiodsrwist) * sqrt(minperiodsrwist))
rwhmaxs = (high - nz(low[maxperiodsrwist])) / (atr(maxperiodsrwist) * sqrt(maxperiodsrwist))
rwhs = max( rwhmins, rwhmaxs )

rwlmins = (nz(high[minperiodsrwist]) - low) / (atr(minperiodsrwist) * sqrt(minperiodsrwist))
rwlmaxs = (nz(high[maxperiodsrwist]) - low) / (atr(maxperiodsrwist) * sqrt(maxperiodsrwist))
rwls = max( rwlmins, rwlmaxs )


rwhminl = (high - nz(low[minperiodsrwilt])) / (atr(minperiodsrwilt) * sqrt(minperiodsrwilt))
rwhmaxl = (high - nz(low[maxperiodsrwilt])) / (atr(maxperiodsrwilt) * sqrt(maxperiodsrwilt))
rwhl = max( rwhminl, rwhmaxl )

rwlminl = (nz(high[minperiodsrwilt]) - low) / (atr(minperiodsrwilt) * sqrt(minperiodsrwilt))
rwlmaxl = (nz(high[maxperiodsrwilt]) - low) / (atr(maxperiodsrwilt) * sqrt(maxperiodsrwilt))
rwll = max( rwlminl, rwlmaxl )


ground = rwhs
sky    = rwls
j      = rwhs-rwls
k      = rwhl-rwll
j2     = rwhl
k2     = rwll
ja     = cross(j,1)
jb     = cross(1,j)
jc     = cross(-1,j)
jd     = cross(j,-1)
j2a    = cross(j2,1)
j2b    = cross(1,j2)
k2a    = cross(k2,1)
k2b    = cross(1,k2)
upmajoron   = j > 1 and ja[1]
upmajoroff  = j < 1 and jb[1]
upminoron   = j2 > 1 and j2a[1]
upminoroff  = j2 < 1 and j2b[1]
dnmajoron   = j < -1 and jc[1]
dnmajoroff  = j > -1 and jd[1]
dnminoron   = k2 > 1 and k2a[1]
dnminoroff  = k2 < 1 and k2b[1]
upimd       = iff(ground > 1, 1,0)
dnimd       = iff(sky > 1, 1, 0)
upmajor     = iff(j>1,1,iff(j<(-1),-1,0))
upminor     = iff(j2>1,1,-1)
dnminor     = iff(k2>1,1,-1)
//======================================================================|

Buy_stop = lowest(low[1],5) - atr(20)[1]
plot(Buy_stop, color=red, title="buy_stoploss")
Sell_stop = highest(high[1],5) + atr(20)[1]
plot(Sell_stop, color=green, title="sell_stoploss")

//======================================================================|

//upthrustbar		=	widerangebar and downclose  and upimd==1 and high>high[1]  //wrb and uhs and fresh ground
nut              	=       widerangebar and downclose  and freshgndhi and highvolume // new signal
bc               	=       widerangebar and aboveclose and volume == highest(volume,60) and upmajor==1  // new signal
upthrustbar		=	widerangebar and (closepos==1 or closepos==2) and upminor>0 and high>high[1] and (upimd>0or upmajor>0) and volpos <4// after minor up trend
upthrustbartrue		=	widerangebar and closepos==1 and upmajor>0 and high>high[1] and volpos <4//occurs after a major uptrend
upthrustcond1		=	upthrustbar[1] and downbar and not narrowrangebar
upthrustcond2		=	upthrustbar[1] and downbar and volpos == 2
upthrustcond3		=	upthrustbar and volpos ==1
toprevbar		=	volume[1]>volavg  and upbar[1] and widerangebar[1] and downbar and downclose and widerangebar and upmajor>0 and high==highest(high,10)
pseudoupthrust		=	upbar[1] and high>high[1] and volume[1]>1.5*volavg and downbar and downclose and  not upthrustbar
pseudoutcond		=	pseudoupthrust[1] and downbar and downclose and not upthrustbar
trendchange		=	upbar[1] and high==highest(high,5) and downbar and (downclose or midclose) and volume>volavg and upmajor>0 and upimd>0 and not widerangebar and not pseudoupthrust
nodemandbarut		=	upbar and narrowrangebar and lowvolume and closepos> 3 and ((upminor>0 and upimd>0)or (upminor<0 and upminor>0))//in a up market
nodemandbardt		=	upbar and narrowrangebar and lowvolume and closepos> 3 and (upminor<=0or upimd<=0)// in a down or sidewayss market
nosupplybar		=	downbar and narrowrangebar and lowvolume  and closepos<3 and ((upminor<1 and upimd<1)or (upminor>0 and upimd<1))
lowvoltest		=   	low==lowest(low,5) and upclose and lowvolume//lowvolume and l<low[1] and upclose
lowvoltest1		= 	low==lowest(low,5) and volume<volavg and low<low[1] and upclose and upminor>0 and upmajor>0// and widerangebar
lowvoltest2		= 	lowvoltest[1] and upbar and upclose
sellcond1		=	(upthrustcond1 or upthrustcond2 or upthrustcond3)
sellcond2		=	sellcond1[1]==0
sellcond		=	sellcond1 and sellcond2
strengthdown0		= 	upmajor<0 and volpos<4 and downbar[1] and upbar and closepos>3 and upminor<0 and upimd<=0// strength after a long down trend
strengthdown		= 	volpos<4 and downbar[1] and upbar and closepos>3 and upimd<=00 and upminor<0// strength after a down trend
strengthdown1		= 	upmajor<0 and volume>(volavg*1.5) and downbar[1] and upbar and closepos>3 and upminor<0 and upimd<=0//strength after downtrend . high volume
strengthdown2		=	upimd<=0 and volume[1]<volavg  and upbar and veryhighclose and volpos<4
buycond1		= 	strengthdown or strengthdown1
buycond			= 	upbar  and buycond1[1]
stopvolume		= 	low==lowest(low,5)  and (upclose or midclose) and v>1.5*volavg and upmajor<0
revupthrust		=	upmajor<0 and upbar and upclose and volume>volume[1] and volume>volavg and  widerangebar and downbar[1] and downclose[1] and upminor<0
effortup		=	high>high[1] and low>low[1] and close>close[1] and close>=((high-low)*0.7+low) and spread>avgspread and volpos<4//and open<=((high-low)*0.3+low)
effortupfail		=	effortup[1] and (upthrustbar or upthrustcond1 or upthrustcond2 or upthrustcond3 or (downbar and avgspreadbar))
effortdown		=	high<high[1] and low<low[1] and close<close[1] and  close<=((high-low)*0.25+low) and widerangebar and volume>volume[1]//o>=((high-low)*0.75+
effortdownfail  	=  	effortdown[1] and ((upbar and avgspreadbar)or revupthrust or buycond1)
upflag           	=  	(sellcond or buycond or effortup or effortupfail or stopvolume or effortdown or effortdownfail or revupthrust or nodemandbardt or nodemandbarut or nosupplybar or lowvoltest	or lowvoltest1 or lowvoltest2 or bc)
bullbar			=	(volume>volavg or volume>volume[1]) and closeposition <2 and upbar and not upflag
bearbar			=	vb  and downclose and downbar and spread>avgspread and not upflag
buy =	(upbar and revupthrust[1])or lowvoltest2
burely				=	strengthdown1 and stopvolume[1]or (upbar and revupthrust[1])or lowvoltest2
//buy				=	effortup and lowvoltest2[1]
//sell			=	upthrustbartrue
sell			=	effortup[1] and effortupfail and upthrustcond3 and upthrustbartrue and toprevbar

strategy.entry("simpleBuy", strategy.long, when= (upbar and revupthrust[1])or lowvoltest2 )
strategy.close("simpleBuy",when=upthrustbartrue )

//strategy.entry("simpleSell", strategy.short,when= upthrustbartrue )
//strategy.close("simpleSell",when= (upbar and revupthrust[1])or lowvoltest2)


//|============================================================================================|
//data = close >= open
//plotshape(true, style=shape.flag, color=data ? green : red)

plotshape((upthrustbar or upthrustbartrue)	,title="upthrustbaro"	,style=shape.arrowdown		,size=size.huge,color=red	)
//plotshape(toprevbar					        ,title="toprevbar"  	,style=shape.flag		,size=size.small,color=blue	)
//plotshape((pseudoupthrust)			    	,title="(pseudoupthrus"	,style=shape.circle		,size=size.small,color=blue	)
//plotshape((upthrustcond1 or upthrustcond2)	,title="upthrustcond1"	,style=shape.triangleup		,size=size.small,color=red	)
plotshape(trendchange		    			,title="trendchange"	,style=shape.xcross		,size=size.small,color=red	)
//plotshape((nodemandbardt)		    		,title="(nodemandbardt"	,style=shape.square		,size=size.small,color=orange	)
//plotshape(nosupplybar				    	,title="nosupplybar"	,style=shape.cross		,size=size.small,color=blue)
plotshape(revupthrust				    	,title="revupthrust"	,style=shape.arrowup		,size=size.huge,color=green	)
//plotshape((upthrustbar	or	upthrustbartrue)	,title="upthrustbaro"	,style=shape.cross		,size=size.small,color=red	)
//plotshape((upthrustcond1	or	upthrustcond2)	,title="upthrustcond1"	,style=shape.triangledown	,size=size.small,color=white	)
//plotshape((pseudoupthrust)				,title="(pseudoupthrus"	,style=shape.arrowup		,size=size.small,color=blue	)
//plotshape(nodemandbarut					,title="nodemandbarut"	,style=shape.labelup		,size=size.small,color=orange	)
//plotshape(nodemandbarut					,title="nodemandbarut"	,style=shape.labeldown		,size=size.small,color=yellow	)
//plotshape(nodemandbardt					,title="nodemandbardt"	,style=shape.diamond      	,size=size.small,color=yellow	)
//plotshape(nosupplybar					,title="nosupplybar"	,style=shape.xcross		,size=size.small,color=blue	)
plotshape(lowvoltest					,title="lowvoltest"	,style=shape.triangleup		,size=size.small,color=blue	)
//plotshape(lowvoltest2					,title="lowvoltest2"	,style=shape.triangledown	,size=size.small,color=yellow	)
//plotshape(strengthdown					,title="strengthdown"	,style=shape.flag		,size=size.small,color=green)
//plotshape(strengthdown					,title="strengthdown"	,style=shape.circle		,size=size.small,color=lime	)
//plotshape(strengthdown2					,title="strengthdown2"	,style=shape.arrowup		,size=size.small,color=silver	)
//plotshape(strengthdown2					,title="strengthdown2"	,style=shape.arrowdown		,size=size.small,color=red	)
//plotshape(stopvolume					,title="stopvolume"	,style=shape.labelup		,size=size.small,color=green	)
//plotshape(stopvolume					,title="stopvolume"	,style=shape.labeldown		,size=size.small,color=yellow	)
plotshape(effortup					,title="effortup"	,style=shape.diamond      	,size=size.small,color=lime	)
plotshape(effortupfail					,title="effortupfail"	,style=shape.xcross		,size=size.small,color=blue	)
//plotshape(effortupfail					,title="effortupfail"	,style=shape.cross		,size=size.small,color=white	)
plotshape(effortdown					,title="effortdown"	,style=shape.triangledown		,size=size.small,color=red	)
plotshape(effortdownfail				,title="effortdownfail"	,style=shape.xcross	,size=size.small,color=green	)
//plotshape(effortdownfail				,title="effortdownfail"	,style=shape.flag		,size=size.small,color=white	)
//plotshape(buycond					,title="buycond"	,style=shape.circle		,size=size.small,color=green	)
//plotshape(sellcond					,title="sellcond"	,style=shape.arrowup		,size=size.small,color=orange	)
//plotshape((nut)						,title="(nut)"		,style=shape.arrowdown		,size=size.small,color=lime	)
//plotshape((bc	)					,title="(bc"		,style=shape.labelup		,size=size.small,color=red	)
//plotshape(buy						,title="buy"		,style=shape.labeldown		,size=size.small,color=white	)