Стратегия разворота тренда по трем линиям К
Обзор
Стратегия трех свечей - это стратегия торговли на короткой линии, которая определяет обратный тренд на короткой линии, идентифицируя три последовательных положительных или отрицательных линии, за которыми следует поглощающая K-линия, в сочетании с несколькими техническими показателями, чтобы отфильтровать время входа в рынок. Эта стратегия торгуется с соотношением стоп-стоп в размере 1:3, что способствует получению дополнительной прибыли.
Стратегический принцип
Центральная логика этой стратегии заключается в том, чтобы идентифицировать K-линейную форму, состоящую из трех последовательных положительных или отрицательных линий, которая обычно предвещает обратный тренд в краткосрочной перспективе. Когда вы обнаруживаете три отрицательных линии, ждите, пока появится следующая поглощающая положительная линия, сделайте больше; наоборот, когда вы обнаруживаете три положительные линии, ждите, пока появится следующая поглощающая отрицательная линия, сделайте пустую.
Кроме того, стратегия также вводит различные технические показатели для фильтрации времени входа в рынок. Средняя линия SMA с двумя различными параметрами входа в рынок рассматривается только при пересечении медленной линии на быстрой линии. Кроме того, с помощью показателя линейного возврата, который определяет рыночные колебания и трендовые состояния, торговля осуществляется только в трендовых состояниях.
При установке стоп-стоп, стратегия требует соотношения риска и дохода не ниже чем 1: 3. При установке стоп-стоп-стоп, вычисляется уровень стоп-стопа путем вычисления показателя ATR, исчисляемого с помощью последней величины колебаний N корня K линий, в сочетании с процентной величиной колебаний. Таким образом, можно получить надлежащую дополнительную прибыль при условии принятия определенного риска.
Стратегические преимущества
Три стратегии обратного тренда K-линии имеют следующие преимущества:
- Выявление краткосрочных переменных и использование возможностей вовремя
- Фильтрация различных показателей для повышения точности входа
- Механизм сдерживания убытков разумный, риск-возвращение умеренное
- Простые параметры и понятные операции
Стратегический риск
В этой стратегии также есть некоторые риски, о которых следует помнить:
- Краткосрочные перемены не обязательно означают перемены долгосрочных тенденций. Следует обратить внимание на тенденции более длительных периодов времени.
- Одно K-образное излучение может привести к ошибочному суждению, можно рассмотреть возможность добавления других вспомогательных сигналов суждения.
- Установка точки остановки может быть слишком оптимистичной, и можно уместно сузить ее.
- Не хватает данных от отслеживания, есть некоторая неопределенность в работе диска.
Направление оптимизации стратегии
Эта стратегия может быть оптимизирована в следующих направлениях:
- Настройка среднелинейных и линейных регрессионных параметров для оптимизации эффективности определения состояния тренда
- Добавление других вспомогательных показателей, таких как показатель Сточа, оптимизирует точность сигнала
- Оптимизация параметров ATR и параметров Stop Loss Margin, балансировка риска и прибыли
- Повышение механизмов отслеживания прорывных точек и повышение прибыльности
- Создание более строгих стратегий управления капиталом и контроля за рисками торговли
Подвести итог
В целом, три K-линейные стратегии обратного тренда используют простую форму цены в сочетании с несколькими вспомогательными показателями, основанными на адекватном балансе риска и прибыли. Это стратегия короткой линии торговли. Она хорошо работает с меньшей сложностью, заслуживает внимания и тестирования инвесторов, и есть много места для улучшения.
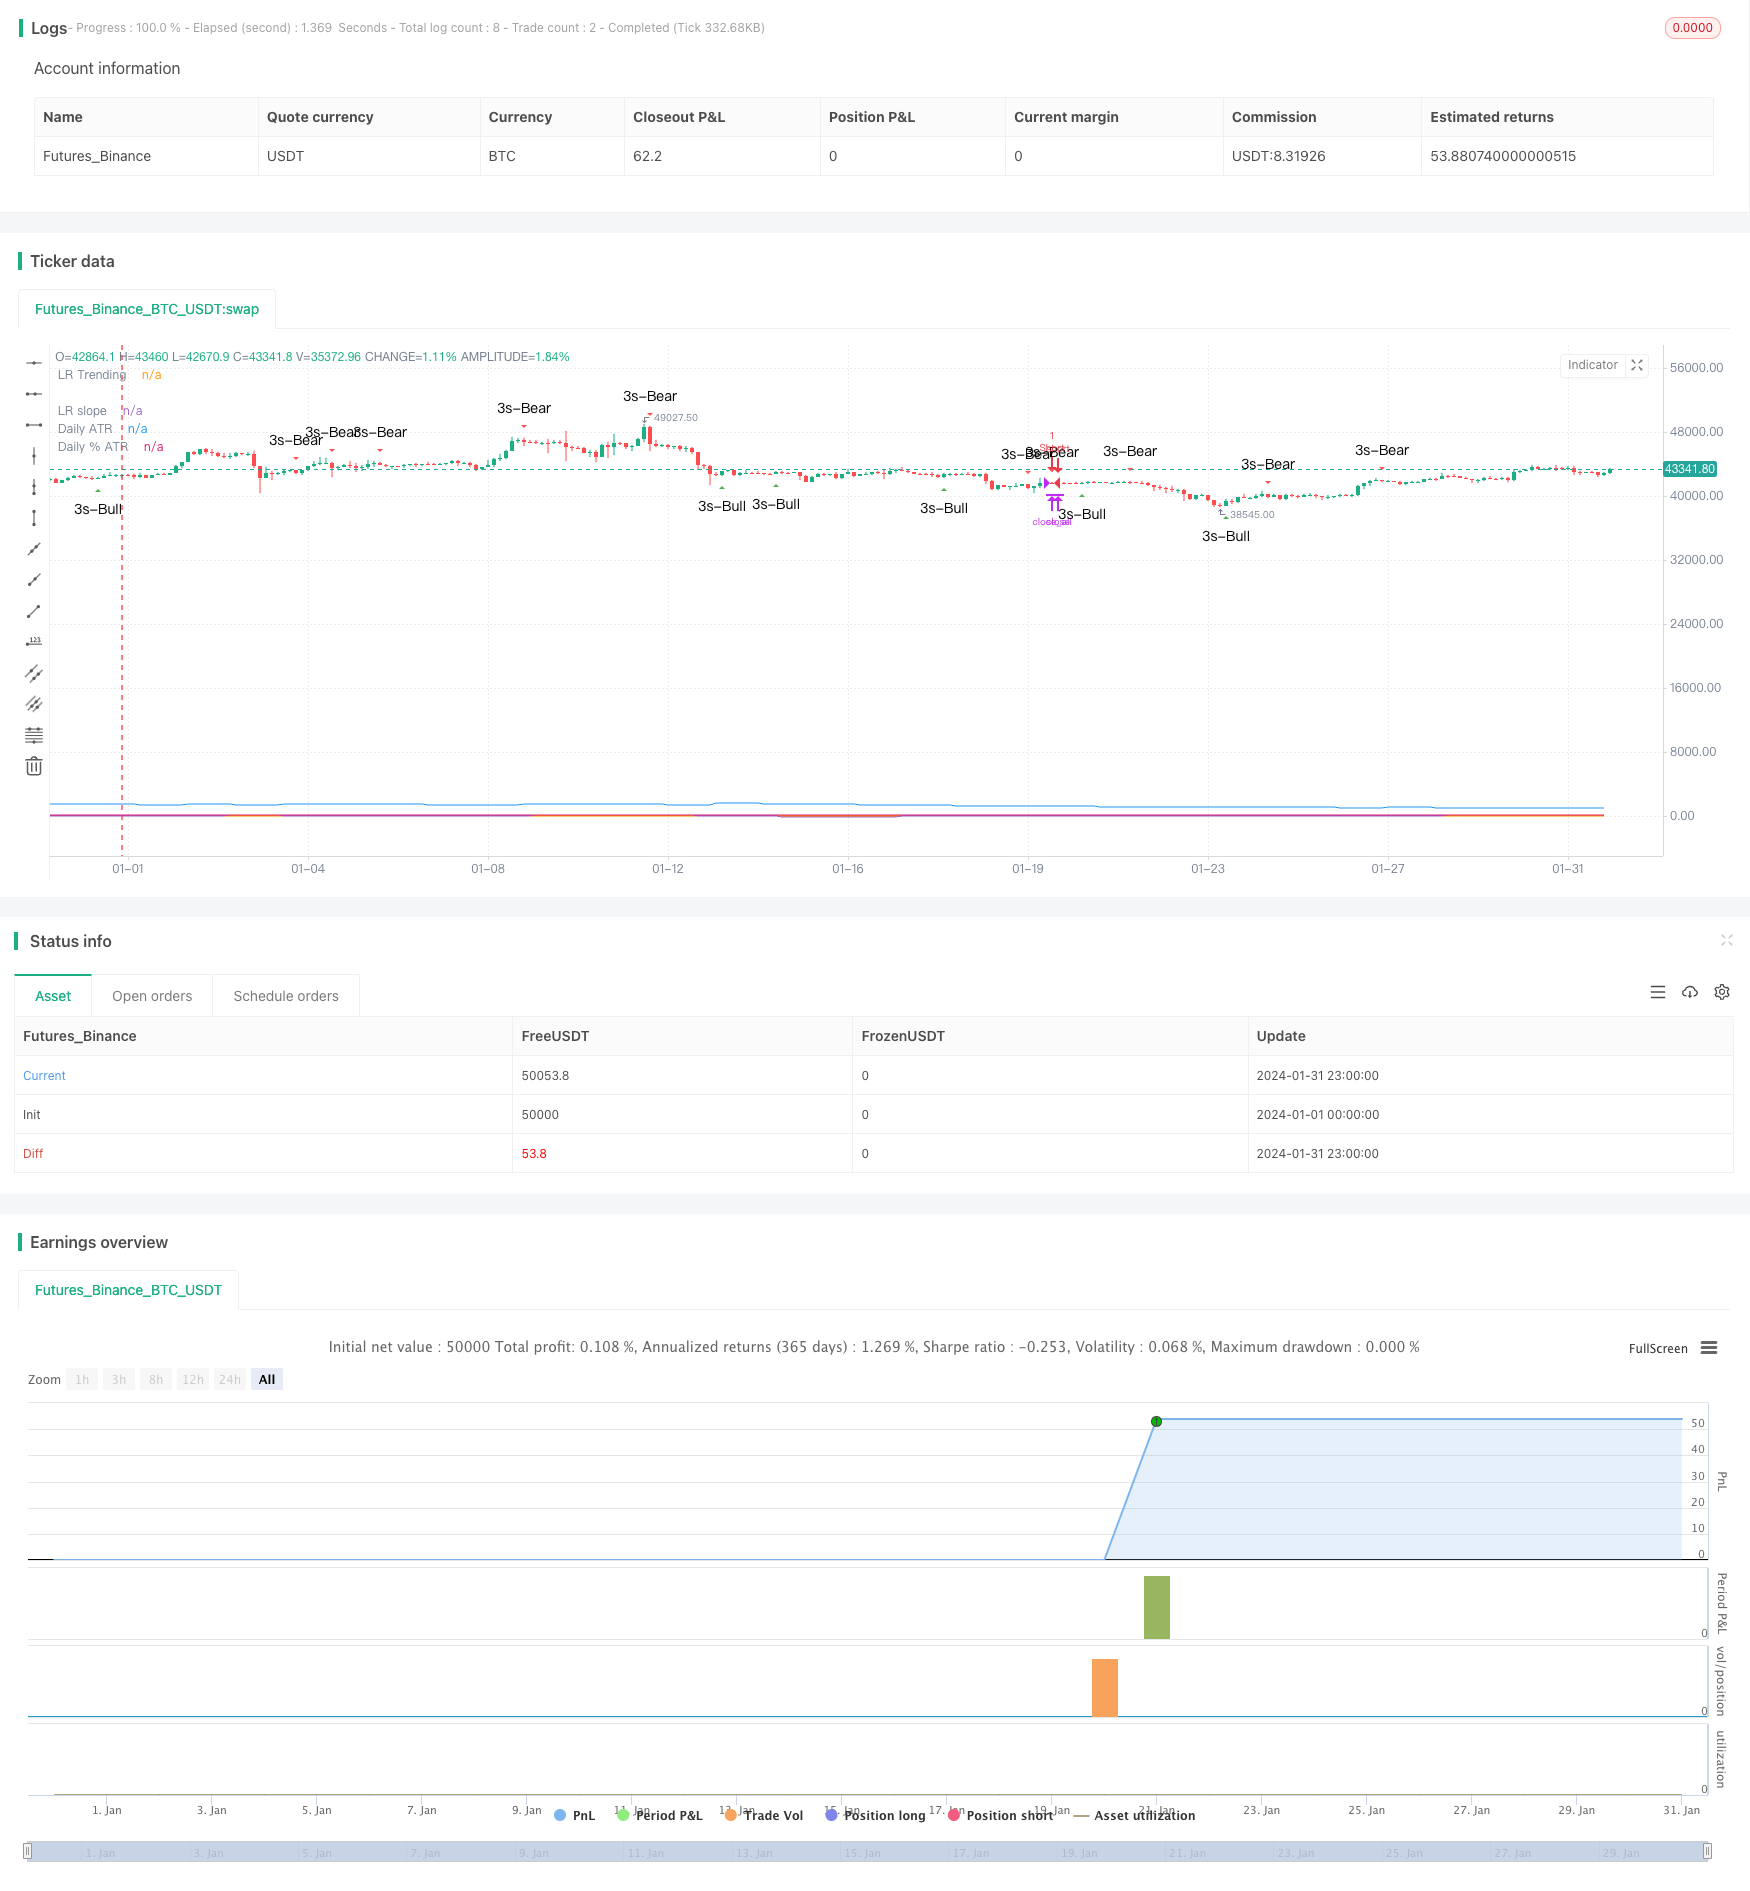
/*backtest
start: 2024-01-01 00:00:00
end: 2024-01-31 23:59:59
period: 3h
basePeriod: 15m
exchanges: [{"eid":"Futures_Binance","currency":"BTC_USDT"}]
*/

// This source code is subject to the terms of the Mozilla Public License 2.0 at https://mozilla.org/MPL/2.0/
// © platsn
//
// Mainly developed for SPY trading on 1 min chart. But feel free to try on other tickers.

// Basic idea of this strategy is to look for 3 candle reversal pattern within trending market structure. The 3 candle reversal pattern consist of 3 consecutive bullish or bearish candles,
// followed by an engulfing candle in the opposite direction. This pattern usually signals a reversal of short term trend. This strategy also uses multiple moving averages to filter long or short
// entries. ie. if the 21 smoothed moving average is above the 50, only look for long (bullish) entries, and vise versa. There is option change these moving average periods to suit your needs.
// I also choose to use Linear Regression to determine whether the market is ranging or trending. It seems the 3 candle pattern is more successful under trending market. Hence I use it as a filter.

// There is also an option to combine this strategy with moving average crossovers. The idea is to look for 3 canddle pattern right after a fast moving average crosses over a slow moving average.
// By default , 21 and 50 smoothed moving averages are used. This gives additional entry opportunites and also provides better results.

// This strategy aims for 1:3 risk to reward ratio. Stop losses are calculated using the closest low or high values for long or short entries, respectively, with an offset using a percentage of
// the daily ATR value. This allows some price flucuation without being stopped out prematurely. Price target is calculated by multiplying the difference between the entry price and the stop loss
// by a factor of 3. When price target is reach, this strategy will set stop loss at the price target and wait for exit considion to maximize potential profit.

// This strategy will exit an order if an opposing 3 candle pattern is detected, this could happend before stop loss or price target is reached, and may also happen after price target is reached.

// *Note that this strategy is designed for same day SPY option scalping. I haven't determined an easy way to calculate the # of contracts to represent the equivalent option values. Plus the option
// prices varies greatly depending on which strike and expiry that may suits your trading style. Therefore, please be mindful of the net profit shown. By default, each entry is approxiately equal
// to buying 10 of same day or 1 day expiry call or puts at strike $1 - $2 OTM. This strategy will close all open trades at 3:45pm EST on Mon, Wed, and Fri.

// **Note that this strategy also takes into account of extended market data.

// ***Note pyramiding is set to 2 by default, so it allows for multiple entries on the way towards price target.

// Remember that market conditions are always changing. This strategy was only able to be backtested using 1 month of data. This strategy may not work the next month. Please keep that in mind.

// *****************************************************************************************************************************************************************************************************

//@version=5
strategy("3 Candle Strike Stretegy", overlay=true, pyramiding=2, initial_capital=5000, commission_type=strategy.commission.cash_per_contract, commission_value = 0.01)

// ******************** Period **************************************
startY = input(title='Start Year', defval=2011, group = "Trading window")
startM = input.int(title='Start Month', defval=1, minval=1, maxval=12, group = "Trading window")
startD = input.int(title='Start Day', defval=1, minval=1, maxval=31, group = "Trading window")
finishY = input(title='Finish Year', defval=2050, group = "Trading window")
finishM = input.int(title='Finish Month', defval=12, minval=1, maxval=12, group = "Trading window")
finishD = input.int(title='Finish Day', defval=31, minval=1, maxval=31, group = "Trading window")
timestart = timestamp(startY, startM, startD, 00, 00)
timefinish = timestamp(finishY, finishM, finishD, 23, 59)
t1 = time(timeframe.period, "0930-1545:23456")
window = true

// *****************************************************

isSPY = input.bool(defval=true,title="SPY trading only", group = "Trading Options")
SPY_option = input.int(defval=10,title="# of SPY options per trade", group = "Trading Options")
reinvest = input.bool(defval=false,title="reinvest profit?", group = "Trading Options")
src = close

// ***************************************************************************************************** Daily ATR *****************************************************
// Inputs
atrlen = input.int(14, minval=1, title="ATR period", group = "Daily ATR")
iPercent = input.float(5, minval=1, maxval=100, step=0.1, title="% ATR to use for SL / PT", group = "Daily ATR")
// PTPercent = input.int(100, minval=1, title="% ATR for PT")

// Logic
percentage = iPercent * 0.01
datr = request.security(syminfo.tickerid, "1D", ta.rma(ta.tr, atrlen))
datrp = datr * percentage
// datrPT = datr * PTPercent * 0.01

plot(datr,"Daily ATR")
plot(datrp, "Daily % ATR")

// ***************************************************************************************************************** Moving Averages ************************

len0 = input.int(8, minval=1, title='Fast EMA', group= "Moving Averages")
ema1 = ta.ema(src, len0)

len1 = input.int(21, minval=1, title='Fast SMMA', group= "Moving Averages")
smma1 = 0.0
sma_1 = ta.sma(src, len1)
smma1 := na(smma1[1]) ? sma_1 : (smma1[1] * (len1 - 1) + src) / len1

len2 = input.int(50, minval=1, title='Slow SMMA', group= "Moving Averages")
smma2 = 0.0
sma_2 = ta.sma(src, len2)
smma2 := na(smma2[1]) ? sma_2 : (smma2[1] * (len2 - 1) + src) / len2

len3 = input.int(200, minval=1, title='Slow SMMA', group= "Moving Averages")
smma3 = 0.0
sma_3 = ta.sma(src, len3)
smma3 := na(smma3[1]) ? sma_3 : (smma3[1] * (len3 - 1) + src) / len3

ma_bull = smma1 > smma2 and smma1 > smma1[1]
ma_bear = smma1 < smma2 and smma1 < smma1[1]

ma_bull_macro = smma1 > smma3 and smma2 > smma3
ma_bear_macro = smma1 < smma3 and smma2 < smma3

// plot(ma_bull? 1 : 0, "MA bull")
// plot(ma_bear? 1 : 0 , "MA bear")

// **************************************************************************************************************** Linear Regression *************************

//Input
clen = input.int(defval = 50, minval = 1, title = "Linear Regression Period", group = "Linear Regression")
slen = input.int(defval=50, minval=1, title="LR Slope Period" , group = "Linear Regression")
glen = input.int(defval=14, minval=1, title="LR Signal Period", group = "Linear Regression")
LR_thres = input.float(0.03, minval=0, step=0.001, title="LR Threshold for Ranging vs Trending" , group = "Linear Regression")

//Linear Regression Curve
lrc = ta.linreg(src, clen, 0)
//Linear Regression Slope
lrs = (lrc-lrc[1])/1
//Smooth Linear Regression Slope
slrs = ta.ema(lrs, slen)
//Signal Linear Regression Slope
alrs = ta.sma(slrs, glen)

up_accel = lrs > alrs and lrs > 0
down_accel = lrs < alrs and lrs < 0

LR_ranging  = math.abs(slrs) <= LR_thres
LR_trending = math.abs(slrs) > LR_thres

plot(slrs, "LR slope")
plot(LR_trending?1:0, "LR Trending")

// *********************************************************************************************************************************** Candle conditions **************************

bull_3s = close[3] <= open[3] and close[2] <= open[2] and close[1] <= open[1] and close > open[1]
bear_3s = close[3] >= open[3] and close[2] >= open[2] and close[1] >= open[1] and close < open[1]

plotshape(bull_3s, style=shape.triangleup, color=color.new(color.green, 0), location=location.belowbar, size=size.small, text='3s-Bull', title='3 Line Strike Up')
plotshape(bear_3s, style=shape.triangledown, color=color.new(color.red, 0), location=location.abovebar, size=size.small, text='3s-Bear', title='3 Line Strike Down')

// ***************************************************************************************************************************************** SL & PT ***********************************
RR = input.float(3.0, minval = 1, step = 0.1, title="Reward to Risk Ratio", group = "Trading Options")

barsSinceLastEntry()=>
    strategy.opentrades > 0 ? (bar_index - strategy.opentrades.entry_bar_index(strategy.opentrades-1)) : na

last_high = math.max(high, high[1], high[2], high[3])
last_low = math.min(low, low[1], low[2], low[3])

long_SL = last_low - datrp
short_SL = last_high + datrp

long_PT = last_high
short_PT = last_low

last_entry = strategy.opentrades.entry_price(strategy.opentrades-1)
risk = last_entry - long_SL

if strategy.opentrades > 0
    long_SL := math.min(long_SL[barsSinceLastEntry()], last_low)
    short_SL := math.max(short_SL[barsSinceLastEntry()], last_high)
    risk := last_entry - long_SL
    long_PT := last_entry + (last_entry - long_SL) * RR
    short_PT := last_entry - (short_SL - last_entry) * RR
else
    long_PT := open + (open - long_SL) * RR
    short_PT := open - (short_SL - open) * RR

// plot(short_SL,title = "Short SL", color=color.new(color.purple,30))
// plot(long_SL,title = "Long SL", color=color.new(color.purple,30))
// plot(long_PT,title = "Long PT", color=color.new(color.white,50))
// plot(short_PT,title = "Short PT", color=color.new(color.white,50))
// plot(last_entry, title = "Last entry")
// plot(risk, title = "Risk")

// **************************************************************************************************************************************** Trade Pauses ****************************************
bool trade_pause = false
bool trade_pause2 = false

if high - low > datr*0.3
    trade_pause := true
else
    trade_pause := false

no_longat10 = input.bool(true, title="No long entry between 10 - 10:30 (Avoid 10 am dump)", group = "Trading Options")

// ************************************************************************************************************************************ Entry conditions **************************

trade_3s = input.bool(title='Trade 3s candle pattern', defval=true, group = "Trading Options")
L_entry1 = bull_3s and ma_bull and LR_trending
S_entry1 = bear_3s and ma_bear and LR_trending

trade_ma_reversal = input.bool(title='Trade MA Cross Reversal Signal', defval=true, group = "Trading Options")
L_entry2 = ma_bear_macro and ema1 > smma1 and bull_3s and ta.barssince(ta.cross(ema1,smma1)) < 10
S_entry2 = ma_bull_macro and ema1 < smma1 and bear_3s and ta.barssince(ta.cross(ema1,smma1)) < 10

// ************************************************************************************************************************************** Exit Conditions ********************************

// bsle_thres = input.int(0, "Bar since entry threshold")

// exit0 = barsSinceLastEntry() >= bsle_thres
exit0 = true

L_exit1 = bear_3s
S_exit1 = bull_3s

// ************************************************************************************************************************************ Entry and Exit orders *****************************
strategy.initial_capital = 50000
trade_amount = math.floor(strategy.initial_capital / close)

if isSPY
    if strategy.netprofit > 0 and reinvest
        trade_amount := math.floor((strategy.initial_capital + strategy.netprofit) * 0.2 / 600) * 10 * SPY_option
    else
        trade_amount := math.floor(strategy.initial_capital * 0.2 / 600) * 10 * SPY_option


if not(trade_pause) and not(trade_pause2) and time(timeframe.period, "0930-1540:23456")
    if trade_3s
        if not(time(timeframe.period, "1000-1030:23456")) and no_longat10
            strategy.entry("Long", strategy.long, 1, when = L_entry1 and window, comment="Long 3s" + " SL=" + str.tostring(math.round(long_SL,2)) + " PT=" + str.tostring(math.round(long_PT,2)))
        strategy.entry("Short", strategy.short, 1, when = S_entry1 and window, comment = "Short 3s" + " SL=" + str.tostring(math.round(short_SL,2)) + " PT=" + str.tostring(math.round(short_PT,2)))
    if trade_ma_reversal
        strategy.entry("Long", strategy.long, 1, when = L_entry2 and window, comment="Long MA cross" + " SL=" + str.tostring(math.round(long_SL,2)) + " PT=" + str.tostring(math.round(long_PT,2)))
        strategy.entry("Short", strategy.short, 1, when = S_entry2 and window, comment = "Short MA corss" + " SL=" + str.tostring(math.round(short_SL,2)) + " PT=" + str.tostring(math.round(short_PT,2)))

if high > long_PT
    long_SL := low[1]
    strategy.exit("Exit", "Long", when = exit0 and low < long_PT, stop= long_SL, comment = "Exit Long SL/PT hit")
strategy.close("Long", when = L_exit1, comment = "Exit on Bear Signal")

if low < short_PT
    short_SL := high[1]
    strategy.exit("Exit", "Short", when= exit0 and high > short_PT, stop= short_SL, comment = "Exit Short SL/PT hit")
strategy.close("Short", when = S_exit1, comment = "Exit on Bull Signal")

if time(timeframe.period, "1545-1600:246")
    strategy.close_all()