Стратегия охотника за трендами с несколькими таймфреймами


Дата создания: 2024-02-18 10:17:06 Последнее изменение: 2024-02-18 10:17:06
Копировать: 0 Количество просмотров: 681
1
Подписаться
1617
Подписчики

Стратегия охотника за трендами с несколькими таймфреймами

Обзор

Стратегия многовременного тренд-охотников (Multitimeframe Trend Hunter Strategy) - это стратегия, которая использует несколько индикаторов в сочетании с автоматизированными торговыми сигналами. Эта стратегия использует мобильные средние, супер-тенденс-индикаторы и другие индикаторы, чтобы определить направление тенденции в течение нескольких временных рамок, чтобы обнаружить потенциальные торговые возможности.

Стратегический принцип

Основным принципом этой стратегии является одновременное определение направления тенденции на высоких и низких временных рамках. Сначала стратегия рассчитывает ключевые движущиеся средние значения, сверхтрендовые линии и линии преобразования, базовые линии и т. д. на высоких временных рамках. Затем на низких временных рамках рассчитывается сверхтрендовые линии.

После удовлетворения определенных условий, эта стратегия будет генерировать торговый сигнал на покупку или продажу. Пользователь может выбрать, будет ли он торговать только длинными, короткими или обоими, в зависимости от его собственных потребностей. Кроме того, пользователь может настроить параметры движущейся средней, параметры супертенденции, параметры одной облачной диаграммы и т. Д. Для оптимизации эффективности стратегии.

Анализ преимуществ

Наибольшим преимуществом этой стратегии является сочетание нескольких временных рамок и нескольких индикаторов, что позволяет значительно повысить точность определения направления тенденции и своевременно обнаружить возможности для обратного пути. Конкретные преимущества следующие:

  1. Используйте высокие и низкие временные рамки для подтверждения тенденций и избегайте заблуждений от рынка
  2. Движущаяся средняя используется как средний и длинный индикаторы для определения основных тенденций
  3. Сверхтяжелая линия тренда - кратковременный индикатор, позволяющий вовремя зафиксировать обратный тренд
  4. Облачная карта, которая помогает определить зоны сопротивления и обнаружить потенциальные возможности

Анализ рисков

Основные риски этой стратегии заключаются в том, что неправильная настройка параметров может привести к слишком частым сделкам или упущенным возможностям. Кроме того, неправильный сигнал индикатора также может привести к убыткам. Конкретные риски и способы решения следующие:

  1. Риск настройки параметров: много отслеживания и оптимизации, чтобы найти оптимальную комбинацию параметров
  2. Риск ошибочного сигнала: проверка в сочетании с дополнительными показателями, чтобы избежать ошибочного сигнала
  3. Риск вывода: надлежащая корректировка управления позициями, контроль одиночных потерь

Направление оптимизации

В этой стратегии есть место для дальнейшей оптимизации:

  1. Добавление дополнительных комбинаций показателей, таких как BRI, RSI и т. д., для повышения точности суждения
  2. Интегрированные модели машинного обучения для более интеллектуальных торговых стратегий
  3. Повышение эффективности стратегии в сочетании с количественными технологиями, такими как высокочастотная торговля и ранние птицы
  4. Оптимизация стратегии управления позициями, снижение риска вывода позиций с помощью динамического регулирования позиций

Подвести итог

В целом, многократная стратегия охотников за трендами с использованием нескольких показателей и нескольких временных рамок для определения тенденции, позволяющая вовремя использовать возможности для обратного пути, является наиболее эффективной стратегией количественной торговли. Эта стратегия имеет высокую степень интеграции, широко применяется и в будущем все еще есть большой простор для оптимизации, что заслуживает дальнейшего изучения и применения количественными трейдерами.
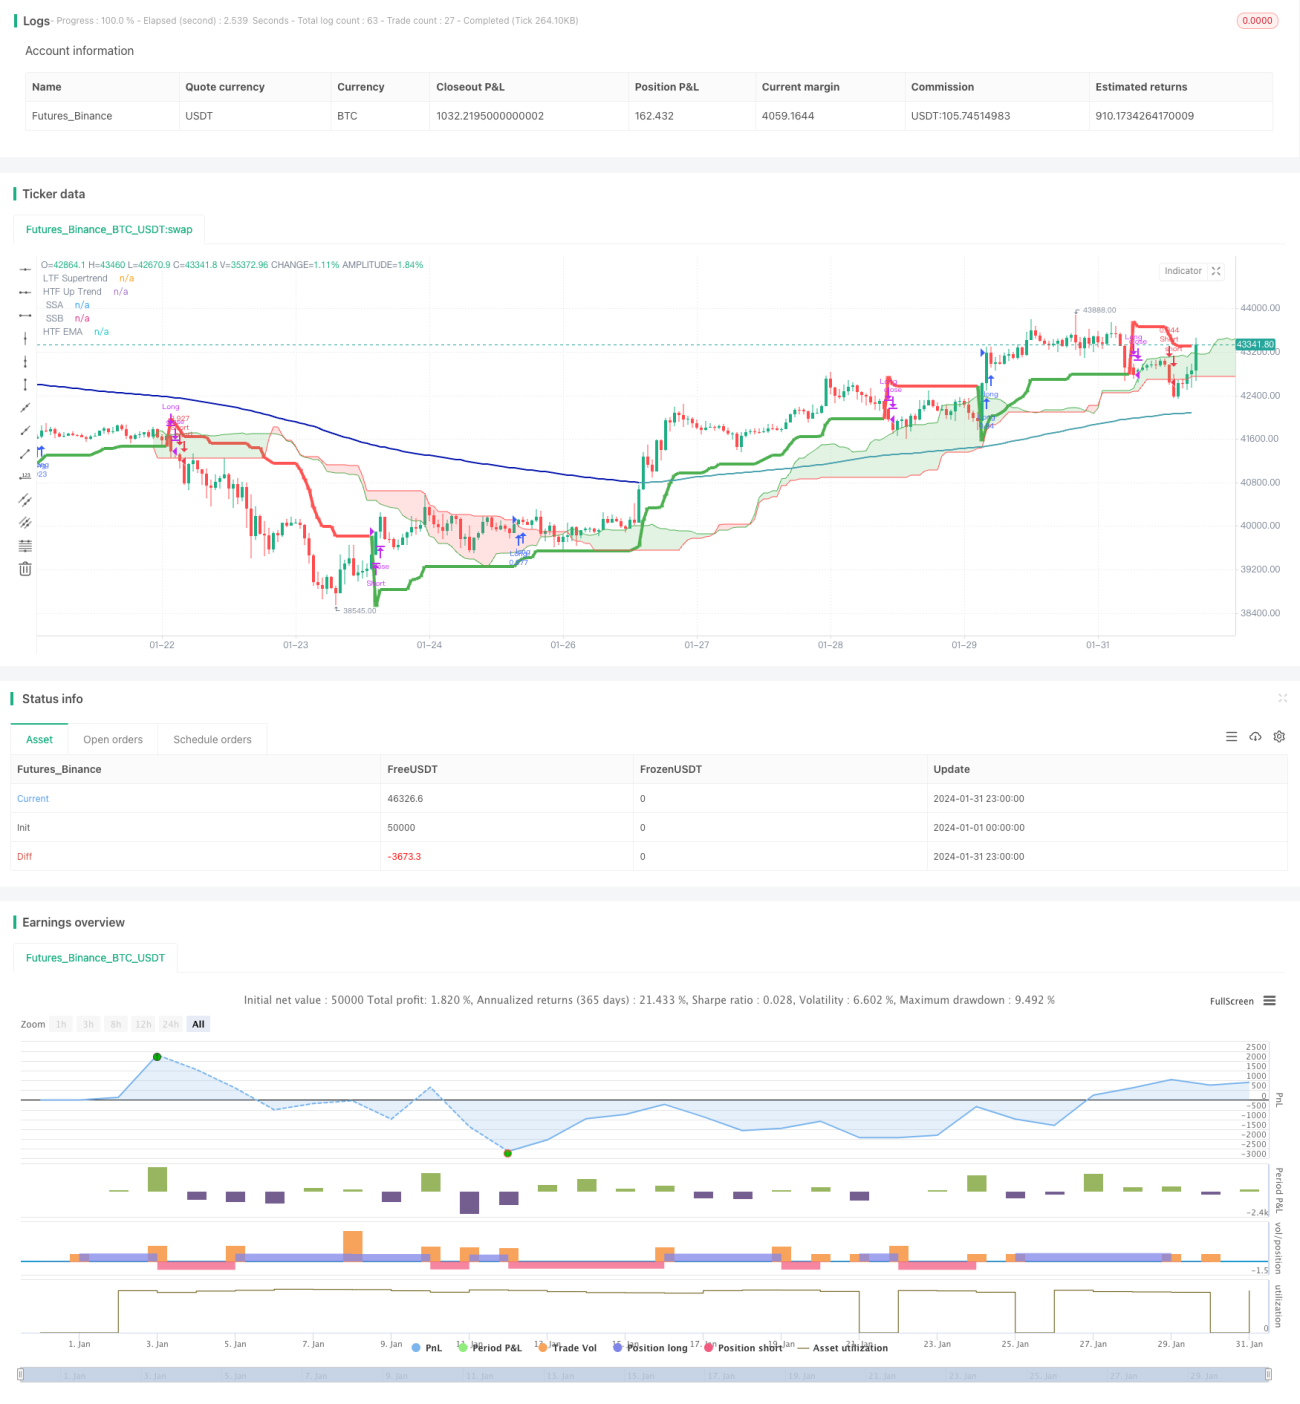
Исходный код стратегии
/*backtest
start: 2024-01-01 00:00:00
end: 2024-01-31 23:59:59
period: 1h
basePeriod: 15m
exchanges: [{"eid":"Futures_Binance","currency":"BTC_USDT"}]
*/

// This Pine Script™ code is subject to the terms of the Mozilla Public License 2.0 at https://mozilla.org/MPL/2.0/
// © godzcopilot / blockybears

// Thanks to anthonyf50 for his MTF Ichimoku https://www.tradingview.com/script/Pw9cBFma/
// Thanks to KivancOzbilgic for his SuperTrend https://www.tradingview.com/script/r6dAP7yi/
// Thanks to ZenAndTheArtOfTrading / PineScriptMastery for their Higher Timeframe EMA https://www.tradingview.com/script/Vh3XG9sD-Higher-Timeframe-EMA/


//@version=5
strategy("TrendHunter [Blocky]", overlay=true, default_qty_type=strategy.percent_of_equity, default_qty_value=80, initial_capital=1000, pyramiding=0)

// ================
// Strategy Inputs
// ================

// Defines user inputs for configuring the strategy.

// Higher Time Frame Selection
HTF_TimeFrame = input.timeframe(title='Higher Time Frame', defval='60', group = '== Timeframe ==', tooltip = "Select Chart for standard functionality")

// Inputs for EMA
len     = input.int(title="EMA Length", defval=200, group ='== EMA ==')
col     = input.bool(title="Colour EMA", defval=true, group ='== EMA ==')

// SuperTrend
Periods = input(title='ATR Period', defval=10, group = '== Supertrend ==')
Multiplier = input.float(title='ATR Multiplier', step=0.1, defval=3.0, group = '== Supertrend ==')
Src = input.source(title='Source', defval=hl2, group = '== Supertrend ==')

// Ichimoku
conversionPeriods = input.int(9, minval=1, title='Conversion Line Periods', group = '== Ichimoku ==')
basePeriods = input.int(26, minval=1, title='Base Line Periods', group = '== Ichimoku ==')
laggingSpan2Periods = input.int(52, minval=1, title='Lagging Span 2 Periods', group = '== Ichimoku ==')
displacement = input.int(26, minval=1, title='Displacement', group = '== Ichimoku ==')

// Ichimoku Display Options
isActiveConversion = input(false, 'Conversion Line', group = '== Ichimoku ==', inline = 'lines1')
isActiveBase = input(false, 'Base Line', group = '== Ichimoku ==', inline = 'lines1')
isActiveLagging = input(false, 'Lagging Span', group = '== Ichimoku ==', inline = 'lines2')
isActiveCloud = input(true, 'Cloud', group = '== Ichimoku ==', inline = 'lines2')


// ================
// Strategy Options
// ================

bTable = input.bool(true, title='Trade Table', group='== Strategy Options ==', tooltip = "Show table that shows current selected options and trade trade entry parameters")

bLong = input.bool(true, title='Enter Longs', group='== Strategy Options ==', inline = 'LongShort')
bShort = input.bool(true, title='Enter Shorts', group='== Strategy Options ==', inline = 'LongShort', tooltip = "Filter long / short trade signals")

bPriceCloud = input.bool(true, title='Price outside cloud', group='== Strategy Options ==', inline='PriceCloud')
bPriceCloudBody = input.bool(false, title='Full Body', group='== Strategy Options ==', inline='PriceCloud', tooltip = 'Only trade when price action outside the cloud.\nLongs when price action above the cloud.\nShort when price action below the cloud')

bPriceEMA = input.bool(false, title='Price above/below EMA', group='== Strategy Options ==', inline='PriceEMA')
bPriceEMABody = input.bool(false, title='Full Body', group='== Strategy Options ==', inline='PriceEMA', tooltip = 'Longs when price action above the EMA.\nShort when price action below the EMA')

bSuper = input.bool(true, title='Supertrend transistions', group='== Strategy Options ==', tooltip = "Trade in direction of the supertrend transitions")
bLTF = input.bool(false, title='LTF/HTF Supertrend alignment', group='== Strategy Options ==', tooltip = "Utilise a dual supertrends, chart and defined higher time frame")

bEMACloud1 = input.bool(true, title='EMA Outside Cloud', group='== Strategy Options ==', tooltip = "EMA must be outside the ichimoku cloud")
bEMACloud2 = input.bool(false, title='EMA above/below Cloud', group='== Strategy Options ==', tooltip = "Longs when EMA above the cloud.\nShort when EMA below the cloud")

bExitHTFTrail = input.bool(true, title='Super Trend Exits:  HTF', group='== Strategy Options ==', inline = 'Exits')
bExitLTFTrail = input.bool(true, title='LTF', group='== Strategy Options ==', inline = 'Exits', tooltip = 'Exit trades when price crosses the supertrend line\nIf neither selected trade closes when opposite trade opens\nIf using LTF closes turn on HTF/LTF alignment')

// ===========================
// EMA Functions and Plotting
// ===========================

// Calculate EMA
ema = ta.ema(close, len)
emaSmooth = request.security(syminfo.tickerid, HTF_TimeFrame, ema[barstate.isrealtime ? 1 : 0], gaps=barmerge.gaps_on)[barstate.isrealtime ? 0 : 1]


// Draw EMA
plot(emaSmooth, color=col ? (close > emaSmooth ? color.rgb(76, 163, 175) : color.rgb(6, 23, 173)) : color.black, linewidth=2, title="HTF EMA")


// ==================================
// Supertrend Functions and Plotting
// ==================================

// Function to calculate SuperTrend
calcSuperTrend(src, atrPeriods, multiplier) =>
    atr = ta.atr(atrPeriods)
    up = src - multiplier * atr
    up1 = nz(up[1], up)
    up := close[1] > up1 ? math.max(up, up1) : up
    dn = src + multiplier * atr
    dn1 = nz(dn[1], dn)
    dn := close[1] < dn1 ? math.min(dn, dn1) : dn
    trend = 1
    trend := nz(trend[1], trend)
    trend := trend == -1 and close > dn1 ? 1 : trend == 1 and close < up1 ? -1 : trend
    [up, dn, trend]

// Calculate SuperTrend for the current time frame
[up, dn, trend] = calcSuperTrend(Src, Periods, Multiplier)

// Plotting for the current time frame
plot(trend == 1 ? up : dn, title='LTF Supertrend', color=trend == 1 ?color.green : color.red, linewidth=1, style = plot.style_stepline)

// Fetching the higher time frame data
[HTF_up, HTF_dn, HTF_trend] = request.security(syminfo.tickerid, HTF_TimeFrame, calcSuperTrend(hl2, Periods, Multiplier), lookahead=barmerge.lookahead_on)

// Plotting for the higher time frame
plot(HTF_trend == 1 ? HTF_up : HTF_dn, title='HTF Up Trend', color= HTF_trend == 1 ? color.green : color.red, linewidth=4)


// ===============================
// Ichimoku Functions and Plotting
// ===============================

// Function to convert timeframe to hours
f_convertTimeframeToHours(tf) =>
    val = 0.0
    if tf == "1S" or tf == "S"
        val := 1.0 / 3600.0
    else if str.contains(tf, "S")
        val := str.tonumber(str.replace(tf, "S", "")) / 3600.0
    else if tf == "1D" or tf == "D"
        val := 24.0
    else if str.contains(tf, "D")
        val := str.tonumber(str.replace(tf, "D", "")) * 24.0
    else if tf == "1W" or tf == "W"
        val := 24.0 * 7.0
    else if str.contains(tf, "W")
        val := str.tonumber(str.replace(tf, "W", "")) * 24.0 * 7.0
    else if tf == "1M" or tf == "M"
        val := 24.0 * 30.0  // Approximation for a month
    else if str.contains(tf, "M")
        val := str.tonumber(str.replace(tf, "M", "")) * 24.0 * 30.0  // Approximation for months
    else
        // Default to minutes
        val := str.tonumber(tf) / 60.0
    val

// Time
timeOffset = time - time[1]


// Returns the displacement based on the chart / HTF resolution
f_getDisplacement(_res) =>
    _res == '' ? displacement : math.round(f_convertTimeframeToHours(_res) / f_convertTimeframeToHours(timeframe.period) * displacement)
    //f_avgDilationOf(_res) * displacement

// Returns average value between lowest and highest
f_avgLH(_len) =>
    math.avg(ta.lowest(_len), ta.highest(_len))

// Returns f_donchian data 
f_donchian(_tf, _src) =>
    request.security(syminfo.tickerid, _tf, _src, barmerge.gaps_off, barmerge.lookahead_on)

// Returns ichimoku data
f_ichimokuData(_tf) =>
    _isShow = _tf == '' or f_convertTimeframeToHours(_tf) >= f_convertTimeframeToHours(timeframe.period)
    _displacement = _isShow ? f_getDisplacement(_tf) : na
    _Conversion = _isShow ? f_donchian(_tf, f_avgLH(conversionPeriods)) : na
    _Base = _isShow ? f_donchian(_tf, f_avgLH(basePeriods)) : na
    _Lagging = _isShow ? f_donchian(_tf, close) : na
    _SSA = _isShow ? math.avg(_Conversion, _Base) : na
    _SSB = _isShow ? f_donchian(_tf, f_avgLH(laggingSpan2Periods)) : na
    _middleCloud = _isShow ? _SSA[0] > _SSB[0] ? _SSA[0] - math.abs(_SSA[0] - _SSB[0]) / 2 : _SSA[0] + math.abs(_SSA[0] - _SSB[0]) / 2 : na
    [_displacement, _Conversion, _Base, _Lagging, _SSA, _SSB, _middleCloud]

// Plotting ichimoku data

[Displacement, Conversion, Base, Lagging, SSA, SSB, fisrtMiddleCloud] = f_ichimokuData(HTF_TimeFrame)

// ————— Conversion
plot(isActiveConversion ? Conversion : na, color=color.new(color.blue, 0), title=' Conversion', linewidth=1)
// ————— Base
plot(isActiveBase ? Base : na, color=color.new(color.fuchsia, 0), title=' Base', linewidth=2)
// ————— Lagging
plot(isActiveLagging ? Lagging : na, offset=-Displacement, color=color.new(color.green, 0), title=' Lagging')

// ————— SSA + SSB
ssa = plot(isActiveCloud ? SSA : na, offset=Displacement, color=color.new(color.green, 0), title=' SSA', linewidth=1)
ssb = plot(isActiveCloud ? SSB : na, offset=Displacement, color=color.new(color.red, 0), title=' SSB', linewidth=1)
fill(ssa, ssb, color=color.new(SSA > SSB ? color.green : color.red , 80), title=' Cloud')


// ===============================
// Strategy Entries
// ===============================

// Checks whether price is inside the Ichimoku cloud
f_PriceCloud(dir) =>
    _enter = false
    if bPriceCloud
        if bLong and dir == 1
            if bPriceCloudBody
                _enter := close > math.max(SSA[Displacement], SSB[Displacement]) and open > math.max(SSA[Displacement], SSB[Displacement])
            else
                _enter := close > math.max(SSA[Displacement], SSB[Displacement])
        if bShort and dir == 2
            if bPriceCloudBody
                _enter := close < math.min(SSA[Displacement], SSB[Displacement]) and open < math.min(SSA[Displacement], SSB[Displacement])
            else
                _enter := close < math.min(SSA[Displacement], SSB[Displacement])
    else
        _enter := na
    _enter

// Checks whether price is above / below the ema
f_PriceEMA(dir) =>
    _enter = false
    if bPriceEMA
        if bLong and dir == 1
            if bPriceEMABody
                _enter := close > emaSmooth and open > emaSmooth
            else
                _enter := close > emaSmooth
        if bShort and dir == 2
            if bPriceEMABody
                _enter := close < emaSmooth and open < emaSmooth
            else
                _enter := close < emaSmooth
    else
        _enter := na
    _enter

// Checks HTF supertrend direction
f_Super(dir) =>
    _enter = false
    if bSuper
        if bLong and dir == 1
            _enter := HTF_trend == 1
        if bShort and dir == 2
            _enter := HTF_trend == -1
    else
        _enter := na

    _enter

// Checks LTF supertrend direction
f_LTF(dir) =>
    _enter = false
    if bLTF
        if bLong and dir == 1
            _enter := trend == 1 and HTF_trend == 1
        if bShort and dir == 2
            _enter := trend == -1 and HTF_trend == -1
    else
        _enter := na
    _enter

// Checks whether ema is inside the Ichimoku cloud
f_EMACloud1(dir) =>
    _enter = false
    if bEMACloud1
        if bLong and dir == 1
            _enter := (emaSmooth > math.max(SSA[Displacement], SSB[Displacement])) or (emaSmooth < math.min(SSA[Displacement], SSB[Displacement]))
        if bShort and dir == 2
            _enter := (emaSmooth > math.max(SSA[Displacement], SSB[Displacement])) or (emaSmooth < math.min(SSA[Displacement], SSB[Displacement]))
    else
        _enter := na
    _enter

// Checks whether ema is above/below Ichimoku cloud
f_EMACloud2(dir) =>
    _enter = false
    if bEMACloud2
        if bLong and dir == 1
            _enter := emaSmooth > math.max(SSA[Displacement], SSB[Displacement])
        if bShort and dir == 2
            _enter := emaSmooth < math.min(SSA[Displacement], SSB[Displacement])
    else
        _enter := na
    _enter

// Check if a value is 'na' or true.
f_NATrue(val) =>
    _enter = false
    if na(val)
        _enter := true
    if val
        _enter := true
    _enter   
    

// Consolidates entry conditions.
f_checkCondition(dir) =>
    _enter = false
    if na(f_PriceCloud(dir)) and na(f_PriceEMA(dir)) and na(f_Super(dir)) and na(f_LTF(dir)) and na(f_EMACloud1(dir)) and na(f_EMACloud2(dir))
        _enter := false
    else if f_NATrue(f_PriceCloud(dir)) and f_NATrue(f_PriceEMA(dir)) and f_NATrue(f_Super(dir)) and f_NATrue(f_LTF(dir)) and f_NATrue(f_EMACloud1(dir)) and f_NATrue(f_EMACloud2(dir))
        _enter := true
    _enter

        
// Execute long trade entries
longCondition = bLong and f_checkCondition(1)
if (longCondition)
    strategy.entry("Long", strategy.long)

// Execute short trade entries
shortCondition = bShort and f_checkCondition(2)
if (shortCondition)
    strategy.entry("Short", strategy.short)

// Excute trade exits
exitLong = (bExitHTFTrail and (close < HTF_up or HTF_trend == -1)) or (bExitLTFTrail and (close < up or trend == -1)) 
exitShort = (bExitHTFTrail and (close > HTF_dn or HTF_trend == 1)) or (bExitLTFTrail and (close > dn or trend == 1)) 

if exitLong
    strategy.close("Long")

if exitShort
    strategy.close("Short")

// Creates a table shoing all the user options and their current status for entering a trade
if bTable
    // Create a table
    tbl = table.new(position = position.bottom_right, columns = 4, rows = 9, bgcolor=color.new(color.white, 50), border_width = 1)

    table.cell(tbl, 1, 0, "Selected")
    table.cell(tbl, 2, 0, "Long", bgcolor=na(bLong) ? color.gray : bShort ? color.rgb(4, 112, 8) : color.rgb(100, 7, 7))
    table.cell(tbl, 3, 0, "Short", bgcolor=na(bShort) ? color.gray : bShort ? color.rgb(4, 112, 8) : color.rgb(100, 7, 7))

    table.cell(tbl, 0, 1, "Entry")
    table.cell(tbl, 2, 1, str.tostring(longCondition), bgcolor=longCondition ? color.green : color.red)
    table.cell(tbl, 3, 1, str.tostring(shortCondition), bgcolor=shortCondition ? color.green : color.red)


    table.cell(tbl, 0, 3, "Price Cloud")
    table.cell(tbl, 1, 3, str.tostring(bPriceCloud), bgcolor=na(bPriceCloud) ? color.gray : bPriceCloud ? color.green : color.red)
    table.cell(tbl, 2, 3, str.tostring(f_PriceCloud(1)), bgcolor=na(f_PriceCloud(1)) ? color.gray : f_PriceCloud(1) ? color.green : color.red)
    table.cell(tbl, 3, 3, str.tostring(f_PriceCloud(2)), bgcolor=na(f_PriceCloud(2)) ? color.gray : f_PriceCloud(2) ? color.green : color.red)

    table.cell(tbl, 0, 4, "Price EMA")
    table.cell(tbl, 1, 4, str.tostring(bPriceEMA), bgcolor=na(bPriceEMA) ? color.gray : bPriceEMA ? color.green : color.red)
    table.cell(tbl, 2, 4, str.tostring(f_PriceEMA(1)), bgcolor=na(f_PriceEMA(1)) ? color.gray : f_PriceEMA(1) ? color.green : color.red)
    table.cell(tbl, 3, 4, str.tostring(f_PriceEMA(2)), bgcolor=na(f_PriceEMA(2)) ? color.gray : f_PriceEMA(2) ? color.green : color.red)

    table.cell(tbl, 0, 5, "SuperTrend")
    table.cell(tbl, 1, 5, str.tostring(bSuper), bgcolor=na(bSuper) ? color.gray : bSuper ? color.green : color.red)
    table.cell(tbl, 2, 5, str.tostring(f_Super(1)), bgcolor=na(f_Super(1)) ? color.gray : f_Super(1) ? color.green : color.red)
    table.cell(tbl, 3, 5, str.tostring(f_Super(2)), bgcolor=na(f_Super(2)) ? color.gray : f_Super(2) ? color.green : color.red)

    table.cell(tbl, 0, 6, "HTF/LTF")
    table.cell(tbl, 1, 6, str.tostring(bLTF), bgcolor=na(bLTF) ? color.gray : bLTF ? color.green : color.red)
    table.cell(tbl, 2, 6, str.tostring(f_LTF(1)), bgcolor=na(f_LTF(1)) ? color.gray : f_LTF(1) ? color.green : color.red)
    table.cell(tbl, 3, 6, str.tostring(f_LTF(2)), bgcolor=na(f_LTF(2)) ? color.gray : f_LTF(2) ? color.green : color.red)

    table.cell(tbl, 0, 7, "EMA Outside Cloud")
    table.cell(tbl, 1, 7, str.tostring(bEMACloud1), bgcolor=na(bEMACloud1) ? color.gray : bEMACloud1 ? color.green : color.red)
    table.cell(tbl, 2, 7, str.tostring(f_EMACloud1(1)), bgcolor=na(f_EMACloud1(1)) ? color.gray : f_EMACloud1(1) ? color.green : color.red)
    table.cell(tbl, 3, 7, str.tostring(f_EMACloud1(2)), bgcolor=na(f_EMACloud1(2)) ? color.gray : f_EMACloud1(2) ? color.green : color.red)

    table.cell(tbl, 0, 8, "EMA Above/Below Cloud")
    table.cell(tbl, 1, 8, str.tostring(bEMACloud2), bgcolor=na(bEMACloud2) ? color.gray : bEMACloud2 ? color.green : color.red)
    table.cell(tbl, 2, 8, str.tostring(f_EMACloud2(1)), bgcolor=na(f_EMACloud2(1)) ? color.gray : f_EMACloud2(1) ? color.green : color.red)
    table.cell(tbl, 3, 8, str.tostring(f_EMACloud2(2)), bgcolor=na(f_EMACloud2(2)) ? color.gray : f_EMACloud2(2) ? color.green : color.red)