Новая количественная торговая стратегия, основанная на паттерне ABCD с отслеживанием стоп-лосса и тейк-профита
Обзор стратегии
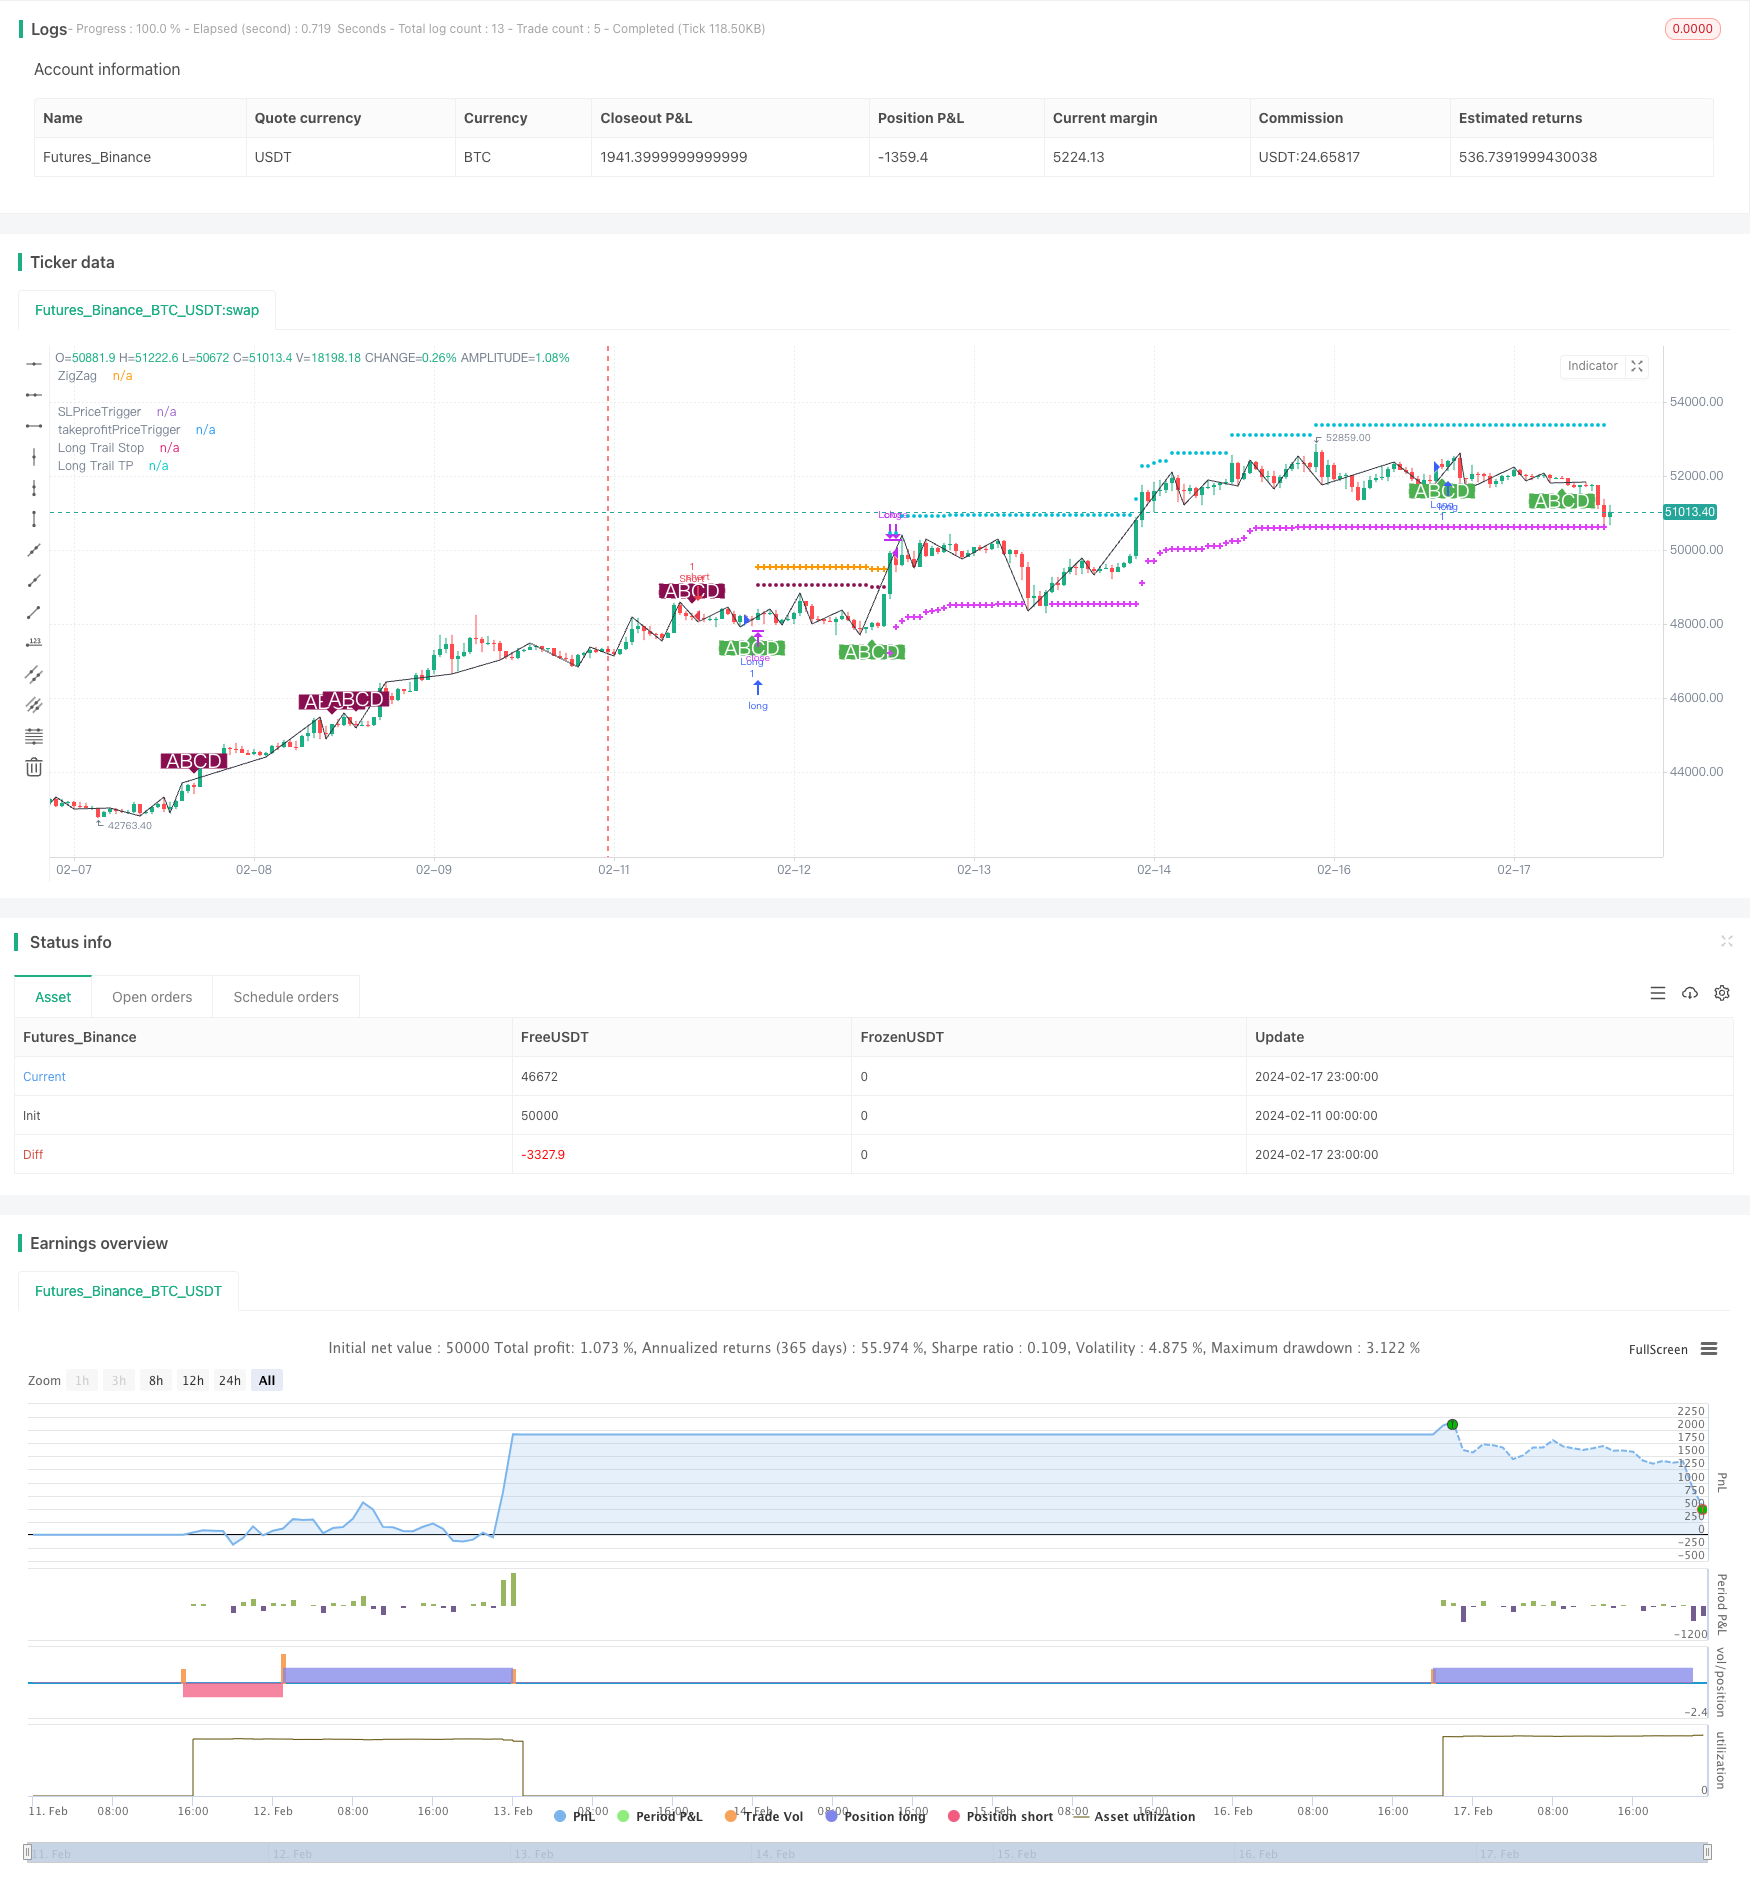
Эта стратегия называется “Лучшая стратегия торговли ABCD-формами” (с отслеживанием стоп-убытков и отслеживанием стоп-убытков). Это количественная стратегия для проведения торговых операций на основе четкой модели ценовых форм ABCD. Основная идея заключается в том, чтобы, идентифицировав полную модель форм ABCD, сделать много пробелов в соответствии с направлением форм и установить стоп-убытки и стоп-отслеживание для управления позициями.
2. Принципы стратегии
Используя методы Бринга для определения верхней и нижней точек классификации цены, получается кривая цены ZigZag.
Для того, чтобы идентифицировать полную модель ABCD-форматов на кривой ZigZag, четыре точки A, B, C и D должны удовлетворять определенным пропорциональным отношениям. После идентификации соответствующих ABCD-форматов, выполните дополнительные или пустые действия.
Для контроля риска после дополнительного просрочки используйте фиксированный стоп, чтобы начать стоп, а когда прибыль достигнет определенной доли, перейдите в мобильный стоп, чтобы заблокировать часть прибыли.
Аналогичным образом, для стоп-линий также используется отслеживание, чтобы вовремя остановить прибыль после получения достаточной прибыли, чтобы избежать ее отброса. Отслеживание стоп-линий также делится на два этапа: сначала используется фиксированная стоп-линия для получения части прибыли, а затем переходит к мобильной стоп-линии для продолжения отслеживания цены.
Когда цена вызывает движущийся стоп-лосс или стоп-стоп, ликвидируйте позицию и завершите торговый цикл.
Третье, анализ стратегических преимуществ.
Использование метода Бринга помогает определить кривую ZigZag, избегая проблем с отклонением от традиционной кривой ZigZag, что делает торговые сигналы более надежными.
Модель ABCD является зрелой и стабильной, возможности для торговли более широки. Кроме того, ABCD имеет четкое направление, что позволяет легко определить направление выхода на рынок.
Установка двухэтапного отслеживания стоп-стопов позволяет лучше контролировать риски и получать прибыль.
Параметры стратегии разработаны рационально, стоп-стоп-процент убытков, мобильный старт-процент могут быть настроены, их использование является гибким.
Эта стратегия может быть использована в любой разновидности, включая валюту, криптовалюты и фондовые индексы.
Анализ стратегических рисков
Хотя форма ABCD более четкая, возможности для торговли относительно ограничены и не гарантируют достаточной частоты торгов.
В событиях, связанных с толчками, может возникнуть ситуация, когда часто срабатывает тормоз с остановкой. В этом случае необходимо соответствующее регулирование параметров, чтобы расширить диапазон тормоза с остановкой.
Необходимо обратить внимание на ликвидность самих торговых видов. При слабой ликвидности показатели, стоп-стоп трудно выполнять точно.
Стратегия более чувствительна к стоимости сделки, требует выбора брокеров и счетов с низкими комиссионными.
Некоторые параметры могут быть оптимизированы, например, условия запуска для перемещения стоп-стоп и остановки могут быть протестированы для получения большего количества значений, чтобы найти оптимальную точку.
Пятое: оптимизация стратегии
В сочетании с другими показателями можно установить больше условий фильтрации, чтобы избежать частичного HW-формата. Это может уменьшить количество недействительных сделок.
Повышение оценки трёхсегментной структуры рынка, поиск возможности для торговли только в третьем сегменте. Это повышает вероятность победы в стратегии.
Тестирование оптимизации начального размера капитала, чтобы найти оптимальный уровень начального капитала.
Можно проверить внеобразные данные, чтобы проверить прочность параметров. Это очень важно для долгосрочной стабильности в управлении стратегией.
Продолжайте оптимизировать мобильные условия остановки/запуска ядра и размер скольжения, чтобы повысить эффективность выполнения стратегии.
В-шестых, итоги стратегии
Стратегия в основном зависит от ценовой модели ABCD для суждения и выхода на рынок. Установка двухэтапного стоп-стоп-трафика для управления рисками и доходами. Стратегия является более зрелой и стабильной, но частота торгов может быть низкой.
/*backtest
start: 2024-02-11 00:00:00
end: 2024-02-18 00:00:00
period: 1h
basePeriod: 15m
exchanges: [{"eid":"Futures_Binance","currency":"BTC_USDT"}]
*/

// @version=4
// @author=Daveatt - BEST

// ABCD Pattern Strat

StrategyName        = "BEST ABCD Pattern Strategy (Trailing SL + TP)"
ShortStrategyName   = "BEST ABCD Strategy (Trailing)"

strategy(title=StrategyName, shorttitle=ShortStrategyName, overlay=true )

filterBW = input(false, title="filter Bill Williams Fractals?")

///////////////////////////////////////////////////////////////////////////////
///////////////////////////////////////////////////////////////////////////////
///////////////////////////////// UTILITIES ///////////////////////////////////
///////////////////////////////////////////////////////////////////////////////
///////////////////////////////////////////////////////////////////////////////

//  ||-----------------------------------------------------------------------------------------------------||
//  ||---   Fractal Recognition Functions:  ---------------------------------------------------------------||
isRegularFractal(mode, _high, _low) =>
    ret = mode == 1 ? _high[4] < _high[3] and _high[3] < _high[2] and _high[2] > _high[1] and _high[1] > _high[0] :
     mode == -1 ? _low[4] > _low[3] and _low[3] > _low[2] and _low[2] < _low[1] and _low[1] < _low[0] : false

isBWFractal(mode, _high, _low) =>
    ret = mode == 1 ? _high[4] < _high[2] and _high[3] <= _high[2] and _high[2] >= _high[1] and _high[2] > _high[0] :
     mode == -1 ? _low[4] > _low[2] and _low[3] >= _low[2] and _low[2] <= _low[1] and _low[2] < _low[0] : false

///////////////////////////////////////////////////////////////////////////////
///////////////////////////////////////////////////////////////////////////////
////////////////////////////// ABCD PATTERN ///////////////////////////////////
///////////////////////////////////////////////////////////////////////////////
///////////////////////////////////////////////////////////////////////////////

f_abcd()=>

    _r = timeframe.period
    _g = barmerge.gaps_off
    _l = barmerge.lookahead_on

    _high = high
    _low = low

    filteredtopf = filterBW ? isRegularFractal(1, _high, _low) : isBWFractal(1, _high, _low)
    filteredbotf = filterBW ? isRegularFractal(-1, _high, _low) : isBWFractal(-1, _high, _low)

    //  ||---   ZigZag:
    istop = filteredtopf
    isbot = filteredbotf
    topcount = barssince(istop)
    botcount = barssince(isbot)

    zigzag = (istop and topcount[1] > botcount[1] ? _high[2] :
     isbot and topcount[1] < botcount[1] ? _low[2] : na)

    x = valuewhen(zigzag, zigzag, 4)
    a = valuewhen(zigzag, zigzag, 3)
    b = valuewhen(zigzag, zigzag, 2)
    c = valuewhen(zigzag, zigzag, 1)
    d = valuewhen(zigzag, zigzag, 0)

    xab = (abs(b-a)/abs(x-a))
    xad = (abs(a-d)/abs(x-a))
    abc = (abs(b-c)/abs(a-b))
    bcd = (abs(c-d)/abs(b-c))

    // ABCD Part
    _abc = abc >= 0.382 and abc <= 0.886
    _bcd = bcd >= 1.13 and bcd <= 2.618

    _bull_abcd = _abc and _bcd and d < c
    _bear_abcd = _abc and _bcd and d > c

    _bull   = _bull_abcd and not _bull_abcd[1]
    _bear   = _bear_abcd and not _bear_abcd[1]

    [_bull, _bear, zigzag]

lapos_x = timenow + round(change(time)*12)

[isLong, isShort, zigzag]  = f_abcd()

plot(zigzag, title= 'ZigZag', color=color.black, offset=-2)
plotshape(isLong, style=shape.labelup, location=location.belowbar, color=color.new(color.green, 0), size=size.normal, text="ABCD", textcolor=color.white)
plotshape(isShort, style=shape.labeldown, location=location.abovebar, color=color.new(color.maroon, 0), size=size.normal, text="ABCD", textcolor=color.white)


long_entry_price    = valuewhen(isLong, close, 0)
short_entry_price   = valuewhen(isShort, close, 0)

sinceNUP = barssince(isLong)
sinceNDN = barssince(isShort)

buy_trend   = sinceNDN > sinceNUP
sell_trend  = sinceNDN < sinceNUP

change_trend = (buy_trend and sell_trend[1]) or (sell_trend and buy_trend[1])

entry_price  = buy_trend ? long_entry_price : short_entry_price

///////////////////////////////
//======[ Trailing STOP ]======//
///////////////////////////////

// use SL?
useSL = input(true, "Use stop Loss")
// Configure trail stop level with input
StopTrailPerc = input(title="Trail Loss (%)", type=input.float, minval=0.0, step=0.1, defval=3) * 0.01
// Will trigger the take profit trailing once reached
use_SL_Trigger = input(true, "Use stop Loss Trigger")
StopTrailTrigger   = input(2.0, "SL Trigger (%)",minval=0,step=0.5,type=input.float) * 0.01


StopLossPriceTrigger = 0.0
StopLossPriceTrigger := if (use_SL_Trigger)
    if buy_trend
        entry_price * (1 + StopTrailTrigger)
    else
        entry_price * (1 - StopTrailTrigger)
else
    -1


var SL_Trigger_Long_HIT = false
SL_Trigger_Long_HIT := useSL and use_SL_Trigger and buy_trend and high >= StopLossPriceTrigger
 ? true : SL_Trigger_Long_HIT[1]


var SL_Trigger_Short_HIT = false
SL_Trigger_Short_HIT := useSL and use_SL_Trigger and sell_trend and low <= StopLossPriceTrigger
 ? true : SL_Trigger_Short_HIT[1]


display_long_SL_trigger     = useSL and buy_trend  and use_SL_Trigger
 and SL_Trigger_Long_HIT == false and StopLossPriceTrigger != -1
display_short_SL_trigger    = useSL and sell_trend and use_SL_Trigger
 and SL_Trigger_Short_HIT == false and StopLossPriceTrigger != -1
display_SL_trigger          = display_long_SL_trigger or display_short_SL_trigger

plot(display_SL_trigger ? StopLossPriceTrigger : na, title='SLPriceTrigger', transp=0,
 color=color.maroon, style=plot.style_circles, linewidth=3)


// Determine trail stop loss prices
longStopPrice = 0.0, shortStopPrice = 0.0

longStopPrice := if useSL and buy_trend
    stopValue = low * (1 - StopTrailPerc)
    max(stopValue, longStopPrice[1])
else
    0

shortStopPrice := if useSL and sell_trend
    stopValue = high * (1 + StopTrailPerc)
    min(stopValue, shortStopPrice[1])
else
    999999

//////////////////////////////////////////////////////////////////////////////////////////
//*** STOP LOSS HIT CONDITIONS  ***//
//////////////////////////////////////////////////////////////////////////////////////////

cond_long_stop_loss_hit  = useSL and buy_trend and crossunder(low, longStopPrice[1])
 and (SL_Trigger_Long_HIT or use_SL_Trigger == false)
cond_short_stop_loss_hit = useSL and sell_trend and crossover(high, shortStopPrice[1])
 and (SL_Trigger_Short_HIT or use_SL_Trigger == false)


// Plot stop loss values for confirmation
plot(series=useSL and buy_trend and low >= longStopPrice
 and (SL_Trigger_Long_HIT or use_SL_Trigger == false)
 ? longStopPrice : na,
 color=color.fuchsia, style=plot.style_cross,
 linewidth=2, title="Long Trail Stop")

plot(series=useSL and sell_trend and high <= shortStopPrice
 and (SL_Trigger_Short_HIT or use_SL_Trigger == false)
 ? shortStopPrice : na,
 color=color.fuchsia, style=plot.style_cross,
 linewidth=2, title="Short Trail Stop")


///////////////////////////////
//======[ Take Profit ]======//
///////////////////////////////

// Use TP?
useTP = input(true, "Use take profit")
// TP trailing
ProfitTrailPerc     = input(1.0, "Trailing Profit (%)",minval=0,step=0.5,type=input.float) * 0.01

use_TP_Trigger = input(true, "Use Take Profit Trigger")
// Will trigger the take profit trailing once reached
takeProfitTrigger   = input(3.0, "Take Profit Trigger (%)",minval=0,step=0.5,type=input.float) * 0.01


// ttp := ttp>tp ? tp : ttp

takeprofitPriceTrigger = 0.0
takeprofitPriceTrigger := if (use_TP_Trigger)
    if (buy_trend)
        entry_price * (1 + takeProfitTrigger)
    else
        entry_price * (1 - takeProfitTrigger)
else
    -1

//plot(entry_price, title='entry_price', transp=100)

var TP_Trigger_Long_HIT = false
TP_Trigger_Long_HIT := useTP and use_TP_Trigger and buy_trend and high >= takeprofitPriceTrigger
 ? true : TP_Trigger_Long_HIT[1]


var TP_Trigger_Short_HIT = false
TP_Trigger_Short_HIT := useTP and use_TP_Trigger and sell_trend and low <= takeprofitPriceTrigger
 ? true : TP_Trigger_Short_HIT[1]


display_long_TP_trigger     = useTP and buy_trend  and TP_Trigger_Long_HIT == false
 and takeprofitPriceTrigger != -1
display_short_TP_trigger    = useTP and sell_trend and TP_Trigger_Short_HIT == false
 and takeprofitPriceTrigger != -1
display_TP_trigger          = display_long_TP_trigger or display_short_TP_trigger


//🔷🔷🔷
// @hugo: Will display the TP trigger as long as not hit
// once the TP trigger is hit, the TP trailing will activate
plot(display_TP_trigger ? takeprofitPriceTrigger : na, title='takeprofitPriceTrigger', transp=0, color=color.orange,
 style=plot.style_cross, linewidth=3)

longTrailTP= 0.0, shortTrailTP = 0.0

// Trailing Profit
// Start trailing once trigger is reached
longTrailTP := if useTP and buy_trend
    tpValue = high * (1 + ProfitTrailPerc)
    max(tpValue, longTrailTP[1])
else
    0

shortTrailTP := if useTP and sell_trend
    tpValue = low * (1 - ProfitTrailPerc)
    min(tpValue, shortTrailTP[1])
else
    999999

//plot(longTrailTP, title='debug longTrailTP', transp=100)
//plot(shortTrailTP, title='debug shortTrailTP', transp=100)

//////////////////////////////////////////////////////////////////////////////////////////
//*** TRAILING TAKE PROFIT HIT CONDITIONS TO BE USED IN ALERTS  ***//
//////////////////////////////////////////////////////////////////////////////////////////


//🔷🔷🔷
// @hugo: I use crossover/crossunder for the alerts to trigger the events only once
cond_long_trail_tp_hit      = useTP and buy_trend   and crossover(high, longTrailTP[1])
 and (TP_Trigger_Long_HIT or use_TP_Trigger == false)
cond_short_trail_tp_hit     = useTP and sell_trend  and crossunder(low, shortTrailTP[1])
 and (TP_Trigger_Short_HIT or use_TP_Trigger == false)
// 🔷🔷🔷


// Plot take profits values for confirmation
// Display the trailing TP until not hit
plot(series= useTP and buy_trend and high <= longTrailTP and
 (TP_Trigger_Long_HIT or use_TP_Trigger == false) ? longTrailTP : na,
 color=color.aqua, style=plot.style_circles,
 linewidth=2, title="Long Trail TP")

plot(series= useTP and sell_trend and low >= shortTrailTP and
 (TP_Trigger_Short_HIT or use_TP_Trigger == false) ? shortTrailTP : na,
 color=color.aqua, style=plot.style_circles,
 linewidth=2, title="Short Trail TP")

close_long  = cond_long_trail_tp_hit or cond_long_stop_loss_hit
close_short = cond_short_trail_tp_hit or cond_short_stop_loss_hit


strategy.entry("Long", 1, when=isLong)
strategy.close("Long", when=close_long)

strategy.entry("Short", 0,  when=isShort)
strategy.close("Short", when=close_short)

if change_trend
    SL_Trigger_Long_HIT := false
    SL_Trigger_Short_HIT := false
    TP_Trigger_Long_HIT := false
    TP_Trigger_Short_HIT := false