Стратегия динамической сетевой торговли

Обзор
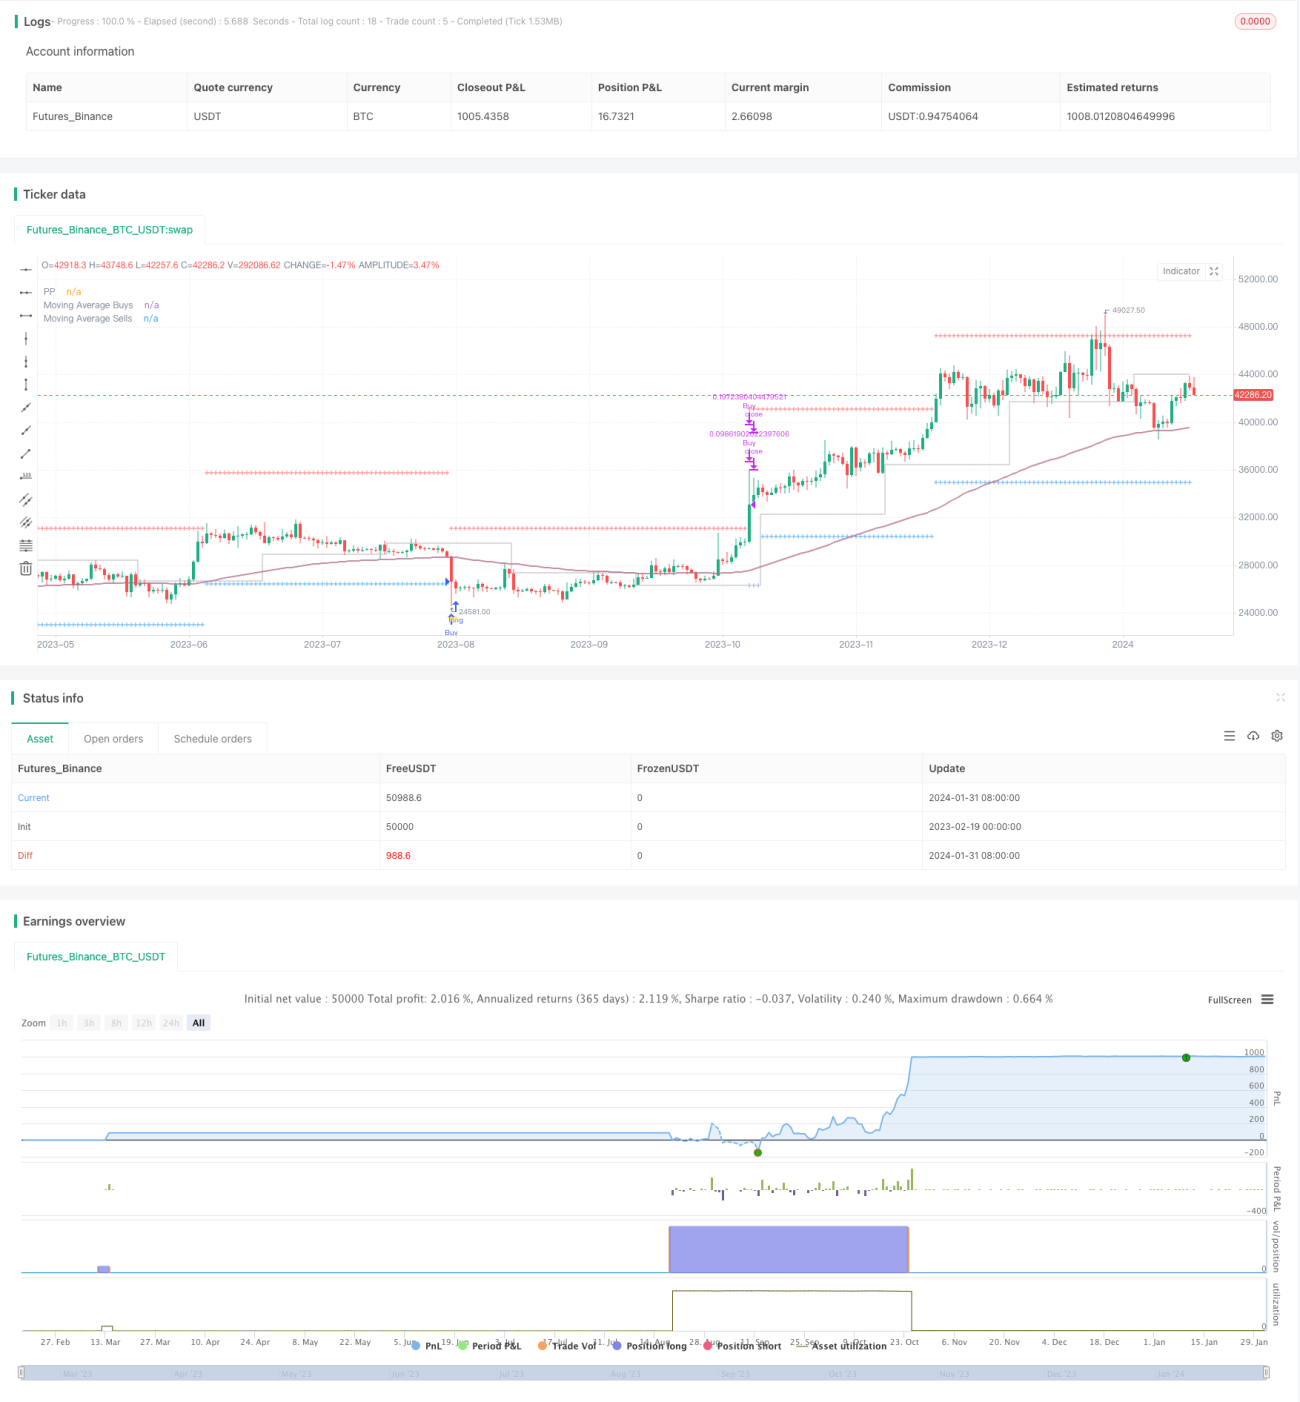
Этот скрипт Pine предоставляет мощную структуру для тестирования и оптимизации торговых стратегий решетки в TradingView. Он использует функцию strategy.orders () для автоматизации торговых сетей и обратной связи.
Стратегический принцип
Основной принцип стратегии основан на динамической сетке. Сетка состоит из ряда ценовых уровней, которые используются для ориентирования позиций покупки и продажи. Когда цена прорывает каждый уровень, это вызывает соответствующие торговые действия.
В частности, во время падения, будет входить больше покупок на поддерживающих позициях. В период подъема, будет входить в закрытые позиции на ключевых сопротивлениях, чтобы получить прибыль. Ширина и пропорции сетки будут корректироваться в зависимости от волатильности рынка и торговых моделей.
С помощью этого автоматизированного механизма торговли сеткой можно эффективно использовать возможности двусторонних колебаний рынка и получать стабильные положительные доходы.
Анализ преимуществ
Эта стратегия имеет следующие преимущества:
-
Динамическая сетка: можно настроить тип сетки, параметры ширины и разрешение опорных точек, чтобы адаптироваться к динамике рынка.
-
Умные стратегии покупкиПокупатели могут выбрать любую опцию, в зависимости от количества заказов и места их размещения.
-
Стратегическая продажаОптимизация прибыли путем установки количества, контроля позиции продажи и установки условий стоп-лосса.
-
Торговля энергиейВыберите опционы на наличные и гарантийные сделки, чтобы удовлетворить различные предпочтения.
-
Высокий уровень настройки: можно скорректировать параметры, такие как первоначальный капитал, процент просрочки, процент гарантии для оптимизации.
-
Информационная панельНапример, если вы хотите, чтобы ваш клиент был в курсе, что у вас есть доступ к ключевым данным о сделках, то вы можете использовать его для оптимизации принятия решений.
Анализ рисков
Несмотря на мощные возможности этой стратегии, следует помнить о некоторых рисках, связанных с ее использованием в реальном мире:
-
Ограничения отслеживанияПрошедшие результаты не могут предсказывать будущие результаты, и прибыль не гарантируется.
-
Рыночные колебания"Все, что мы делаем, - это пытаемся привлечь клиентов, чтобы они смогли получить доступ к нашим услугам", - говорит она.
-
Проблемы с биржамиСбой в системе биржи может привести к сбоям в заказах, задержкам в исполнении и т.д.
-
Неисправность системыСистемы, используемые для генерации результатов заказов, общения и получения результатов, могут не работать, прерывая процесс торговли.
-
ЗадержкаНапример, в случае, если вы используете цифровую валюту, то вы можете использовать цифровую валюту, чтобы совершить транзакцию.
Для того, чтобы безопасно торговать алгоритмическими инструментами, необходимо в полной мере осознать эти риски, действовать осторожно и корректировать стратегию.
Направление оптимизации
Эта стратегия может быть улучшена в следующих областях:
-
Включение логики стоп-ложа для снижения убытков в экстремальных ситуациях.
-
Динамическая настройка параметров сетки в сочетании с алгоритмами машинного обучения.
-
Внедрение количественных показателей, идентификация тенденций и ключевых цен, повышение качества принятия решений.
-
Добавление модуля управления рисками для предотвращения риска взыскания сделок с гарантиями.
-
Внедрение анализа по временным циклам для повышения временной эффективности торговых решений.
Эти улучшения позволят стратегии работать лучше в ретроспективе и в реальном мире.
Подвести итог
Сценарий Pine предоставляет мощную основу для тестирования и оптимизации стратегий сетки. Несмотря на мощную функциональность, реализация в реальном времени может быть немного задержанной. Если быть достаточно осторожным и правильно оценить риски, стратегия может стать эффективным инструментом для автоматизированной сеткой торговли, которая поможет вам получить стабильную прибыль на финансовых рынках.
/*backtest
start: 2023-02-19 00:00:00
end: 2024-02-01 05:20:00
period: 1d
basePeriod: 1h
exchanges: [{"eid":"Futures_Binance","currency":"BTC_USDT"}]
*/

// This source code is subject to the terms of the Mozilla Public License 2.0 at https://mozilla.org/MPL/2.0/
// © AssassinsGrid

// Embark on an automated grid-based trading journey with this Pine script tailored for backtesting in TradingView using strategy.orders().- 1