Стратегия торговли золотом, основанная на импульсе и стандартном отклонении
Обзор
Эта стратегия используется для определения чрезмерной покупки и продажи на рынке путем вычисления отклонения цены золота от 21-го индекса в сочетании со стандартным отклонением. При достижении отклонения от определенного стандартного отклонения используется стратегия отслеживания тенденций, а также устанавливается механизм остановки убытков для контроля риска.
Стратегический принцип
- Вычислите 21-дневную скользящую среднюю как центральную ось
- Расчет отклонения цены на золото от скользящей средней
- Стандартизация отклонения, преобразование в Z-Score
- Когда Z-Score выше 0.5, сделайте больше; когда Z-Score ниже -0.5, сделайте пустоту
- Z-Score снизился до отметки 0.5/-0.5 и остался без изменений.
- Z-Score превышает 3⁄3, остановка
Анализ преимуществ
Это стратегия отслеживания тенденций, основанная на оценке динамики цен и стандартных отклонений, которые приводят к перекупке и перепродаже на рынке, и имеет следующие преимущества:
- Используйте движущуюся среднюю как динамическую поддержку/сопротивление, чтобы понять тренд.
- Стандартный дефицит и Z-Score помогают определить перепродажу и снизить ложные сигналы.
- Использование скользящих средних индексов, более чувствительных к недавним ценам
- Z-Score стандартизирует отклонения от цены, чтобы сделать правила суждения более едиными
- Установка механизмов остановки убытков, которые позволяют своевременно остановить убытки и контролировать риск
Анализ рисков
Однако эта стратегия также несет в себе некоторые риски:
- Движущаяся средняя используется в качестве ориентира, чтобы подавать ошибочные сигналы, когда цена сильно поднимается или пробивается.
- Стандартная разница и Z-Score должны быть правильно настроены, слишком большие или слишком маленькие могут повлиять на эффективность стратегии
- Неправильная стоп-лазерная настройка, которая может быть слишком радикальной и привести к ненужным потерям
- Внезапные события приводят к значительным колебаниям цен, которые могут спровоцировать остановку и упустить возможность тренда.
Решение проблемы:
- Разумная настройка параметров скользящих средних, Identify основные тенденции
- Найти оптимальный порог путем обратного измерения параметров оптимизированной стандартной погрешности
- Настройка стратегии проверки потерь Trailing Stop
- Вовремя переоценить состояние рынка и скорректировать параметры стратегии после инцидента
Направление оптимизации
Эта стратегия может быть оптимизирована в следующих аспектах:
- Использование индикатора волатильности, такого как ATR, вместо простого стандартного отклонения, лучше определяет аппетит к риску
- Попробуйте различные типы скользящих средних, чтобы найти более подходящий средний
- Оптимизация параметров скользящих средних, Identify оптимальный средний цикл
- Оптимизация пороговых значений Z-Score для поиска оптимальных параметров эффективности стратегии
- Увеличение убытков, основанных на волатильности, чтобы сделать их более разумными
Подвести итог
Эта стратегия в целом является базовой разумной стратегией отслеживания тенденций. Она использует движущуюся среднюю для определения направления основной тенденции, а также посредством стандартизированной обработки отклонения от цены, можно четко определить состояние перекупа и перепродажи на рынке, что создает торговый сигнал. Установка разумного способа остановки также позволяет стратегии контролировать риск при гарантировании прибыльности.
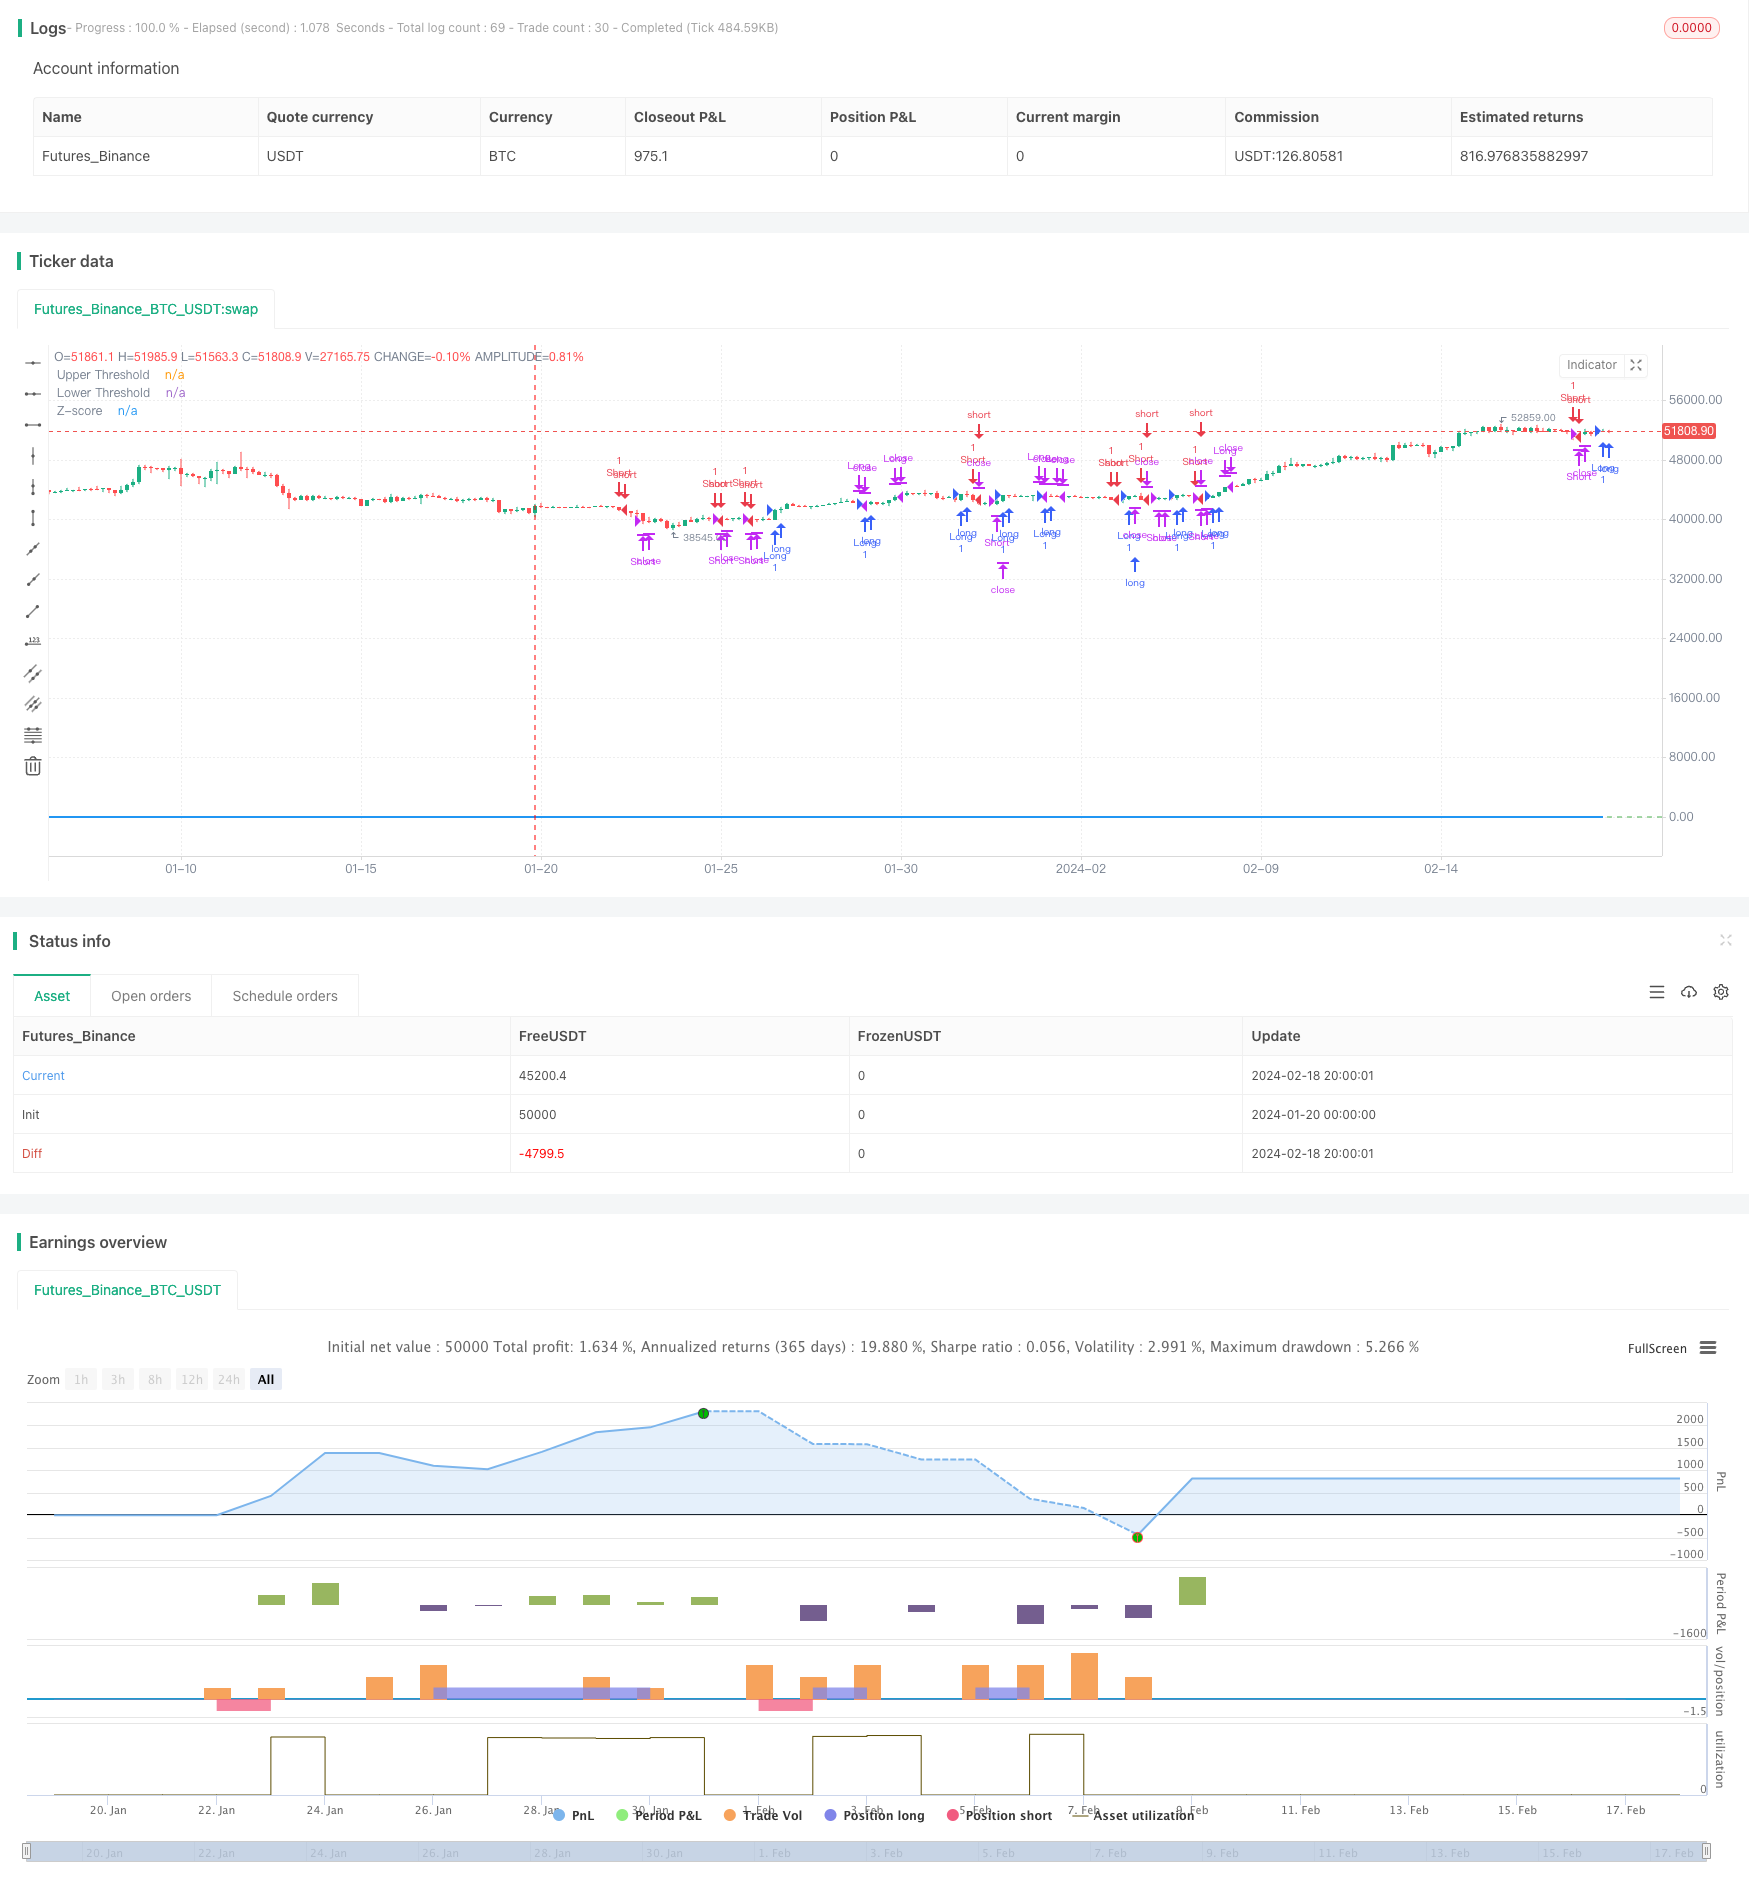
/*backtest
start: 2024-01-20 00:00:00
end: 2024-02-19 00:00:00
period: 4h
basePeriod: 15m
exchanges: [{"eid":"Futures_Binance","currency":"BTC_USDT"}]
*/

//@version=5
strategy("GC Momentum Strategy with Stoploss and Limits", overlay=true)

// Input for the length of the EMA
ema_length = input.int(21, title="EMA Length", minval=1)

// Exponential function parameters
steepness = 2

// Calculate the EMA
ema = ta.ema(close, ema_length)

// Calculate the deviation of the close price from the EMA
deviation = close - ema

// Calculate the standard deviation of the deviation
std_dev = ta.stdev(deviation, ema_length)

// Calculate the Z-score
z_score = deviation / std_dev

// Long entry condition if Z-score crosses +0.5 and is below 3 standard deviations
long_condition = ta.crossover(z_score, 0.5)

// Short entry condition if Z-score crosses -0.5 and is above -3 standard deviations
short_condition = ta.crossunder(z_score, -0.5)

// Exit long position if Z-score converges below 0.5 from top
exit_long_condition = ta.crossunder(z_score, 0.5)

// Exit short position if Z-score converges above -0.5 from below
exit_short_condition = ta.crossover(z_score, -0.5)

// Stop loss condition if Z-score crosses above 3 or below -3
stop_loss_long = ta.crossover(z_score, 3)
stop_loss_short = ta.crossunder(z_score, -3)

// Enter and exit positions based on conditions
if (long_condition)
    strategy.entry("Long", strategy.long)
if (short_condition)
    strategy.entry("Short", strategy.short)
if (exit_long_condition)
    strategy.close("Long")
if (exit_short_condition)
    strategy.close("Short")
if (stop_loss_long)
    strategy.close("Long")
if (stop_loss_short)
    strategy.close("Short")

// Plot the Z-score on the chart
plot(z_score, title="Z-score", color=color.blue, linewidth=2)

// Optional: Plot zero lines for reference
hline(0.5, "Upper Threshold", color=color.red)
hline(-0.5, "Lower Threshold", color=color.green)