Стратегия прорыва флага
Обзор
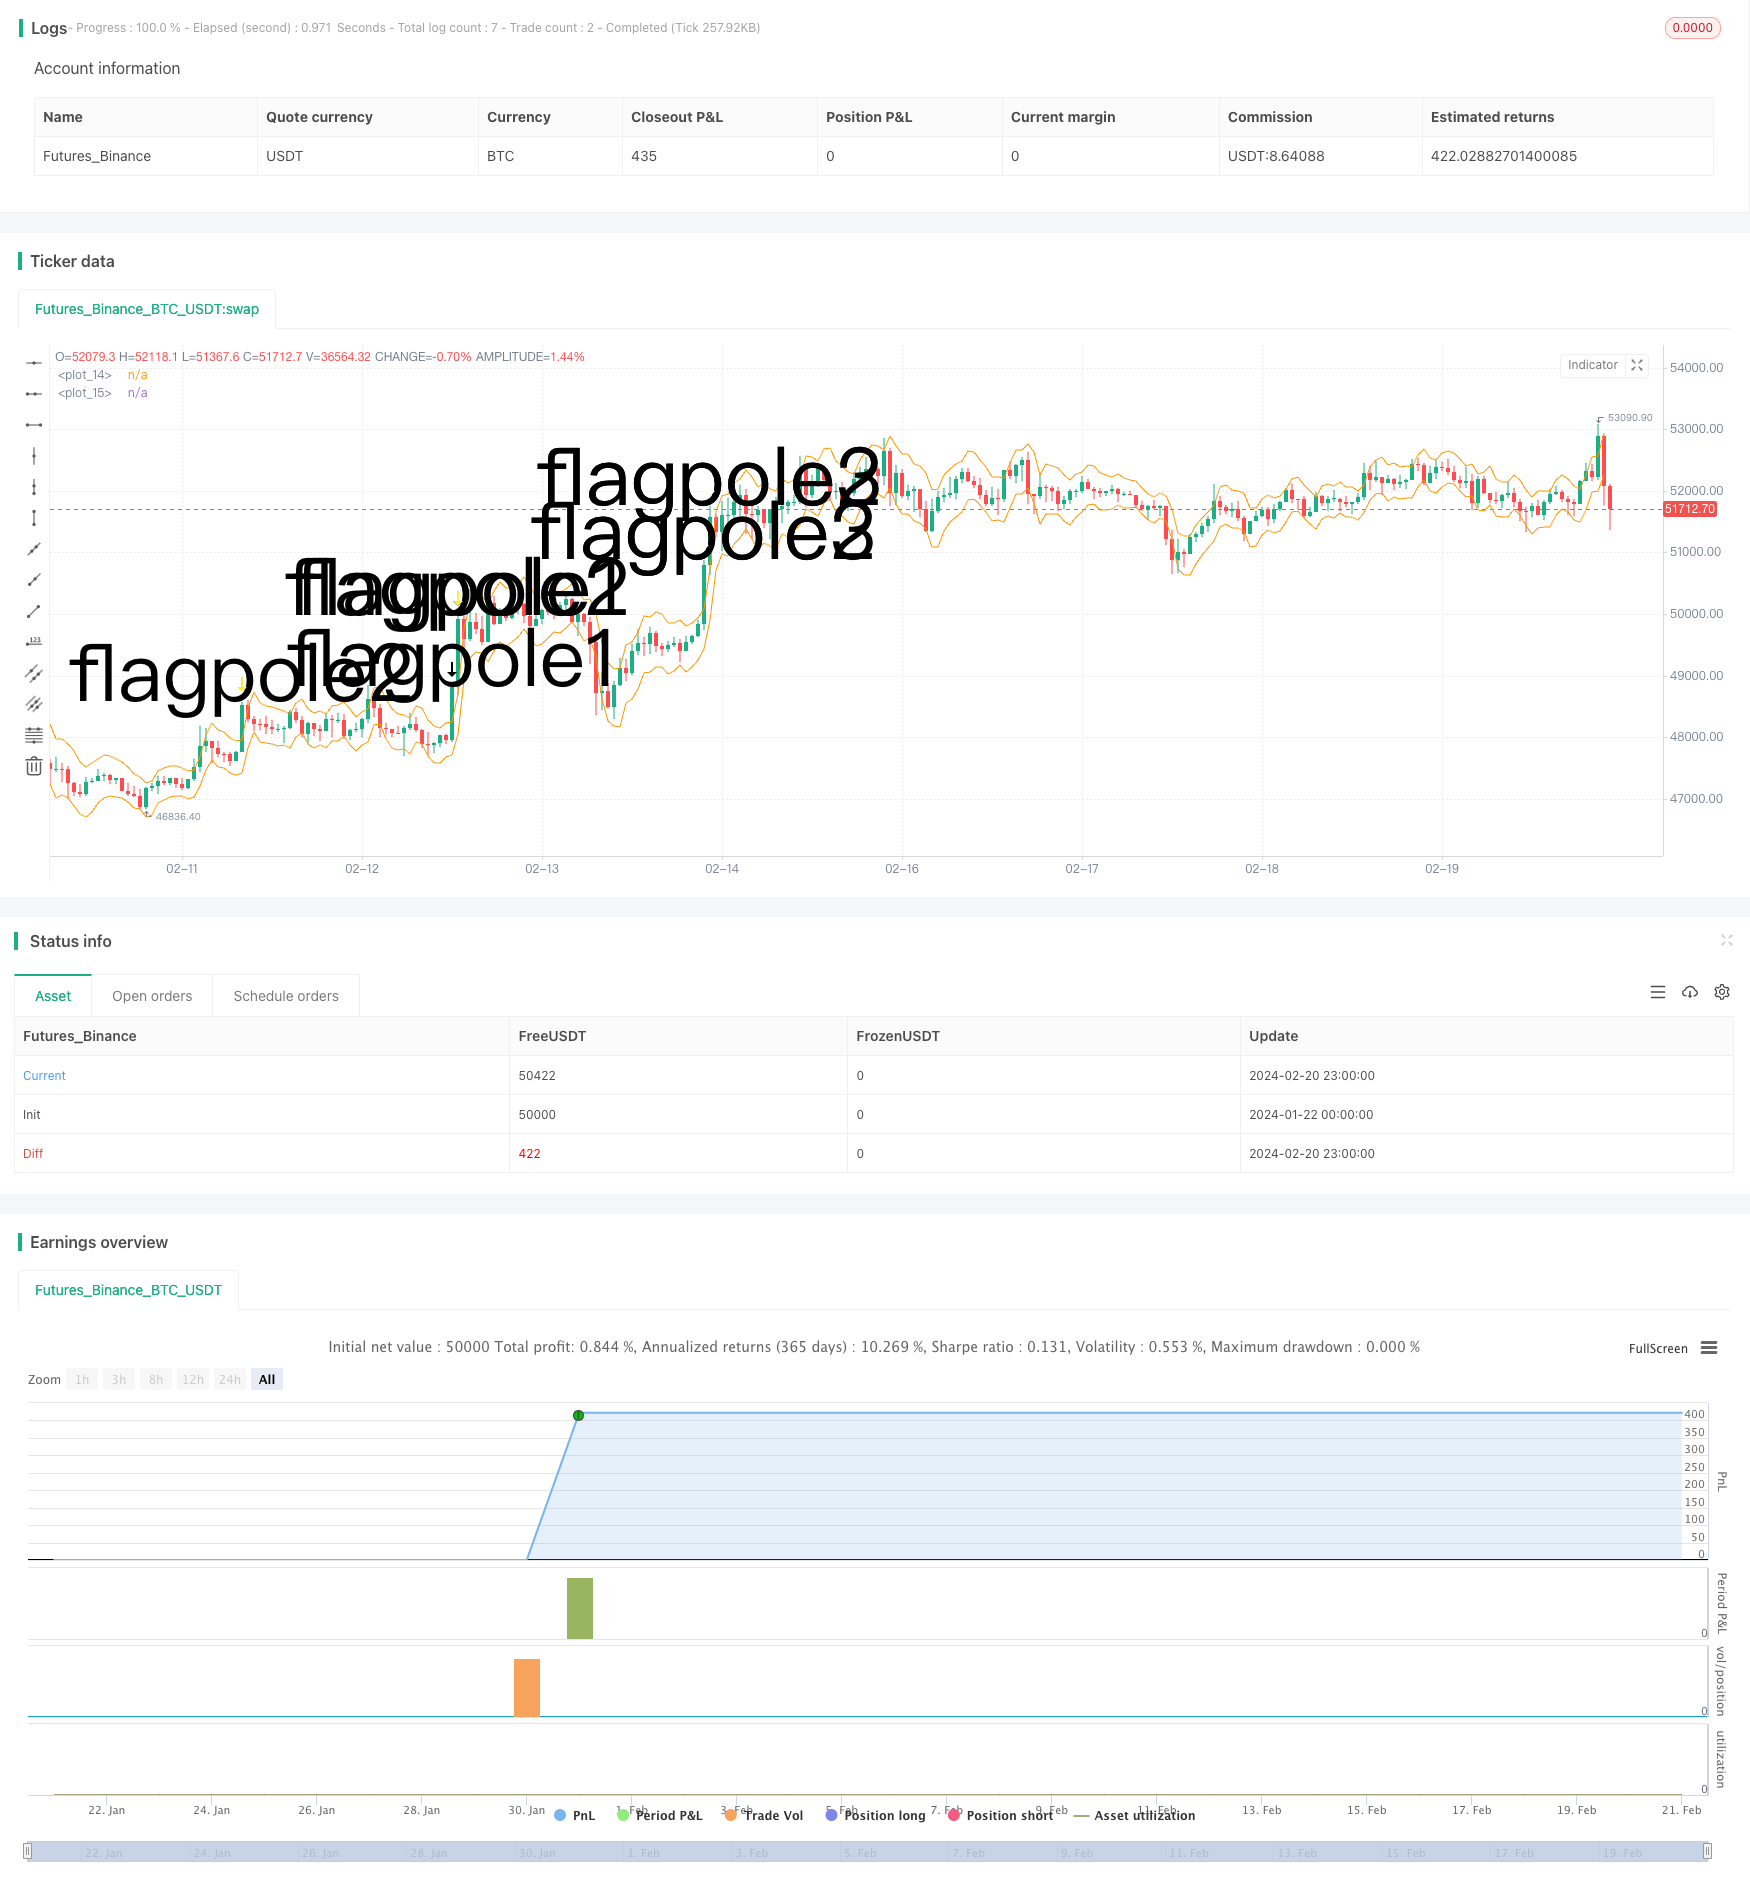
Флагманская стратегия прорыва - это стратегия технического анализа, целью которой является улавливать начало тренда, идентифицируя флагманскую графику и вступая в игру в точке прорыва. Эта стратегия использует средний реальный диапазон колебаний (ATR) в качестве вспомогательного суждения, чтобы судить о диапазоне флагов после четкого флагмана, чтобы отсеять возможности для входа в игру.
Стратегический принцип
Стратегия состоит из следующих шагов:
- Определение флагманов: необходимо удовлетворить высокие цены на инновации и прорыв в канале ATR.
- Определить высоту флагштока: измерить расстояние от вершины флагштока до предыдущего SMA.
- Определение диапазона флага: низкая точка флага составляет 33% от высоты флагштока как минимальный диапазон флага.
- Определить тип флага: определить, находятся ли первые 3 линии K в пределах флага.
- Вход: при появлении флага.
- Выход: 6 фиксированных K-линий после ликвидации.
При определении флагштоков и флагов стратегия хитро использует показатели ATR для определения явных прорывов и строго ограничивает высоту флага в пределах 33% от высоты флагштока, чтобы избежать чрезмерного количества ложных сигналов. Кроме того, определение, что 3 последовательных K-линии составляют флагштоки, имеет высокую надежность. В целом, правила стратегии разработаны строго, и у них действительно есть определенное преимущество в раннем прорыве тенденции.
Анализ преимуществ
Основные преимущества этой стратегии:
- Начинать с использования флагманской структуры для определения тенденции - более классический метод технического анализа, с более высоким уровнем успеха.
- ATR и строгие ограничения диапазона позволяют избежать большого количества ложных сигналов и повысить точность входа в систему.
- Фиксированный выход из 6 K-линий позволяет зафиксировать часть прибыли и избежать риска обратного хода.
- Правила стратегии понятны, просты в применении, легко усвояемы и подчиняются.
- Это позволяет найти возможности в различных ситуациях, а также повышает гибкость.
Анализ рисков
Основные риски этой стратегии включают:
- Некоторые из них, например, не могут полностью оценить тенденции, и есть случаи, когда они терпят неудачу.
- “К” - это слишком произвольно, и это может привести к преждевременному выходу из игры.
- Если ситуация становится слишком напряженной, это может привести к ложным флагам.
- Невозможно эффективно контролировать индивидуальные убытки.
Для этих рисков мы можем установить стратегию остановки убытков или оптимизировать механизм выхода из игры, чтобы вовремя получить прибыль, когда прибыль достигнет определенной доли. Кроме того, мы также можем фильтровать в сочетании с другими показателями, чтобы избежать ложных сигналов, когда ситуация становится слишком шокированной.
Направление оптимизации
Эта стратегия может быть оптимизирована в следующих направлениях:
- Используйте комбинацию MACD, KD и других показателей, чтобы избежать ложного сигнала при шокирующем движении.
- В зависимости от класса рынка, ATR-множитель, выездный цикл и т.д. позволяют более адаптивной стратегии.
- Установка движущегося стоп-лосса или рассмотрение снятия прибыли по сравнению с динамическим выходом.
- Попробуйте использовать методы машинного обучения, чтобы найти более точные характеристики, определяющие высоту флага.
- Оценка фактических выигрышей и убытков, динамическая корректировка размеров позиций.
Подвести итог
В целом, флагманская прорывная стратегия, использующая тенденцию к определению технологических форм, является более классическим методом, который действительно строг в разработке правил входа и может фильтровать большое количество ложных сигналов. Однако существует еще место для оптимизации механизмов контроля риска и выхода, которые мы можем рассматривать с точки зрения целостности, чтобы стратегия могла стабильно работать на разных рынках. Если эта стратегия будет полностью проверена и оптимизирована, она может стать ценной частью системы количественных торгов.
/*backtest
start: 2024-01-22 00:00:00
end: 2024-02-21 00:00:00
period: 1h
basePeriod: 15m
exchanges: [{"eid":"Futures_Binance","currency":"BTC_USDT"}]
*/

// © smith26
//This strategy enters on a bull flag and closes position 6 bars later.  Average true range is used instead of a moving average.
//The reason for ATR instead of MA is because with volatile securities, the flagpole must stand up a noticable "distance" above the trading range---which you can't determine with a MA alone.
//This is broken up into multiple parts: Defining a flagpole, defining the pole height, and defining the flag, which will be constrained to the top third (33%) of the pole height to be considered a flag.
//@version=4
strategy("Bull Flag v1.00", overlay=true)

ATR = atr(10) //Average True Range over last 10 bars.

upperATR = ohlc4[1] + ATR[1]  //Open + High + Low + Close divided by 4, + prior ATR.  Just used here for visually plotting the ATR upper channel.
lowerATR = ohlc4[1] - ATR[1] //Open + High + Low + Close divided by 4, - prior ATR.  Just used here for visually plotting the ATR lower channel.

//uncomment these two lines to see ATR channels
plot(upperATR, color=color.orange)
plot (lowerATR, color=color.orange)

//Current close higher than previous close, and current close minus current open is greater than 3 times the previous ATR.  "3x ATR" is chosen because any less was not a noticeable distance above the trading range.
flagpole1 = close>close[1] and (close-open) > (ATR[1] * 3)
plotshape(flagpole1, text="flagpole1", style=shape.arrowdown, size=size.huge) //Plots an arrow for flagpole1 for QA testing

//Two consecutive close higer than their previous close, and current close minus PREVIOUS open is greater than 3 times the previous ATR.
flagpole2 = close>close[1] and close[1]>close[2] and (close-open[1]) > (ATR[1] * 3)
plotshape(flagpole2, text="flagpole2", style=shape.arrowdown, size=size.huge, color=color.yellow) //Plots an arrow for flagpole2 for QA testing

//Three consecutive close higer than their previous close, and current close minus open from 2 bars ago is greater than 3 times the previous ATR.
flagpole3 = close>close[1] and close[1]>close[2] and close[2]>close[3] and (close-open[2]) > (ATR[1] * 3)
plotshape(flagpole3, text="flagpole3", style=shape.arrowdown, size=size.huge, color=color.white) //Plots an arrow for flagpole3 for QA testing

//A flagpole can be any of the three definitions of flagpole.
flagpole = flagpole1 or flagpole2 or flagpole3

//This will return the number of bars since "flagpole" was true.  Not being used, but could be useful.
//since_flagpole = barssince(flagpole)

after_pole_1 = flagpole[1] //This marks the bar directly after a flagpole.
//plotshape(after_pole_1, text="after_pole_1", style=shape.cross, size=size.large, color=color.white) //Plots a cross for after_pole_1 for QA testing
after_pole_2 = flagpole[2] //This marks the bar two bars after a flagpole.
after_pole_3 = flagpole[3] //This marks the bar three bars after a flagpole.

//This returns the price at the "top" of the flagpole (using close price) at the most recent occurence, 0.
pole_top = valuewhen(flagpole, close, 0)
//plot(pole_top, trackprice=true)  //plots a horizontal line at the most recent pole_top

//Measures the distance between last pole top and the previous SMA.
pole_height = pole_top - sma(close, 10)[1]
//plot(pole_height)

//This marks 33% below the pole_top, which will be the lowest point a flag can be.
flag_bottom = pole_top - (.33 * pole_height)
//plot(flag_bottom)

//The first, second, and third bars after the pole are considered part of a flag when open and close are between the pole_top and flag_bottom
flag1 = after_pole_1 and (open >= flag_bottom) and (open <= pole_top) and (close >= flag_bottom) and (close <= pole_top)
//plotshape(flag1, text="flag1", style=shape.flag, size=size.large, color=color.teal)
flag2 = after_pole_2 and (open >= flag_bottom) and (open <= pole_top) and (close >= flag_bottom) and (close <= pole_top)
//plotshape(flag2, text="flag2", style=shape.flag, size=size.large, color=color.teal)
flag3 = after_pole_3 and (open >= flag_bottom) and (open <= pole_top) and (close >= flag_bottom) and (close <= pole_top)
//plotshape(flag3, text="flag3", style=shape.flag, size=size.large, color=color.teal)

//When all three bars after a flagpole are a flag, the criteria are met and we have a "bull_flag"
//Specifically, when current bar is flag3, previous bar is flag2, and 2 bars ago is flag1, we have a bull_flag.
bull_flag = flag3 and flag2[1] and flag1[2]
plotshape(bull_flag, text="bull_flag", style=shape.flag, size=size.large, color=color.white) //Plots a flag for bull_flag for QA testing


if (bull_flag)
    strategy.entry("Long", strategy.long)

if barssince(bull_flag) == 6 //close 6 bars after entry.
    strategy.close("Long")