
Chiến lược Hyundai và siêu xu hướng là một chiến lược theo dõi xu hướng kết hợp biểu đồ Hyundai và chỉ số siêu xu hướng. Chiến lược này được thiết kế để xác định hướng của xu hướng, giao dịch trong khu vực xu hướng và thoát ra nhanh chóng khi xu hướng đảo ngược, để giảm thiểu tối đa thiệt hại của giao dịch không xu hướng.
Biểu đồ Hyundai Hyundai là một biểu đồ K-line đặc biệt, sử dụng giá mở, giá đóng, giá cao nhất và giá thấp nhất để vẽ các thực thể của Hyundai, do đó có thể lọc tiếng ồn thị trường và làm cho đồ thị rõ ràng hơn. Chỉ số xu hướng siêu được tạo thành từ hai đường cong, để đánh giá hướng xu hướng thông qua các đường hỗ trợ và kháng cự động.
Chiến lược này đầu tiên tính toán biểu đồ HAI, sau đó dựa trên đường HAI K tính toán các chỉ số xu hướng siêu. Khi giá phá vỡ các chỉ số xu hướng siêu, tạo ra tín hiệu giao dịch. Cụ thể, chiến lược này sử dụng đường HAI K để tính toán bước sóng thực, sau đó kết hợp bước sóng và giá trung bình để có được đường lên xuống của xu hướng siêu.
Chiến lược cũng đã tối ưu hóa các tham số cho các chỉ số siêu xu hướng, sử dụng các tham số kết hợp tốt nhất, do đó làm tăng độ nhạy của chỉ số. Ngoài ra, chiến lược đã thêm một cơ chế dừng lỗ, có thể kiểm soát rủi ro trong khi đảm bảo lợi nhuận.
Chiến lược Hyundai và siêu xu hướng là một chiến lược theo dõi xu hướng. Nó có thể xác định hướng xu hướng, giao dịch theo xu hướng lớn và dừng lại nhanh chóng khi đảo ngược. Chiến lược tích hợp bộ lọc tiếng ồn của biểu đồ Hyundai và khả năng nắm bắt nhanh chóng sự thay đổi xu hướng của chỉ số siêu xu hướng.
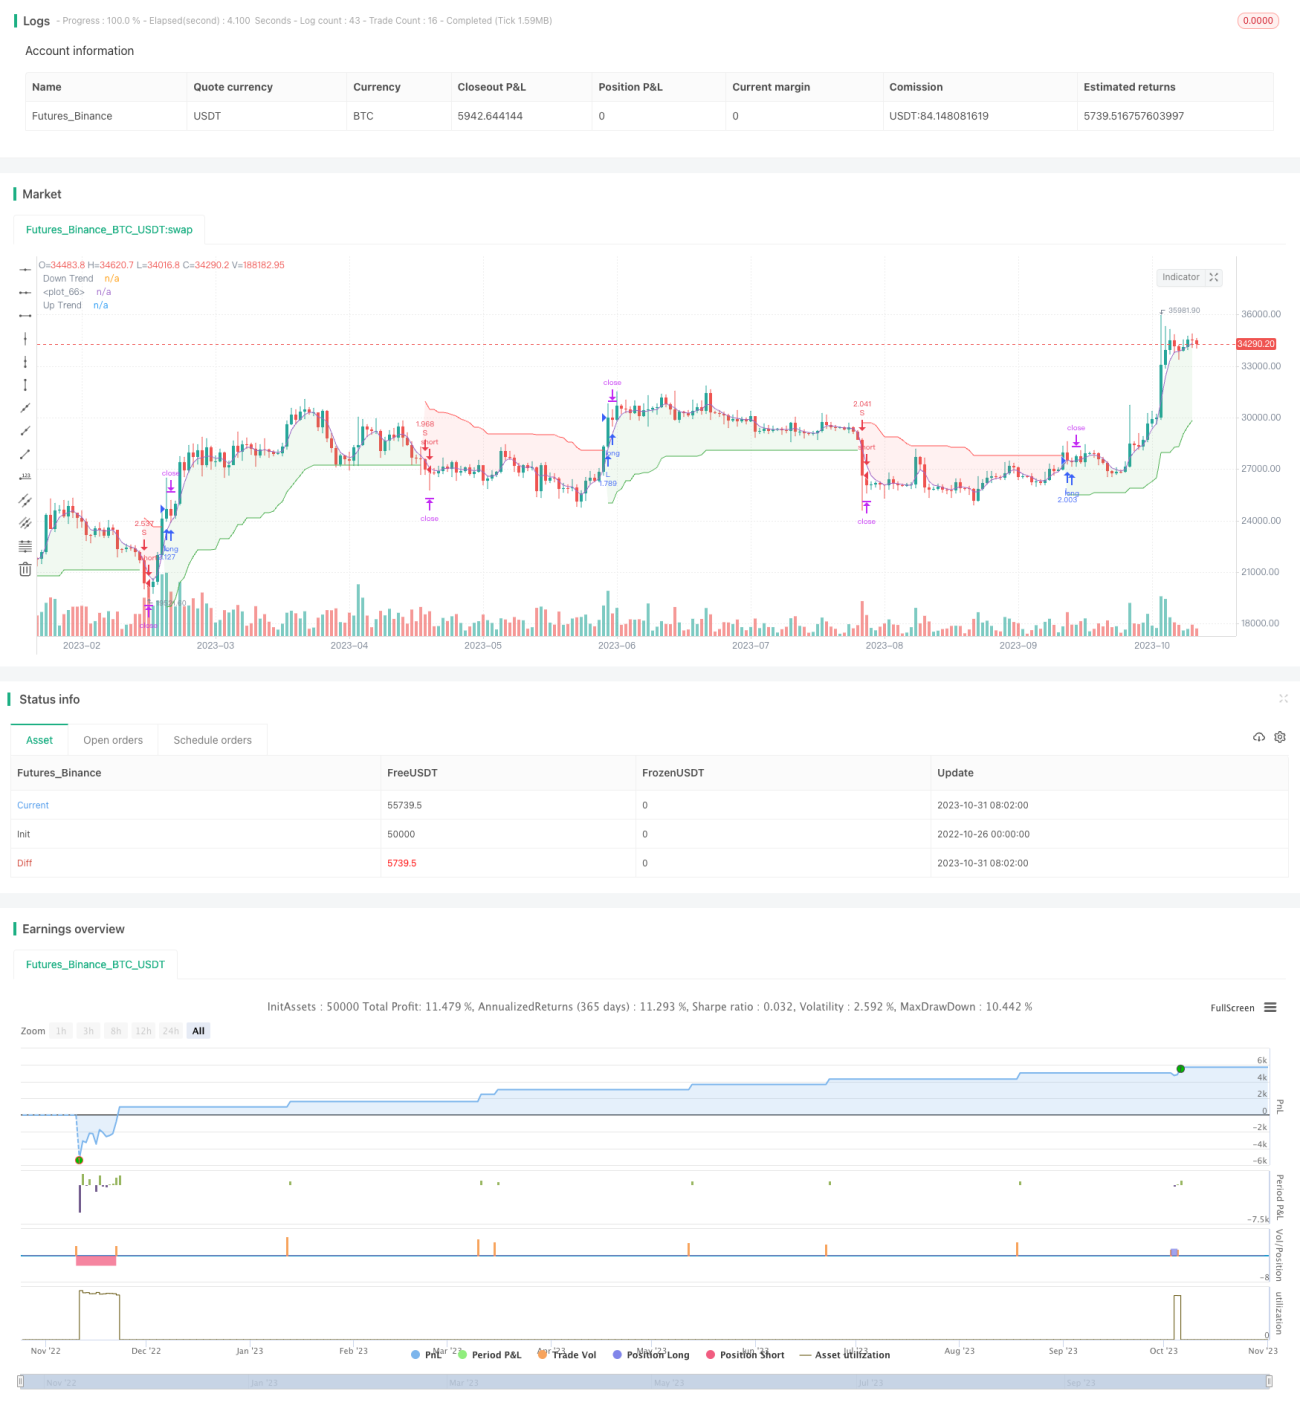
/*backtest
start: 2022-10-26 00:00:00
end: 2023-11-01 00:00:00
period: 1d
basePeriod: 1h
exchanges: [{"eid":"Futures_Binance","currency":"BTC_USDT"}]
*/
//@version=5
strategy("Heiken Ashi & Super Trend_ARM", overlay=true, pyramiding=1,initial_capital = 10000, default_qty_type= strategy.percent_of_equity, default_qty_value = 100, calc_on_order_fills=false, slippage=0,commission_type=strategy.commission.percent,commission_value=0.02)
///////////////////////////////////////////////////
////////////////////Function///////////////////////
///////////////////////////////////////////////////
heikinashi_open = request.security(ticker.heikinashi(syminfo.tickerid), timeframe.period, open)
heikinashi_high = request.security(ticker.heikinashi(syminfo.tickerid), timeframe.period, high)
heikinashi_low = request.security(ticker.heikinashi(syminfo.tickerid), timeframe.period, low)
heikinashi_close= request.security(ticker.heikinashi(syminfo.tickerid), timeframe.period, close)
heikinashi_color = heikinashi_open < heikinashi_close ? #53b987 : #eb4d5c
// plotbar(heikinashi_open, heikinashi_high, heikinashi_low, heikinashi_close, color=heikinashi_color)
x_sma(x, y) =>
sumx = 0.0
for i = 0 to y - 1
sumx := sumx + x[i] / y
sumx
x_rma(src, length) =>
alpha = 1/length
sum = 0.0
sum := na(sum[1]) ? x_sma(src, length) : alpha * src + (1 - alpha) * nz(sum[1])
x_atr(length) =>
trueRange = na(heikinashi_high[1])? heikinashi_high-heikinashi_low : math.max(math.max(heikinashi_high - heikinashi_low, math.abs(heikinashi_high - heikinashi_close[1])), math.abs(heikinashi_low - heikinashi_close[1]))
//true range can be also calculated with ta.tr(true)
x_rma(trueRange, length)
x_supertrend(factor, atrPeriod) =>
src = (heikinashi_high+heikinashi_low)/2
atr = x_atr(atrPeriod)
upperBand = src + factor * atr
lowerBand = src - factor * atr
prevLowerBand = nz(lowerBand[1])
prevUpperBand = nz(upperBand[1])
lowerBand := lowerBand > prevLowerBand or heikinashi_close[1] < prevLowerBand ? lowerBand : prevLowerBand
upperBand := upperBand < prevUpperBand or heikinashi_close[1] > prevUpperBand ? upperBand : prevUpperBand
int direction = na
float superTrend = na
prevSuperTrend = superTrend[1]
if na(atr[1])
direction := 1
else if prevSuperTrend == prevUpperBand
direction := heikinashi_close > upperBand ? -1 : 1
else
direction := heikinashi_close < lowerBand ? 1 : -1
superTrend := direction == -1 ? lowerBand : upperBand
[superTrend, direction]
///////////////////////////////////////////////////
////////////////////Indicators/////////////////////
///////////////////////////////////////////////////
factor = input.float(3.0, "Factor", step = 0.01)
atrPeriod = input(10, "ATR Length")
[supertrend, direction] = x_supertrend(factor, atrPeriod)
bodyMiddle = plot((heikinashi_open + heikinashi_close) / 2, display=display.none)
upTrend = plot(direction < 0 ? supertrend : na, "Up Trend", color = color.green, style=plot.style_linebr)
downTrend = plot(direction < 0? na : supertrend, "Down Trend", color = color.red, style=plot.style_linebr)
fill(bodyMiddle, upTrend, color.new(color.green, 90), fillgaps=false)
fill(bodyMiddle, downTrend, color.new(color.red, 90), fillgaps=false)
///////////////////////////////////////////////////
////////////////////Strategy///////////////////////
///////////////////////////////////////////////////
var bool longCond = na, var bool shortCond = na, longCond := nz(longCond[1]), shortCond := nz(shortCond[1])
var int CondIni_long = 0, var int CondIni_short = 0, CondIni_long := nz(CondIni_long[1]), CondIni_short := nz(CondIni_short[1])
var float open_longCondition = na, var float open_shortCondition = na
long = ta.change(direction) < 0
short = ta.change(direction) > 0
longCond := long
shortCond := short
CondIni_long := longCond[1] ? 1 : shortCond[1] ? -1 : nz(CondIni_long[1])
CondIni_short := longCond[1] ? 1 : shortCond[1] ? -1 : nz(CondIni_short[1])
longCondition = (longCond[1] and nz(CondIni_long[1]) == -1)
shortCondition = (shortCond[1] and nz(CondIni_short[1]) == 1)
open_longCondition := long ? close[1] : nz(open_longCondition[1])
open_shortCondition := short ? close[1] : nz(open_shortCondition[1])
//TP
tp = input.float(1.1 , "TP [%]", step = 0.1)
//BACKTESTING inputs --------------------------------------------------------------------------------------------------------------------------------------------------------------------------------------------------------------------------------------------------------------------------------------------------------
testStartYear = input.int(2000, title="start year", minval = 1997, maxval = 3000, group= "BACKTEST")
testStartMonth = input.int(01, title="start month", minval = 1, maxval = 12, group= "BACKTEST")
testStartDay = input.int(01, title="start day", minval = 1, maxval = 31, group= "BACKTEST")
testPeriodStart = timestamp(testStartYear,testStartMonth,testStartDay,0,0)
testStopYear = input.int(3333, title="stop year", minval=1980, maxval = 3333, group= "BACKTEST")
testStopMonth = input.int(12, title="stop month", minval=1, maxval=12, group= "BACKTEST")
testStopDay = input.int(31, title="stop day", minval=1, maxval=31, group= "BACKTEST")
testPeriodStop = timestamp(testStopYear, testStopMonth, testStopDay, 0, 0)
testPeriod = time >= testPeriodStart and time <= testPeriodStop ? true : false
// Backtest ==================================================================================================================================================================================================================================================================================================================================
if longCond
strategy.entry("L", strategy.long, when=testPeriod)
if shortCond
strategy.entry("S", strategy.short, when=testPeriod)
strategy.exit("TP_L", "L", profit =((open_longCondition * (1+(tp/100))) - open_longCondition)/syminfo.mintick)
strategy.exit("TP_S", "S", profit =((open_shortCondition * (1+(tp/100))) - open_shortCondition)/syminfo.mintick)