Chiến lược giao dịch ngắn hạn theo xu hướng

Tổng quan
Chiến lược này là một chiến lược giao dịch ngắn dựa trên nhiều chỉ số để đánh giá xu hướng. Nó sử dụng tổng hợp 8 chỉ số bao gồm WOW, BMA, BarColor, SuperTrend, DI, TTS, RSI và WTO để đánh giá xu hướng và đưa ra quyết định mua và bán.
Nguyên tắc chiến lược
Chiến lược này bắt đầu bằng cách tính toán và đánh giá xu hướng của tám chỉ số WOW, BMA, BarColor, SuperTrend, DI, TTS, RSI và WTO.
Chỉ số WOW được đánh giá theo vị trí của thực thể trong giá. Nếu vị trí của thực thể gần đường đua, nó là đi lên; Nếu gần đường đua, nó là đi xuống.
Chỉ số BMA được sử dụng để đánh giá xu hướng dựa trên mối quan hệ dư thừa của SMA, nếu giá đóng cửa trên SMA phá vỡ giá mở cửa, SMA là lạc quan và giảm giá.
Chỉ số BarColor được đánh giá theo xu hướng dựa trên màu sắc của đường K, nhiều đường dương liên tiếp là lên và đường âm là xuống.
Chỉ số SuperTrend đánh giá xu hướng giá dựa trên phạm vi biến động trung bình, giá là lạc quan ở trên đường ray và giảm ở dưới đường ray.
Chỉ số DI là để đánh giá xu hướng dựa trên mối quan hệ giữa kích thước và kích thước của động lực đa đầu, động lực đa đầu lớn hơn động lực vô đầu là lạc quan, ngược lại là đi xuống.
Chỉ số TTS đánh giá xu hướng nhiều không gian dựa trên mối quan hệ giữa giá và vị trí của đường trung bình.
Chỉ số RSI đánh giá xu hướng dựa trên vị trí của chỉ số tương đối mạnh.
Các chỉ số WTO đánh giá xu hướng dựa trên sự chênh lệch của chỉ số biến động.
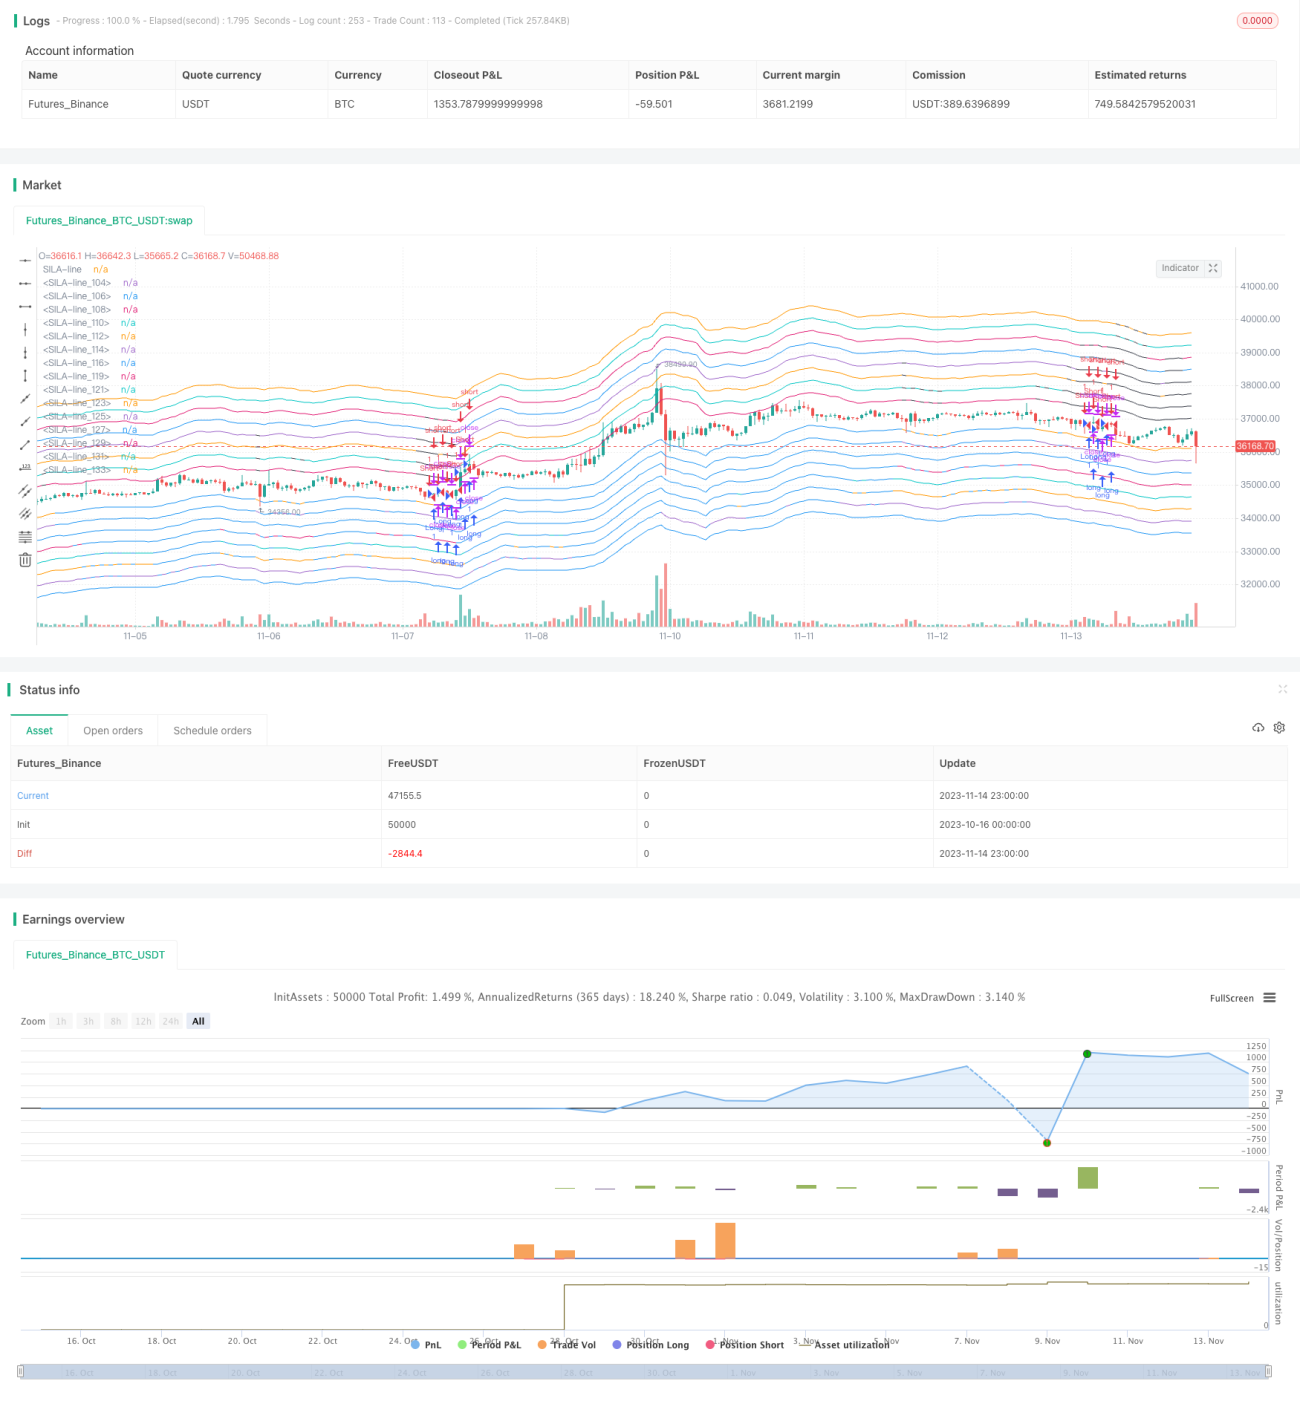
Sau đó, chiến lược sẽ thống kê số lượng đà đi xuống của 8 chỉ số và vẽ các đường hỗ trợ và kháng cự giảm giá SILA theo cấp độ dựa trên số lượng đà đi xuống của 8 chỉ số. Số lượng đường hỗ trợ và kháng cự càng nhiều, tín hiệu xu hướng càng mạnh.
Khi một số chỉ số tăng, nếu giá đóng cửa nằm trên đường hỗ trợ ở mức thấp nhất, nó sẽ tạo ra một tín hiệu mua; khi một số chỉ số giảm, nếu giá đóng cửa nằm dưới đường kháng cự ở mức thấp nhất, nó sẽ tạo ra một tín hiệu bán.
Ngoài ra, chiến lược này cũng sử dụng hình dạng đường K để đánh giá cơ hội điều chỉnh ngắn hạn, tìm kiếm điểm vào thuận lợi hơn khi xu hướng đảo ngược.
Lợi thế chiến lược
- Kết hợp nhiều chỉ số để đánh giá xu hướng, tăng độ chính xác của đánh giá
Chiến lược này không phụ thuộc vào chỉ số duy nhất, mà sử dụng tổng hợp 8 chỉ số đánh giá xu hướng phổ biến, đánh giá xu hướng đa chiều, có thể nâng cao độ chính xác và độ tin cậy của phán đoán.
- Hệ thống SILA vẽ kháng cự hỗ trợ phân cấp, nhận ra tín hiệu xu hướng mạnh mẽ
Chiến lược này dựa trên các tín hiệu đi hay xuống của nhiều chỉ số, sử dụng hệ thống SILA để vẽ nhiều mức hỗ trợ và kháng cự. Số lượng đường càng nhiều, tín hiệu xu hướng càng mạnh. Điều này có thể giúp các nhà giao dịch nhận biết thêm về sức mạnh của tín hiệu.
- Kết hợp hình dạng K để tìm cơ hội gọi lại, điểm vào sân tốt hơn
Chiến lược này không chỉ dựa trên các chỉ số xu hướng, mà còn kết hợp với hình dạng K để tìm cơ hội điều chỉnh ngắn hạn, vào điểm thay đổi xu hướng, có thể giành được vị trí vào điểm tốt hơn.
Rủi ro chiến lược
- Có thể có sự khác biệt giữa nhiều chỉ số
Chiến lược này sử dụng nhiều chỉ số, trong một số trường hợp, có thể có sự phân biệt giữa các chỉ số này, cần người giao dịch cân nhắc, làm tăng khó khăn trong việc ra quyết định.
- Cài đặt tham số chỉ số có thể cần tối ưu hóa
Nhiều chỉ số trong chiến lược này được sử dụng các tham số mặc định, trong thực tế, các tham số có thể cần được tối ưu hóa để có hiệu quả tốt nhất.
- Cần xem xét rủi ro hệ thống
Trong trường hợp xảy ra một sự kiện Black Swan quan trọng, rủi ro hệ thống có thể dẫn đến việc chỉ số kỹ thuật thông thường không hoạt động và cần chú ý đánh giá rủi ro hệ thống của thị trường.
- Rủi ro rút lui
Việc rút lui theo xu hướng có thể lớn hơn trong giai đoạn mở rộng, cần chú ý kiểm soát quy mô giao dịch đơn lẻ để hạn chế rút lui.
Hướng tối ưu hóa chiến lược
- Tối ưu hóa kiểm tra các tham số chỉ số
Các tham số của các chỉ số như độ dài chu kỳ, kích thước số, v.v. có thể được tối ưu hóa bằng cách sử dụng phương pháp có hệ thống hơn để tìm kiếm sự kết hợp tham số tốt nhất.
- Tăng Hạn chế
Bạn có thể cân nhắc thêm Stop Loss di động hoặc Stop Loss phần trăm để kiểm soát rút lui.
- Chỉ số kết hợp
Có thể đưa ra các chỉ số định lượng như MAVP, OBV và các chỉ số xu hướng để tăng độ chính xác của quyết định chiến thuật.
- Tối ưu hóa quản lý vị trí
Có thể nghiên cứu tỷ lệ giữ vị trí trong các giai đoạn thị trường khác nhau để tăng vị trí khi xu hướng rõ ràng hơn.
Tóm tắt
Chiến lược này Overall là một chiến lược giao dịch đường ngắn theo dõi xu hướng đa chỉ số. Nó sử dụng nhiều chỉ số để đánh giá hướng xu hướng, sử dụng hệ thống SILA để nhận ra cường độ tín hiệu và hỗ trợ tối ưu hóa tham gia hình dạng K. Chiến lược này có thể giúp cải thiện độ chính xác của phán đoán, nhưng cần chú ý đến rủi ro khác biệt của các chỉ số khác nhau. Bước tiếp theo có thể cải thiện thêm chiến lược này thông qua các phương pháp tối ưu hóa tham số, tối ưu hóa dừng lỗ, kết hợp năng lượng và các phương pháp khác.
- 1