Chiến lược giao dịch định lượng trung bình động ba chàng lính ngự lâm
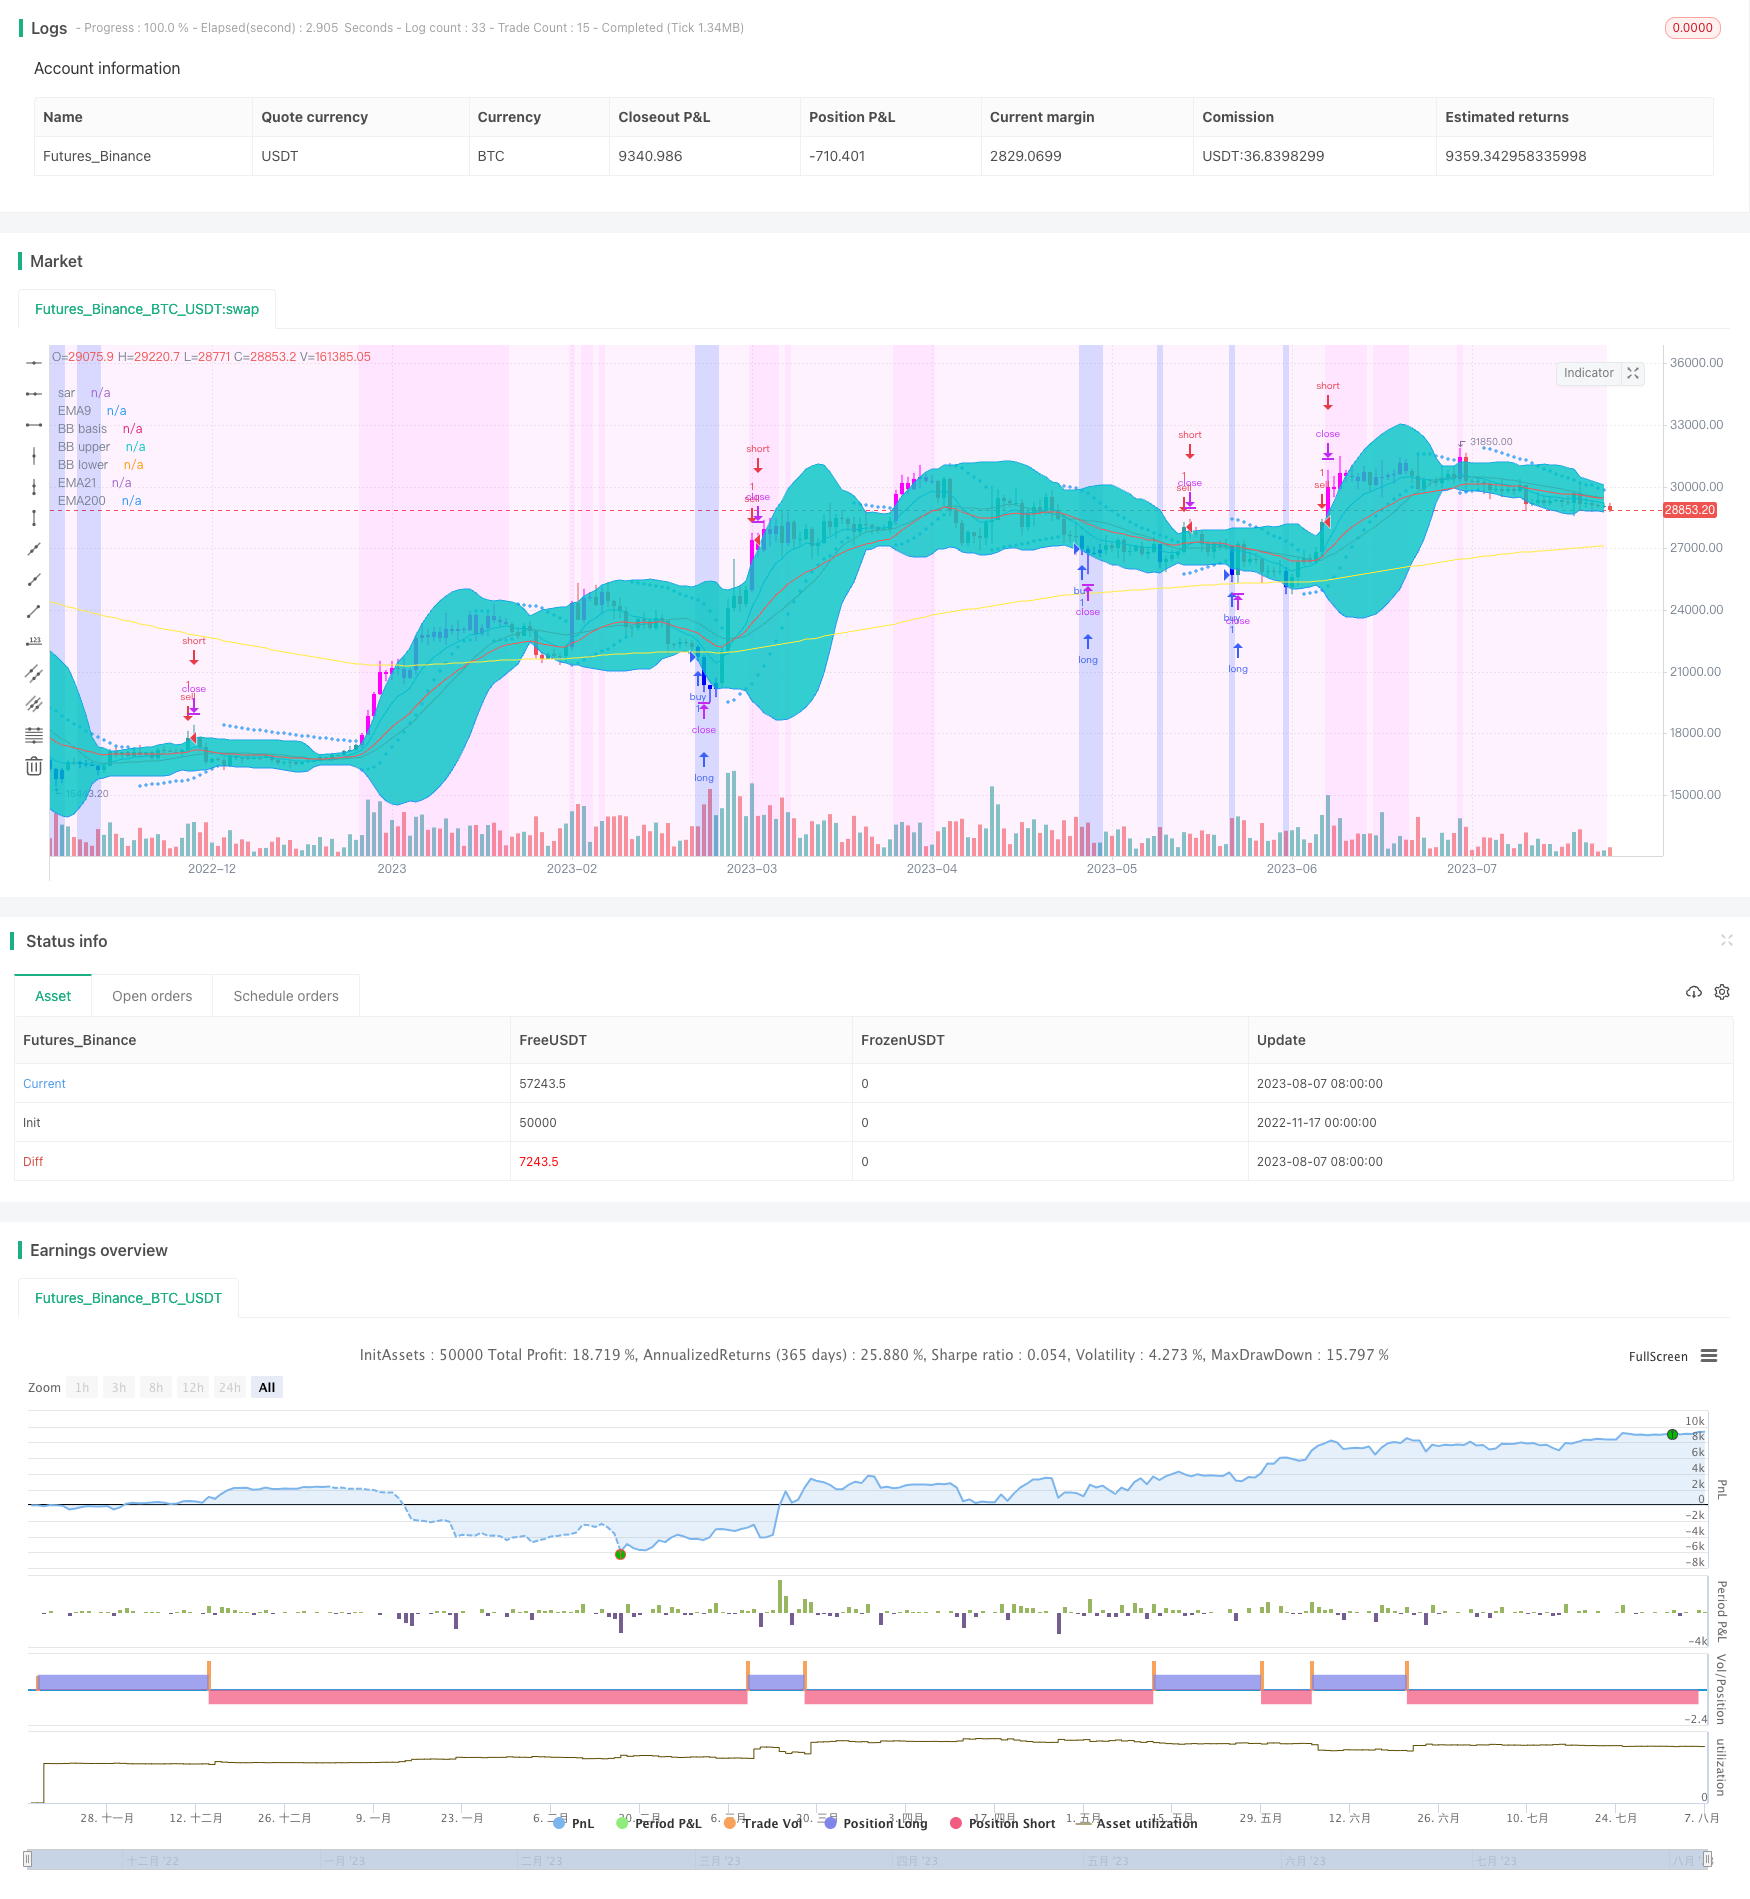
Tóm tắt: Chiến lược này là một chiến lược phân tích kỹ thuật điển hình, sử dụng một số chỉ số đường trung bình thường được sử dụng EMA và các chỉ số phụ trợ như RSI, MACD, PSR, hình thành quy tắc vào và dừng lỗ bằng cách kết hợp các tín hiệu chỉ số và cấu hình đường trung bình theo chu kỳ khác nhau để tìm cơ hội mua thấp và bán cao.
Nguyên tắc chiến lược: Nền tảng của chiến lược là đường trung bình 5, 9 và 21 ngày. Khi đường trung bình ngắn hạn vượt qua đường trung bình dài hạn, người ta thấy nhiều, và khi đường trung bình ngắn hạn vượt qua đường trung bình dài hạn, người ta thấy không có gì. Ngoài ra, kết hợp với chỉ số RSI để đánh giá quá mua quá bán, chỉ số MACD để xác định xu hướng, chỉ số PSR để xác định kháng cự hỗ trợ cho việc giao dịch kết hợp.
Phân tích chiến lược:
- Chỉ số đường trung bình rõ ràng, trực quan, dễ dàng đánh giá xu hướng.
- RSI có thể xác định hiệu quả hiện tượng quá mua quá bán, MACD xác định xu hướng dài ngắn, PSR tìm ra mức giá quan trọng, các chỉ số hỗn hợp bổ sung cho nhau.
- Nhiều quy tắc và tham số nhập cảnh có tính linh hoạt.
- Có nhiều chỉ số và tham số có thể tối ưu hóa, có thể được điều chỉnh và tối ưu hóa theo thị trường.
Phân tích rủi ro:
- Các hoạt động ngắn hạn khó nắm bắt được xu hướng lớn và có nguy cơ bỏ lỡ sự đảo ngược.
- Thiết lập tham số không đúng có thể dẫn đến quá nhiều tín hiệu giả hoặc tín hiệu bị bỏ lỡ.
- Các chỉ số kỹ thuật có thể dễ bị các cơ quan đấu giá lợi nhuận lợi dụng để gây tổn thất.
- Những người dân địa phương thường bị ảnh hưởng bởi trận động đất.
Phản ứng:
- Cần nắm bắt được xu hướng đường dài và ngăn chặn các hoạt động đường ngắn ngược.
- Tối ưu hóa sự kết hợp các tham số, thiết lập dừng lỗ, kiểm soát rủi ro.
- Chú ý đến khả năng quay trở lại ở mức cao và hồi phục ở mức thấp
Định hướng tối ưu hóa:
- Điều chỉnh tham số đường trung bình, thử nghiệm kết hợp tốt nhất.
- Thêm các chỉ số phụ trợ khác để lọc tín hiệu.
- Tăng khả năng đánh giá các chỉ số học máy.
- Tăng độ chính xác tín hiệu kết hợp với sự thay đổi khối lượng giao dịch.
- Tăng các chiến lược ngăn chặn tổn thất để ngăn chặn sự gia tăng tổn thất.
Tóm lại: Chiến lược này tích hợp nhiều tín hiệu chỉ số phụ trợ, tận dụng lợi thế của chỉ số đường trung bình, khai thác cơ hội mua bán ngắn. Bằng cách tối ưu hóa các tham số và kết hợp các chỉ số, hiệu quả chiến lược có thể được nâng cao liên tục, nhưng cần kiểm soát tần suất và rủi ro hoạt động một cách vừa phải, để ngăn chặn tổn thất đơn lẻ ảnh hưởng quá nhiều đến lợi nhuận tổng thể.
||
Overview: This strategy is a typical technical analysis strategy that utilizes several common moving average indicators like EMA and auxiliary indicators like RSI, MACD, PSR to form entry and stop loss rules for finding low buy high sell opportunities.
Principle: The core of this strategy is the 5, 9, 21 day moving averages. When the short period MA crosses over the long period one, it signals an uptrend; when the short period MA crosses below the long period one, it signals a downtrend. In addition, RSI is used to determine overbought and oversold levels, MACD to judge the trend, PSR to identify support and resistance for combo trading. The background color shows market sentiment to assist trend judgment. The parameters are customizable for configuring entry rules.
Advantages:
- MA indicators give clear trend direction.
- RSI effectively spots overbought/oversold levels, MACD judges short-long trend, PSR finds key price levels. The indicators are complementary.
- Flexible entry rules and parameter settings.
- Many optimizable indicators and parameter combinations adaptable to varying market conditions.
Risks:
- Short-term operations may fail to capture major trend and miss reversals.
- Improper parameter configuration can lead to too many false signals or missing good signals.
- Pure technical indicators are susceptible to manipulation by arbitrageurs causing losses.
- Prone to being stopped out in high volatile markets.
Solutions:
- Capture mid-long term trend appropriately to avoid trading against major trend.
- Optimize parameters, use stop loss to control risks.
- Watch out the possibilities of pullback from highs and bounce from lows.
Optimization:
- Fine tune MA parameters for best combo.
- Add more indicators to filter signals.
- Increase machine learning metrics for probability estimate.
- Combine volume changes to enhance signal accuracy.
- Add stop loss to restrict loss expansion.
Summary: This strategy integrates multiple auxiliary signals, leverages the strength of MA indicators to identify short-term low buy high sell chances. Parameters and indicators combinations may be optimized continuously to improve strategy efficacy, but operation frequency and risks should be moderated to prevent oversized single trade loss from eroding overall profitability.
[/trans]
/*backtest
start: 2022-11-17 00:00:00
end: 2023-08-08 00:00:00
period: 1d
basePeriod: 1h
exchanges: [{"eid":"Futures_Binance","currency":"BTC_USDT"}]
*/

//@version=3
strategy("f.society v7", title="f.society v7", overlay=true)
//@Author: rick#1414
// -----------------------------------------------------
// f.society : Pone 3EMA: 5, 9, 21, 50, 100, 200, SAR,
// velas azules en sobreventa y velas moradas sobre compra
// SAR 0.02, 0.02, 0.2 , Bandas de Bollinger
// estrategia de compra y venta con rsi, macd o psr
// color de fondo: ema, rsi (color azul sobreventa 35, 25 (mas intenso))
// -----------------------------------------------------
// Como agregar a Trading view:
// 1 Cerrar todos los otros indicadores antes de añadirlo
// 2. Ir a la página de inicio TradingView.com
// 3. En la parte inferior, haga clic en Editor Pine // ver imagen: // https://cdn.discordapp.com/attachments/407267549047422976/407393815112974336/unknown.png
// 4. borrar todo el texo y reemplazar con todo el contenido de este archivo
// 5. Pulse el botón "Añadir a trazar" (Add to graph)
// -----------------------------------------------------
// revisar opciones de on y off segun indicadores deseados
// https://cdn.discordapp.com/attachments/405885820114042883/412115277883506700/unknown.png
// se puede cambiar la estrategia desde este menu desplegable para señales buy/sell

// Options
estrategia = input(defval="rsi", title = "Strategy", options=["ema","rsi","macd","psr","off","BB","ema5"])
in_bkcolor = input(defval="rsi", title = "background color", options=["ema","rsi","macd","psr","off","exchange","BB","ema5"])
e5 = input(title="Show ema5?", type=bool, defval=false)
e9 = input(title="Show ema9?", type=bool, defval=true)
e21 = input(title="Show ema21?", type=bool, defval=true)
e50 = input(title="Show ema50?", type=bool, defval=false)
e100 = input(title="Show ema100?", type=bool, defval=false)
e200 = input(title="Show ema200", type=bool, defval=true)
in_rsi = input(title="Color oversold and overbought bars?", type=bool, defval=true)
in_sar = input(title="Show Parabolic Sar", type=bool, defval=true)
in_bb = input(title="Show Bollinger Bands?", type=bool, defval=true)
sd = input(false, title="Show Daily Pivots?")
linew = input(1, title="linewidth", minval=0)
sarw = input(1, title="sar points width", minval=0)
ovs = input(40, title="oversold rsi", minval=0)
ovb = input(65, title="overbought rsi", minval=0)


//pf = input(false,title="Show Filtered Pivots")
pf=false

// 3 ema
src = close // input(close, title="Source")
//len9 = input(9, minval=1, title="ema9 Length")
//len21 = input(21, minval=1, title="ema21 Length")
//len200 = input(200, minval=1, title="ema200 Length")
len5=5
len9=9
len21=21
len50=50
len100=100
len200=200
ema5 = ema(src, len5)
ema9 = ema(src, len9)
ema21 = ema(src, len21)
ema50= ema(src, len50)
ema100 = ema(src, len100)
ema200 = ema(src, len200)
plot(e5? ema5 : na, title="EMA5", linewidth=linew, color=purple)
plot(e9? ema9 : na, title="EMA9", linewidth=linew, color=blue)
plot(e21? ema21 : na, title="EMA21", linewidth=linew, color=red)
plot(e50? ema50 : na, title="EMA50", linewidth=linew, color=green)
plot(e100? ema100 : na, title="EMA100", linewidth=linew, color=lime)
plot(e200? ema200 : na, title="EMA200", linewidth=linew, color=yellow)

// RSI Color
//lenR = input(14, minval=1, title="RSI Length")
lenR=14
//up = rma(max(change(src), 0), lenR)
//down = rma(-min(change(src), 0), lenR)
//vrsi = down == 0 ? 100 : up == 0 ? 0 : 100 - (100 / (1 + up / down))
vrsi=rsi(close,lenR)
//plot(vrsi,title="vrsi")
oversold = vrsi < ovs
overbought = vrsi > ovb
barcolor(in_rsi? oversold? #0000FF : overbought? #ff00ff:na : na)

// SAR
plot(in_sar? sar(0.02, 0.02, 0.2): na, style=cross, linewidth=sarw, color=blue, title="sar")

// BB
//length = input(20, title="Bollinger length", minval=1)
length=20
//mult = input(2.0, title="Bollinger stdDev", minval=0.001, maxval=50)
mult=2.0
basis = sma(src, length)
dev = mult * stdev(src, length)
upper = basis + dev
lower = basis - dev
plot(in_bb? basis :na, color=red, linewidth=linew, title="BB basis")
p1 = plot(in_bb? upper :na, color=blue, linewidth=linew, title="BB upper")
p2 = plot(in_bb? lower :na, color=blue, linewidth=linew, title="BB lower")
fill(p1, p2)

//background
bgcolor(in_bkcolor=="exchange"? #0000FF40 : in_bkcolor=="rsi"? vrsi < (ovs-15) ? #0000FF50  : vrsi < ovs ? #0000FF30 :( vrsi < ovb ? #ff00ff10 : #ff00ff20): in_bkcolor=="ema"?(ema9>ema21?#ff00ff10  : #0000FF20):in_bkcolor=="BB"?(lower>close?#ff00ff10 : close>upper?#0000FF20:#ff00ff10): in_bkcolor=="ema5"?(ema5>ema21?#ff00ff10  : #0000FF20):na)


// Strategy
if estrategia == "ema"
    strategy.entry("buy", true, 1, when= crossover(ema9,ema21) ),
    strategy.entry("sell", false, 1, when = crossover(ema21,ema9))
else
    if estrategia =="rsi"
        strategy.entry("buy", true, 1, when= vrsi <ovs),
        strategy.entry("sell", false, 1, when = vrsi > ovb or crossover(close,upper))
    else
        if estrategia =="macd"
            [macdLine, signalLine, histLine] = macd(close, 12, 26, 9),
            //bgcolor(macdLine > signalLine ? #98c8ff : #ff8b94),
            strategy.entry("buy", true, 1, when= macdLine>=signalLine ),
            strategy.entry("sell", false, 1, when = macdLine<signalLine)
        else
            if estrategia=="psr"
                leftBars = 4 //input(4)
                rightBars = 2 //input(2)
                swh = pivothigh(leftBars, rightBars)
                swl = pivotlow(leftBars, rightBars)
                swh_cond = not na(swh)
                hprice = 0.0
                hprice := swh_cond ? swh : hprice[1]
                le = false
                le := swh_cond ? true : (le[1] and high > hprice ? false : le[1])
                if (le)
                    strategy.entry("buy", strategy.long, comment="buy", stop=hprice + syminfo.mintick)
                swl_cond = not na(swl)
                lprice = 0.0
                lprice := swl_cond ? swl : lprice[1]
                se = false
                se := swl_cond ? true : (se[1] and low < lprice ? false : se[1])
                if (se)
                    strategy.entry("sell", strategy.short, comment="sell", stop=lprice - syminfo.mintick)
            else
                if estrategia=="BB"
                    strategy.entry("buy", true, 1, when= crossover(lower,close) ),
                    strategy.entry("sell", false, 1, when = crossover(close,upper))
                else
                    if estrategia=="ema5"
                        strategy.entry("buy", true, 1, when= crossover(ema5,ema21) ),
                        strategy.entry("sell", false, 1, when = crossover(ema21,ema5))


// pivots

// Classic Pivot
pivot = (high + low + close ) / 3.0
// Filter Cr
bull= pivot > (pivot + pivot[1]) / 2 + .0025
bear= pivot < (pivot + pivot[1]) / 2 - .0025
// Classic Pivots
r1 = pf and bear ? pivot + (pivot - low) : pf and bull ? pivot + (high - low) : pivot + (pivot - low)
s1 = pf and bull ? pivot - (high - pivot) : pf and bear ? pivot - (high - low) : pivot - (high - pivot)
r2 = pf ? na : pivot + (high - low)
s2 = pf ? na : pivot - (high - low)
//Pivot Average Calculation
smaP = sma(pivot, 3)
//Daily Pivots
dtime_pivot = request.security(syminfo.tickerid, 'D', pivot[1])
dtime_pivotAvg = request.security(syminfo.tickerid, 'D', smaP[1])
dtime_r1 = request.security(syminfo.tickerid, 'D', r1[1])
dtime_s1 = request.security(syminfo.tickerid, 'D', s1[1])
dtime_r2 = request.security(syminfo.tickerid, 'D', r2[1])
dtime_s2 = request.security(syminfo.tickerid, 'D', s2[1])
offs_daily = 0
plot(sd and dtime_pivot ? dtime_pivot : na, title="Daily Pivot",style=line, color=fuchsia,linewidth=linew)
plot(sd and dtime_r1 ? dtime_r1 : na, title="Daily R1",style=line, color=#DC143C,linewidth=linew)
plot(sd and dtime_s1 ? dtime_s1 : na, title="Daily S1",style=line, color=lime,linewidth=linew)
plot(sd and dtime_r2 ? dtime_r2 : na, title="Daily R2",style=line, color=maroon,linewidth=linew)
plot(sd and dtime_s2 ? dtime_s2 : na, title="Daily S2",style=line, color=#228B22,linewidth=linew)


// References:
// get number of bars since last green bar
//plot(barssince(close >= open), linewidth=3, color=blue)
//bgcolor(close < open ? #ff8b94   : #98c8ff , transp=10)
//http://www.color-hex.com/
//   #98c8ff    light blue
//    #ff8b94   red   #b21c0e
//       #7d1d90    purple
//    #0029ff blue
//    #fffa86   yellow