Chiến lược định lượng lệnh đảo ngược ATR vùng động lượng
Ngày tạo:
2023-11-24 15:55:36
sửa đổi lần cuối:
2023-11-24 15:55:36
sao chép:
0
Số nhấp chuột:
757
1
tập trung vào
1760
Người theo dõi
Tổng quan
Ý tưởng chính của chiến lược này là kết hợp vùng năng lượng động và chỉ số ATR, làm nhiều khi có gai vàng, làm trống khi có gai chết. Đồng thời thiết lập giá dừng và giá dừng. Khi giá có tín hiệu đảo ngược, nó sẽ mở vị trí ngược lại, thực hiện chức năng đặt hàng đảo ngược.
Nguyên tắc
- Sử dụng EMA nhanh và EMA chậm để tính toán tín hiệu dư luận. EMA nhanh cao hơn EMA chậm là lạc quan, ngược lại là đi xuống.
- Trong trường hợp không có vị trí, nếu có một cái nĩa vàng, bạn sẽ làm nhiều hơn, và nếu có một cái nĩa chết, bạn sẽ làm trống.
- Khi đã mở vị trí, nếu có tín hiệu đảo ngược, vị trí hiện tại sẽ được xóa trước, sau đó mở một vị trí mới theo hướng ngược lại.
- Sử dụng chỉ số ATR để tính toán giá dừng và giá dừng. Giá dừng sẽ được điều chỉnh theo kênh ATR để đảm bảo rủi ro dừng là nhỏ.
- Khi giá đi vào vùng mua quá mức, giá dừng sẽ được điều chỉnh thành giá cao nhất hoặc thấp nhất của đường K cuối cùng để tránh bị đặt.
Ưu điểm
- Kết hợp với vùng năng lượng động và ATR, có thể mở vị trí theo xu hướng và có thể dừng lỗ theo thời gian.
- Có chức năng đặt hàng đảo ngược, có thể chuyển hướng nhanh chóng khi giá đảo ngược, tận dụng tối đa biến động hai chiều của giá để có được lợi nhuận cao hơn.
- ATR có khả năng kiểm soát hiệu quả rủi ro dừng lỗ và đạt được tỷ lệ chiến thắng cao.
- Trong khi đó, các nhà đầu tư khác cũng đang tìm cách giảm bớt giá trị của các sản phẩm.
Rủi ro và giải pháp
- Các lệnh đảo ngược có thể được giao dịch quá thường xuyên trong các tình huống xung đột, làm tăng chi phí giao dịch và tỷ lệ dừng lỗ.
- Giải pháp: Tăng thời gian giữ vị thế tối thiểu, giảm sự đảo ngược trong tình huống chấn động.
- Sự thay đổi giá trị ATR có thể làm cho phạm vi dừng lỗ quá lớn hoặc quá nhỏ.
- Giải pháp: Điều chỉnh khoảng cách dừng theo giá trị ATR trong thời gian thực.
- Thiết lập tham số không đúng có thể dẫn đến tần số giao dịch quá cao hoặc hiệu quả tín hiệu kém.
- Giải pháp: Lựa chọn hợp lý các tham số dựa trên các giống khác nhau.
Hướng tối ưu hóa
- Tối ưu hóa thiết lập tham số, tìm kiếm sự kết hợp tham số tốt nhất.
- Thêm bộ lọc cho các chỉ số kỹ thuật phụ trợ để cải thiện chất lượng tín hiệu.
- Thêm mô-đun quản lý tiền để đặt hàng được gắn với tổng tài sản của tài khoản.
- Thêm phân tích theo chu kỳ thời gian, sử dụng nhiều thông tin hơn để nâng cao hiệu quả chiến lược.
Tóm tắt
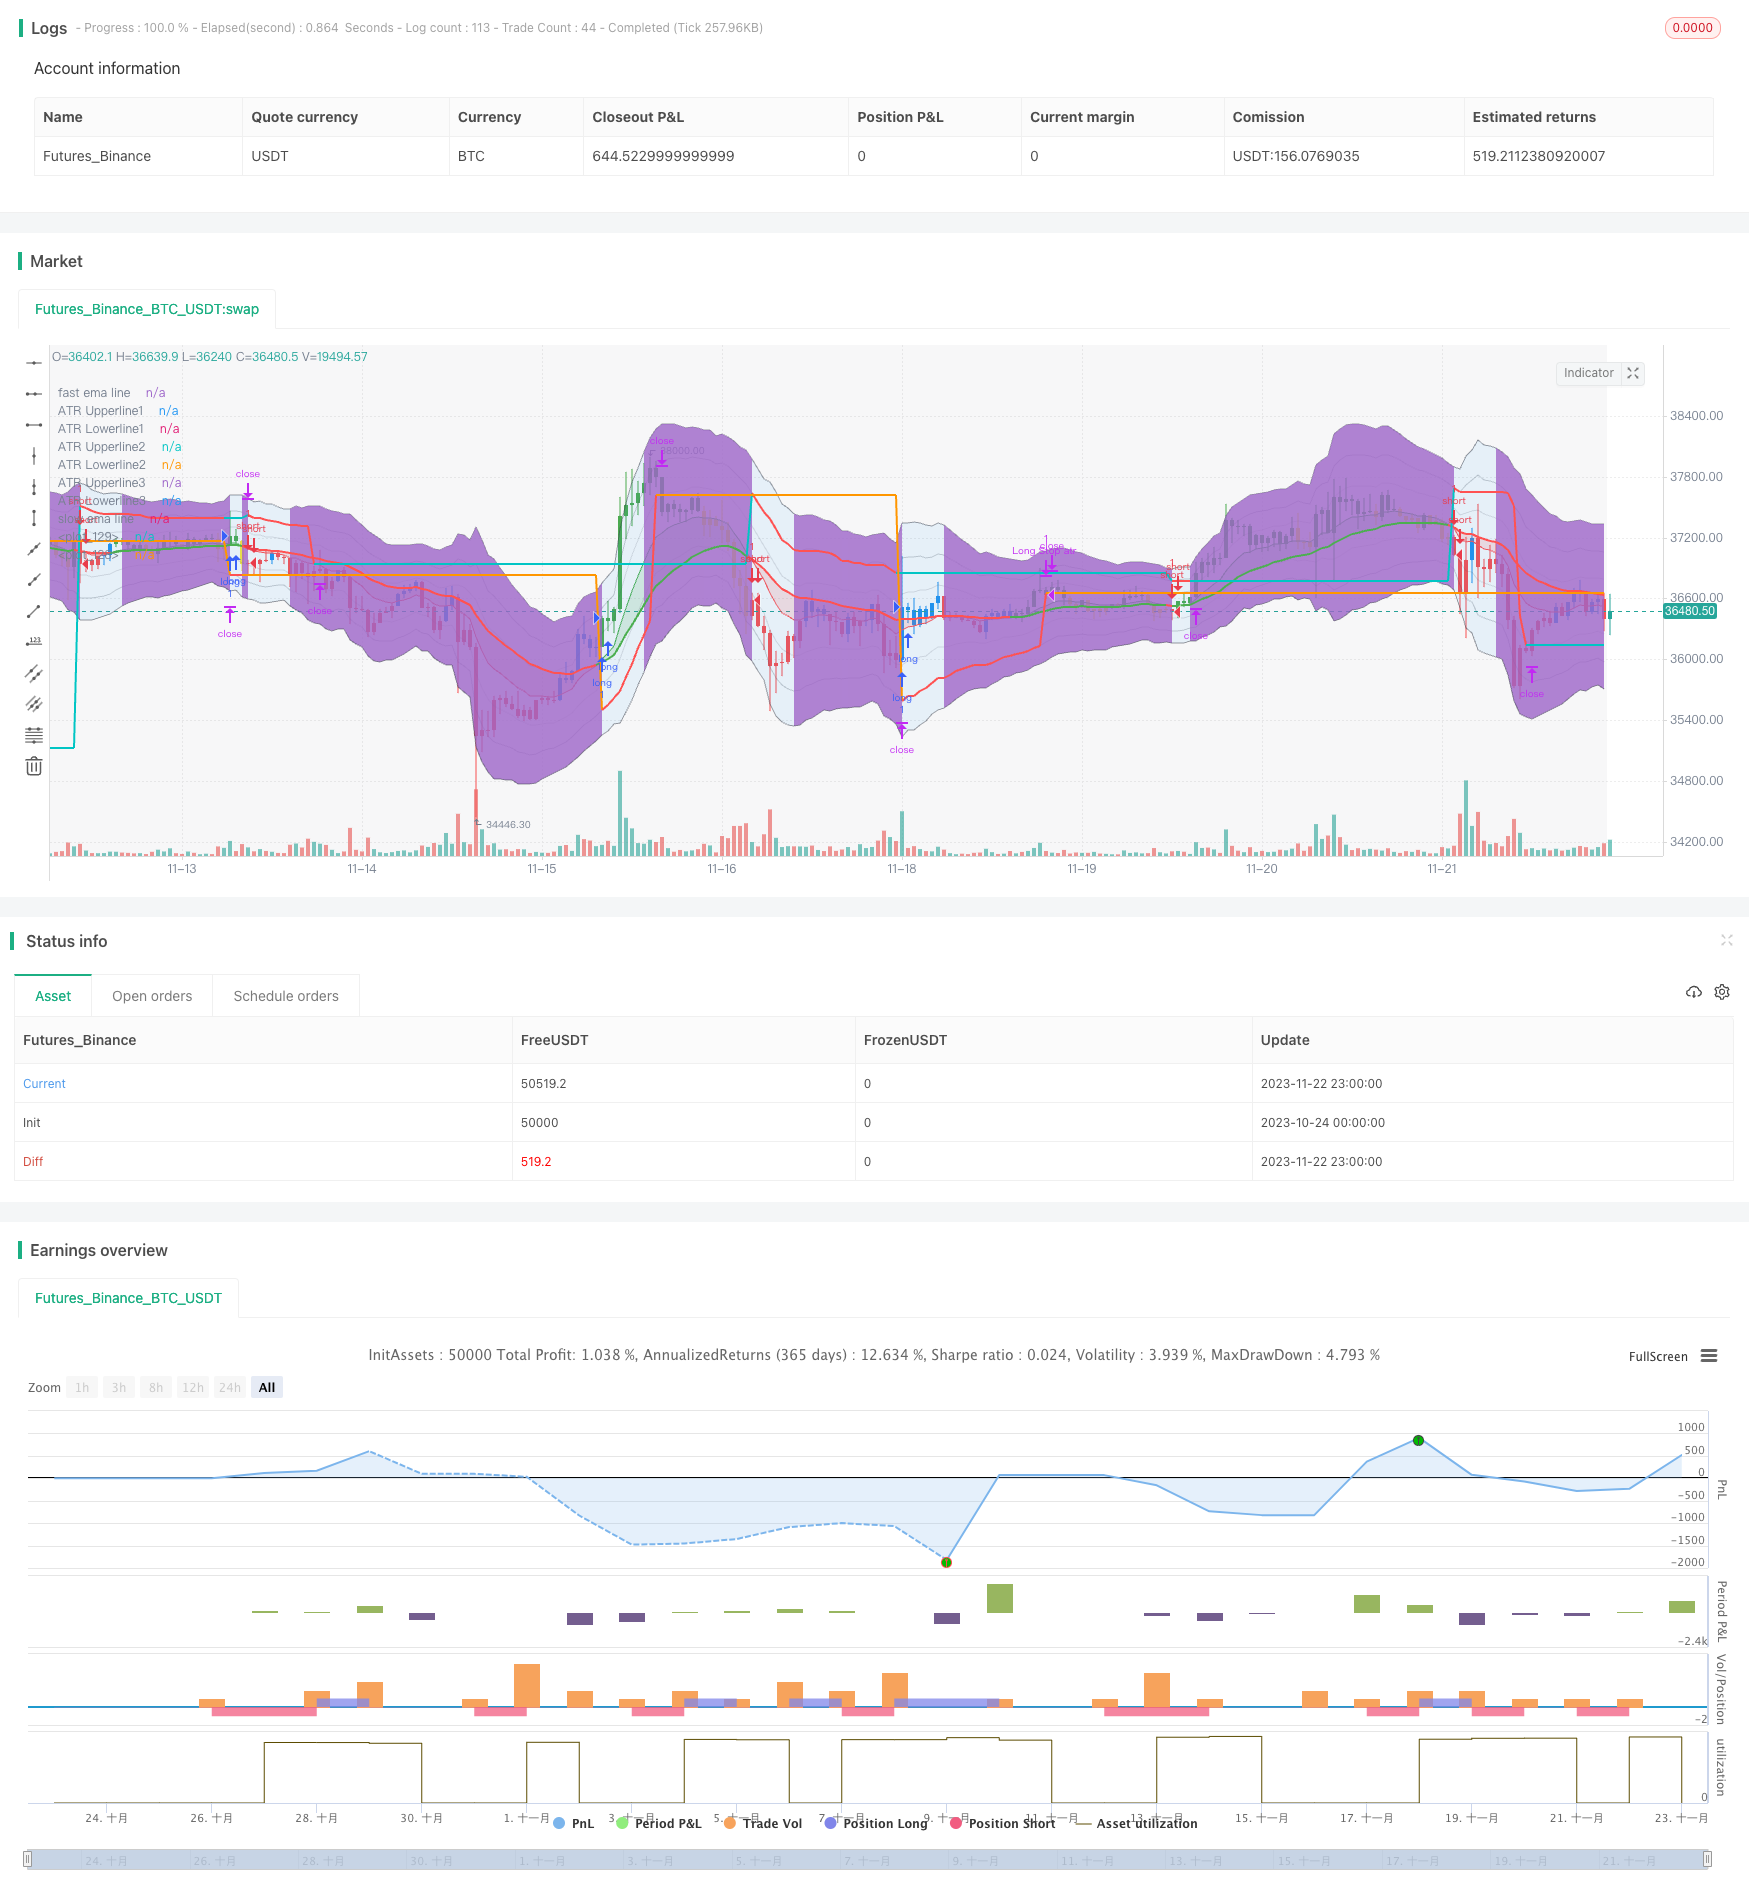
Chiến lược này tích hợp các lợi thế của các chỉ số năng lượng động và ATR, để thực hiện giao dịch hai chiều hiệu quả. Cơ chế đặt hàng đảo ngược và ATR dừng thông minh, có thể tận dụng tối đa biến động giá. Thiết lập tham số tối ưu hóa và kết hợp nhiều chỉ số hơn có thể làm tăng hiệu quả chiến lược hơn nữa. Chiến lược này phù hợp với giao dịch hai chiều tần số cao và cũng có thể được sử dụng như một công cụ quyết định hỗ trợ.
Mã nguồn chiến lược
/*backtest
start: 2023-10-24 00:00:00
end: 2023-11-23 00:00:00
period: 1h
basePeriod: 15m
exchanges: [{"eid":"Futures_Binance","currency":"BTC_USDT"}]
*/

// This source code is subject to the terms of the Mozilla Public License 2.0 at https://mozilla.org/MPL/2.0/
// © fenirlix

//@version=5
// Strategy parameter incl. position size, commission and initial capital
strategy("ACTIONZONE-ATR REVERSEORDER STRATEGY", "ACTIONZONEATR-REVERSEORDER", overlay=true
     )

// User Input Variable
fastMaInput     = input.int(12, "Fast MA Period", minval=2, step=1)
slowMaInput     = input.int(26, "Fast MA Period", minval=2, step=1)

atrLengthInput  = input.int(14, "ATR length", minval=2,step=1)
atrInnerMultInput = input.float(1, "atr inner multiplier", minval=0.1, step=0.1)
atrMidMultInput = input.float(2, "atr inner multiplier", minval=0.1, step=0.1) //***** MOST OF RISK MANAGEMENT LOGIC BASE ON THIS INPUT *****//
atrOuterMultInput = input.float(3, "atr inner multiplier", minval=0.1, step=0.1)

// Backtesting Date range
startYearInput      = input.int(2021, "Start Year", minval=1900, maxval=2100, step=1)
startMonthInput     = input.int(12, "Start Month", minval=1, maxval=12, step=1)
startDateInput      = input.int(1, "Start Day", minval=1, maxval=31, step=1)
setEndRangeInput    = input.bool(false, "Using Specific End Test Date") //Set specific End date or use present(end of candle) data
endYearInput        = input.int(2022, "End Year", minval=1900, maxval=2100, step=1)
endMonthInput       = input.int(1, "End Month", minval=1, maxval=12, step=1)
endDateInput        = input.int(31, "End Day", minval=1, maxval=31, step=1)

startDate = timestamp(syminfo.timezone, startYearInput, startMonthInput, startDateInput)
endDate = timestamp(syminfo.timezone, endYearInput, endMonthInput, endDateInput)
inDateRange = time >= startDate //Set backtest date range to present data
if setEndRangeInput
    inDateRange and time <= endDate //set backtest date range to specific date

// minimum position hold period (to get rid of false signal in sideway trend)
minHoldInput = input.int(8, 'Minimum position Hold Limit', minval=1, maxval=365, step=1) // Set Minimum Position Hold

var bool reverseToLong = false // Assign reverse order operator
var bool reverseToShort = false // Assign reverse order operator

// Indicator Declaration
fastEma = ta.ema(close, fastMaInput)
slowEma = ta.ema(close, slowMaInput)
atr = ta.atr(atrLengthInput)

// Declare trend of asset
isBullish = fastEma > slowEma
isBearish = fastEma <= slowEma

// Record position hold length, to limit minimum hold period(candle)
var int hold_length = 0
if strategy.opentrades > 0 or strategy.opentrades < 0
    hold_length := hold_length + 1
else
    hold_length := 0

// create permanent variable of stop price
var float longStopPrice = na
var float shortStopPrice = na

// Chart-Indicator COLOR declaration
REDBEAR     = color.new(color.red, 80)
GREENBULL   = color.new(color.green, 80)

greenLong = isBullish and close > fastEma
yellowLong = isBullish and close < fastEma
blueShort = isBearish and close > fastEma
redShort = isBearish and close < fastEma

// assign oversold, overbought condition(in this case, price over middle atr plus/minus fastEma)
overBand = high[1] > fastEma + (2*atr)
underBand = low[1] < fastEma - (2*atr)

// Strategy

// Main Entry Condition
goLong = isBullish and isBullish[1] == 0
goShort = isBearish and isBearish[1] == 0

inPosition = strategy.position_size != 0
minHoldPeriod = hold_length > minHoldInput ? true : false

// Entry Condition
if not inPosition and inDateRange and barstate.isconfirmed == true //compute after close of the bar to avoid repainting
    if goLong or reverseToLong // Long if longcondition or reverse order receive.
        strategy.entry('long', strategy.long)
        longStopPrice := fastEma - (atr * 2) // Set stop loss price
        reverseToLong := false // Reset reverse order status

    else if goShort or reverseToShort
        strategy.entry('short', strategy.short)
        shortStopPrice := fastEma + (atr * 2)
        reverseToShort := false
// Take profit and Set Higher Stop
if inPosition and minHoldPeriod and barstate.isconfirmed == true // check if we're in position and pass minimum hold period, confirm no repainting
    if strategy.position_size > 0
        // if exit position by Sellcondition(which is the same as ShortCondition), Exit Long position and make Short order(by set reverse order to true)
        strategy.close('long', when=goShort, comment='exitLong(' + str.tostring(hold_length) + ')')
        reverseToShort := true
        if overBand //If overbought condition met, set Stop price to LAST LOW, and not reverse any position
            longStopPrice := low[1]
            reverseToShort := false
    else if strategy.position_size < 0
        strategy.close('short', when=goLong, comment='exitShort(' + str.tostring(hold_length) + ')')
        reverseToLong := true
        if underBand
            shortStopPrice := high[1]
            reverseToLong := false
// Stop Loss and Set calculate stop loss using Atr Channel
if inPosition
    if strategy.position_size > 0
        if fastEma - (atr * atrMidMultInput) > longStopPrice // set long stop price to the higher of latest long stop price and ATR lower channel
            longStopPrice := fastEma - (atr * atrMidMultInput)
        strategy.exit('Long Stop atr ', 'long', stop=longStopPrice)
    else if strategy.position_size < 0
        if fastEma + (atr * atrMidMultInput) < shortStopPrice
            shortStopPrice := fastEma + (atr * atrMidMultInput)
        strategy.exit('Short Stop atr ', 'short', stop=shortStopPrice)

// Plotting
fastLine = plot(fastEma, title='fast ema line', linewidth=1, color=isBullish ? color.green : color.red)
slowLine = plot(slowEma, title='slow ema line', linewidth=2, color= isBullish? color.green : color.red)
atrUpperLine1 = plot(fastEma + (atr * atrInnerMultInput), title='ATR Upperline1', color=color.new(color.black,85))
atrLowerLine1 = plot(fastEma - (atr * atrInnerMultInput), title='ATR Lowerline1', color=color.new(color.black,85))
atrUpperLine2 = plot(fastEma + (atr * atrMidMultInput), title='ATR Upperline2', color=color.new(color.black,75))
atrLowerLine2 = plot(fastEma - (atr * atrMidMultInput), title='ATR Lowerline2', color=color.new(color.black,75))
atrUpperLine3 = plot(fastEma + (atr * atrOuterMultInput), title='ATR Upperline3', color=color.new(color.black,50))
atrLowerLine3 = plot(fastEma - (atr * atrOuterMultInput), title='ATR Lowerline3', color=color.new(color.black,50))

plot(longStopPrice, color=strategy.position_size > 0 ? color.red : na, linewidth=2)
plot(shortStopPrice, color=strategy.position_size < 0 ? color.red : na, linewidth=2)

//  Filling
fill(fastLine, slowLine, color=isBullish ? GREENBULL : REDBEAR)
fill(atrUpperLine3, atrLowerLine3, color=inPosition and (minHoldInput - hold_length > 0) ? color.new(color.blue,90): na)

barColor = switch
    greenLong => color.green
    yellowLong =>  color.yellow
    blueShort => color.blue
    redShort => color.red
    => color.black
barcolor(color=barColor)

// Fill background to distinguish inactive time(Zulu time)
nightTime = time(timeframe.period, "1500-0100") ? color.new(color.black, 95): na
bgcolor(nightTime)