Chiến lược giao cắt đường trung bình động kép

Tổng quan
Chiến lược này dựa trên một chiến lược theo dõi xu hướng của các đường nét đôi. Nó kết hợp các đường trung bình di chuyển đơn giản nhanh (SMA) và đường trung bình di chuyển trọng lượng chậm (VWMA) để tạo ra tín hiệu mua và bán bằng cách sử dụng các đường nét chéo của hai đường trung bình.
Khi SMA nhanh đi lên vượt qua VWMA chậm, nó tạo ra tín hiệu mua; khi SMA nhanh đi xuống vượt qua VWMA chậm, nó tạo ra tín hiệu bán.
Nguyên tắc chiến lược
Lập luận cốt lõi của chiến lược này dựa trên hệ thống giao chéo kép đồng tuyến. Cụ thể, nó đồng thời sử dụng các chỉ số kỹ thuật sau:
- Trung bình di chuyển đơn giản (SMA): lấy trung bình toán học của giá đóng cửa trong n ngày gần nhất, phản ánh giá trung bình trong khoảng thời gian gần nhất.
- Đường trung bình di chuyển trọng lượng ((VWMA): Đường trung bình trọng lượng cho giá đóng cửa trong n ngày gần nhất, cho giá gần đây trọng lượng lớn hơn và có thể phản ứng nhanh hơn với biến động giá.
Các tham số SMA nhanh trong đường trung bình kép được thiết lập ngắn hơn, có thể phản ứng nhanh với sự thay đổi giá; tham số VWMA chậm là dài hơn, có tác dụng sóng. Khi xu hướng ngắn hạn và dài hạn tiến về cùng một hướng, SMA nhanh đi lên vượt qua VWMA chậm tạo ra tín hiệu mua; đi xuống vượt qua tạo ra tín hiệu bán.
Chiến lược này đồng thời thiết lập cơ chế dừng lỗ. Khi giá chạy theo hướng bất lợi, dừng lỗ kịp thời để kiểm soát rủi ro.
Phân tích lợi thế
- Phản ứng nhanh chóng, theo dõi xu hướng thị trường thay đổi
- Quá trình rút tiền được kiểm soát tốt, cơ chế dừng lỗ có thể kiểm soát rủi ro hiệu quả
- Dễ hiểu và dễ hiểu
- Có thể được tối ưu hóa để thích ứng với các môi trường thị trường khác nhau bằng cách điều chỉnh các tham số
Phân tích rủi ro
- Chiến lược hai đường trung bình dễ tạo ra tín hiệu sai của thị trường đa đầu
- Cần chọn các tham số phù hợp, thiết lập không đúng có thể gây thiệt hại
- Thỉnh thoảng có thể bị đau đầu do sự cố đột ngột ở Markt gây ra thiệt hại
Phương pháp kiểm soát rủi ro:
- Sử dụng các chỉ số lọc xu hướng để xác nhận
- Cài đặt tham số tối ưu hóa
- Sử dụng chiến lược ngăn chặn tổn thất và kiểm soát tổn thất đơn lẻ một cách hợp lý
Hướng tối ưu hóa
Chiến lược này có thể được tối ưu hóa theo các khía cạnh sau:
- Xác nhận kết hợp với các chỉ số kỹ thuật khác, chẳng hạn như RSI, đường Brinh, để tăng độ chính xác của tín hiệu
- Tối ưu hóa chiều dài của tham số đường trung bình, điều chỉnh tham số theo chu kỳ khác nhau
- Kết hợp với chỉ số khối lượng giao dịch, giao dịch tại các điểm có lượng năng lượng lớn
- Điều chỉnh tham số dựa trên kết quả kiểm tra lại, chọn tham số tối ưu
- Sử dụng dừng động để điều chỉnh điểm dừng tùy theo mức độ biến động của thị trường
Tóm tắt
Chiến lược này nói chung là một chiến lược theo dõi xu hướng rất thực tế. Nó sử dụng giao dịch đơn giản, trực quan, hai đường trung bình để tạo ra tín hiệu giao dịch, có thể nắm bắt hiệu quả sự thay đổi của xu hướng thị trường thông qua sự kết hợp của đường trung bình nhanh và đường trung bình chậm.
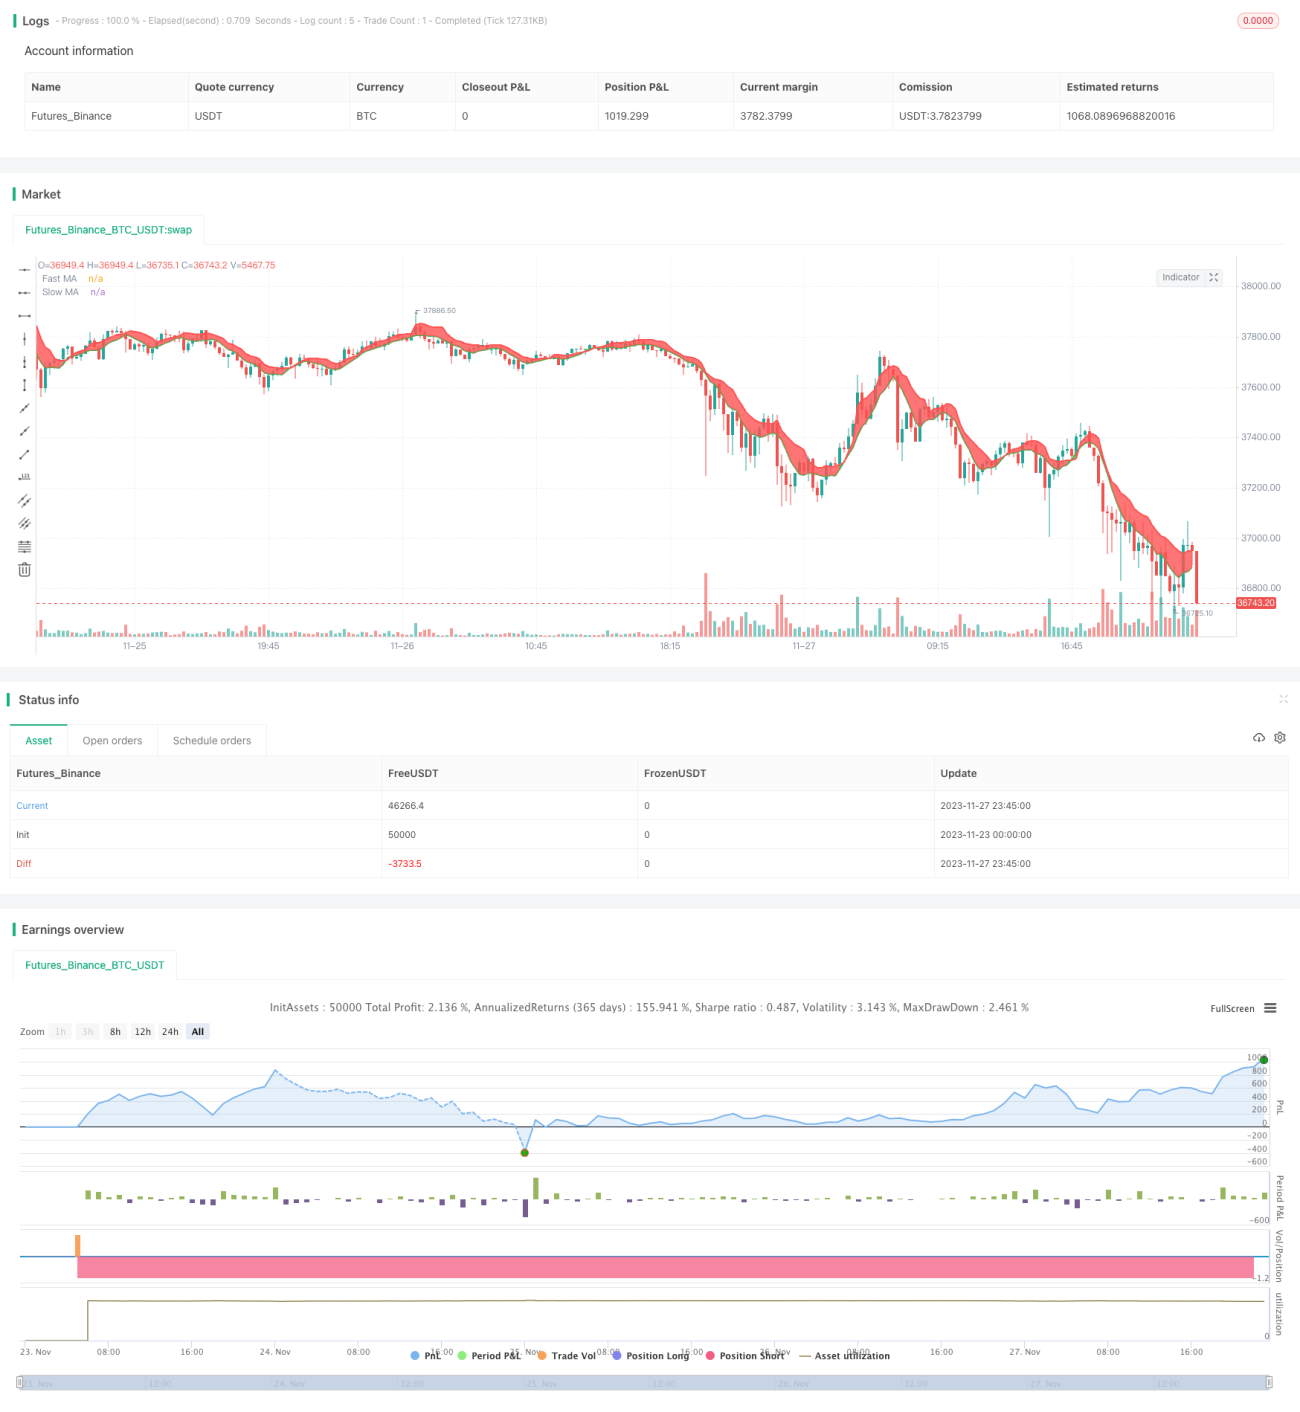
/*backtest
start: 2023-11-23 00:00:00
end: 2023-11-28 00:00:00
period: 15m
basePeriod: 5m
exchanges: [{"eid":"Futures_Binance","currency":"BTC_USDT"}]
*/

//@version=4
//strategy(title="Bitlinc Entry v0.1 VWMA / SMA / MRSI SQQQ 94M", overlay=true, initial_capital=10000, currency='USD')

strategy(title="Bitlinc Entry v0.1 VWMA / SMA / MRSI SQQQ 94M", overlay=true)- 1