Chiến lược theo xu hướng dựa trên Ichimoku Kinko Hyo

Tổng quan
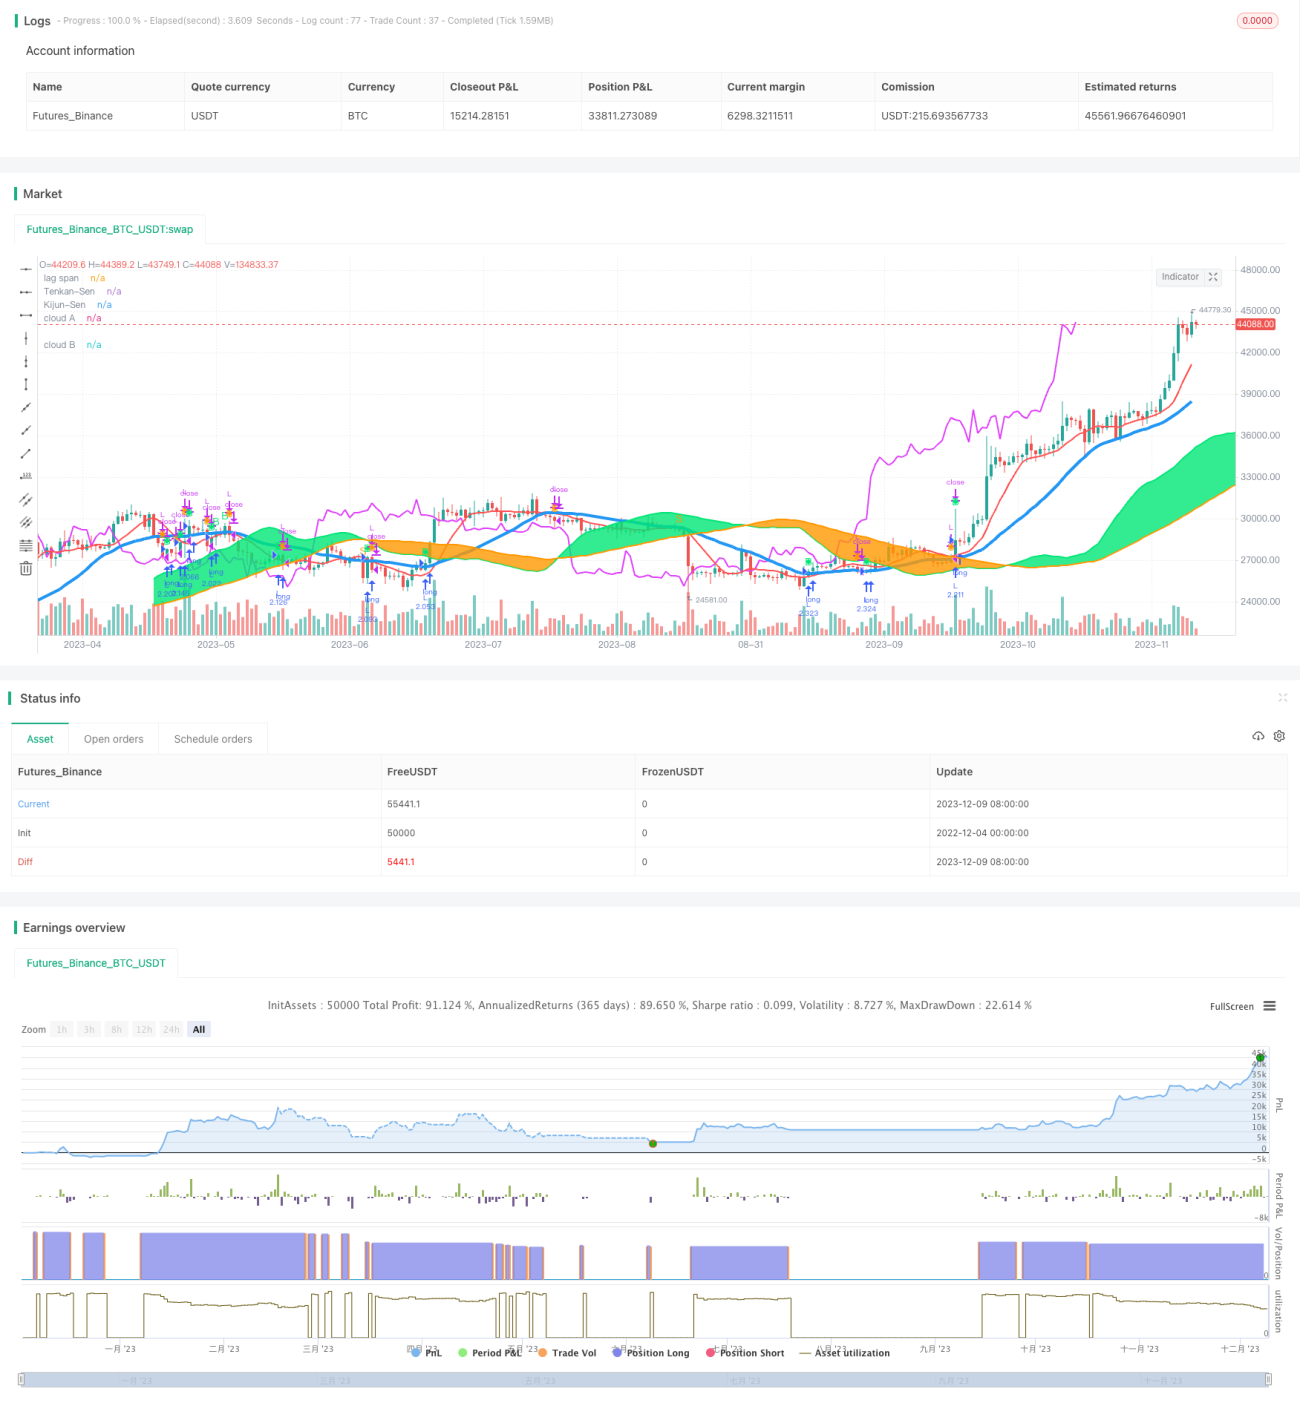
Chiến lược này được thiết kế dựa trên chỉ số kỹ thuật Ichimoku, sử dụng phương thức giao dịch theo xu hướng và phá vỡ cân bằng, nhằm nắm bắt xu hướng giá trung bình và dài, để tạo ra lợi nhuận ổn định.
Nguyên tắc chiến lược
Chiến lược sử dụng năm đường của bảng cân bằng ban đầu - đường chuyển hướng, đường chuẩn, đường đi trước, đường dẫn đầu và đường trì hoãn để đánh giá xu hướng giá và kháng cự hỗ trợ. Các quy tắc đánh giá cụ thể như sau:
- Một tín hiệu mua được tạo ra khi giá đóng cửa vượt qua đường chuẩn và đường chuẩn không bình thường.
- Một tín hiệu bán ra được tạo ra khi giá đóng cửa vượt qua đường chuẩn và đường chuẩn không bình thường.
- Khi giá đóng cửa cao hơn giá tròn, tính thanh khoản tốt hơn, cho phép xây dựng kho.
- Khi giá đóng cửa thấp hơn mức trung bình, tính thanh khoản kém hơn, nên không được xây dựng kho.
- Đường trượt giá đóng cửa tạo ra tín hiệu mua.
- Đường trì hoãn dưới đường dẫn đến tín hiệu bán.
Sau khi đánh giá tổng hợp các tín hiệu giao dịch trên, thời gian nhập cảnh cuối cùng sẽ được quyết định.
Phân tích lợi thế
Chiến lược này có những ưu điểm sau:
- Sử dụng bảng cân bằng trực quan để đánh giá xu hướng, có thể lọc tiếng ồn thị trường, khóa xu hướng đường dài và đường trung.
- Kết hợp với việc đánh giá tình trạng thanh khoản, bạn có thể tránh rủi ro đặt hàng.
- Dây trì hoãn là tín hiệu xác nhận, tránh phá vỡ giả.
- Các quy tắc đơn giản, rõ ràng và dễ thực hiện.
Phân tích rủi ro
Chiến lược này cũng có những rủi ro sau:
- Thiết lập tham số không đúng có thể dẫn đến cơ hội giao dịch bị bỏ lỡ.
- Trong khi đó, các nhà phân tích cho rằng xu hướng này có thể bị trì hoãn và không thể dừng lại kịp thời.
- Nhiều người nắm giữ các vị trí có nguy cơ mất mát lớn hơn.
Đối với các rủi ro trên, có thể giải quyết bằng cách thiết lập các tham số tối ưu hóa, kết hợp với các chỉ số khác để đánh giá sự thay đổi xu hướng, dừng nghiêm ngặt.
Hướng tối ưu hóa
Các chiến lược có thể được tối ưu hóa bằng cách:
- Tối ưu hóa các tham số của bảng cân bằng ban đầu, tìm kiếm sự kết hợp tốt nhất.
- Tăng bộ lọc chỉ số giá cả để tránh sai hướng.
- Kết hợp các chỉ số biến động để đánh giá điểm đảo ngược.
- Tham gia mô hình học máy để đánh giá xu hướng.
Tóm tắt
Chiến lược này sử dụng bảng cân bằng để đánh giá xu hướng giá và tình trạng lưu động, sử dụng mô hình theo dõi xu hướng, có thể lọc hiệu quả tiếng ồn để nắm bắt xu hướng đường dài trung bình, rủi ro rút lui nhỏ hơn, phù hợp với vị trí đường dài trung bình. Bằng cách tối ưu hóa thêm các tham số thiết lập, thêm các chỉ số lọc hỗ trợ, khai thác tín hiệu biến đổi xu hướng, có thể nâng cao chiến lược Factor lợi nhuận.
/*backtest
start: 2022-12-04 00:00:00
end: 2023-12-10 00:00:00
period: 1d
basePeriod: 1h
exchanges: [{"eid":"Futures_Binance","currency":"BTC_USDT"}]
*/

//@version=3
strategy("My Ichimoku Strat", overlay=true,default_qty_type=strategy.percent_of_equity, default_qty_value=100, initial_capital=1000, currency=currency.EUR)
// === BACKTEST RANGE ===
FromMonth = input(defval = 1, title = "From Month", minval = 1)- 1