Chiến lược giao dịch Ichimoku Kinko Hyo

Tổng quan
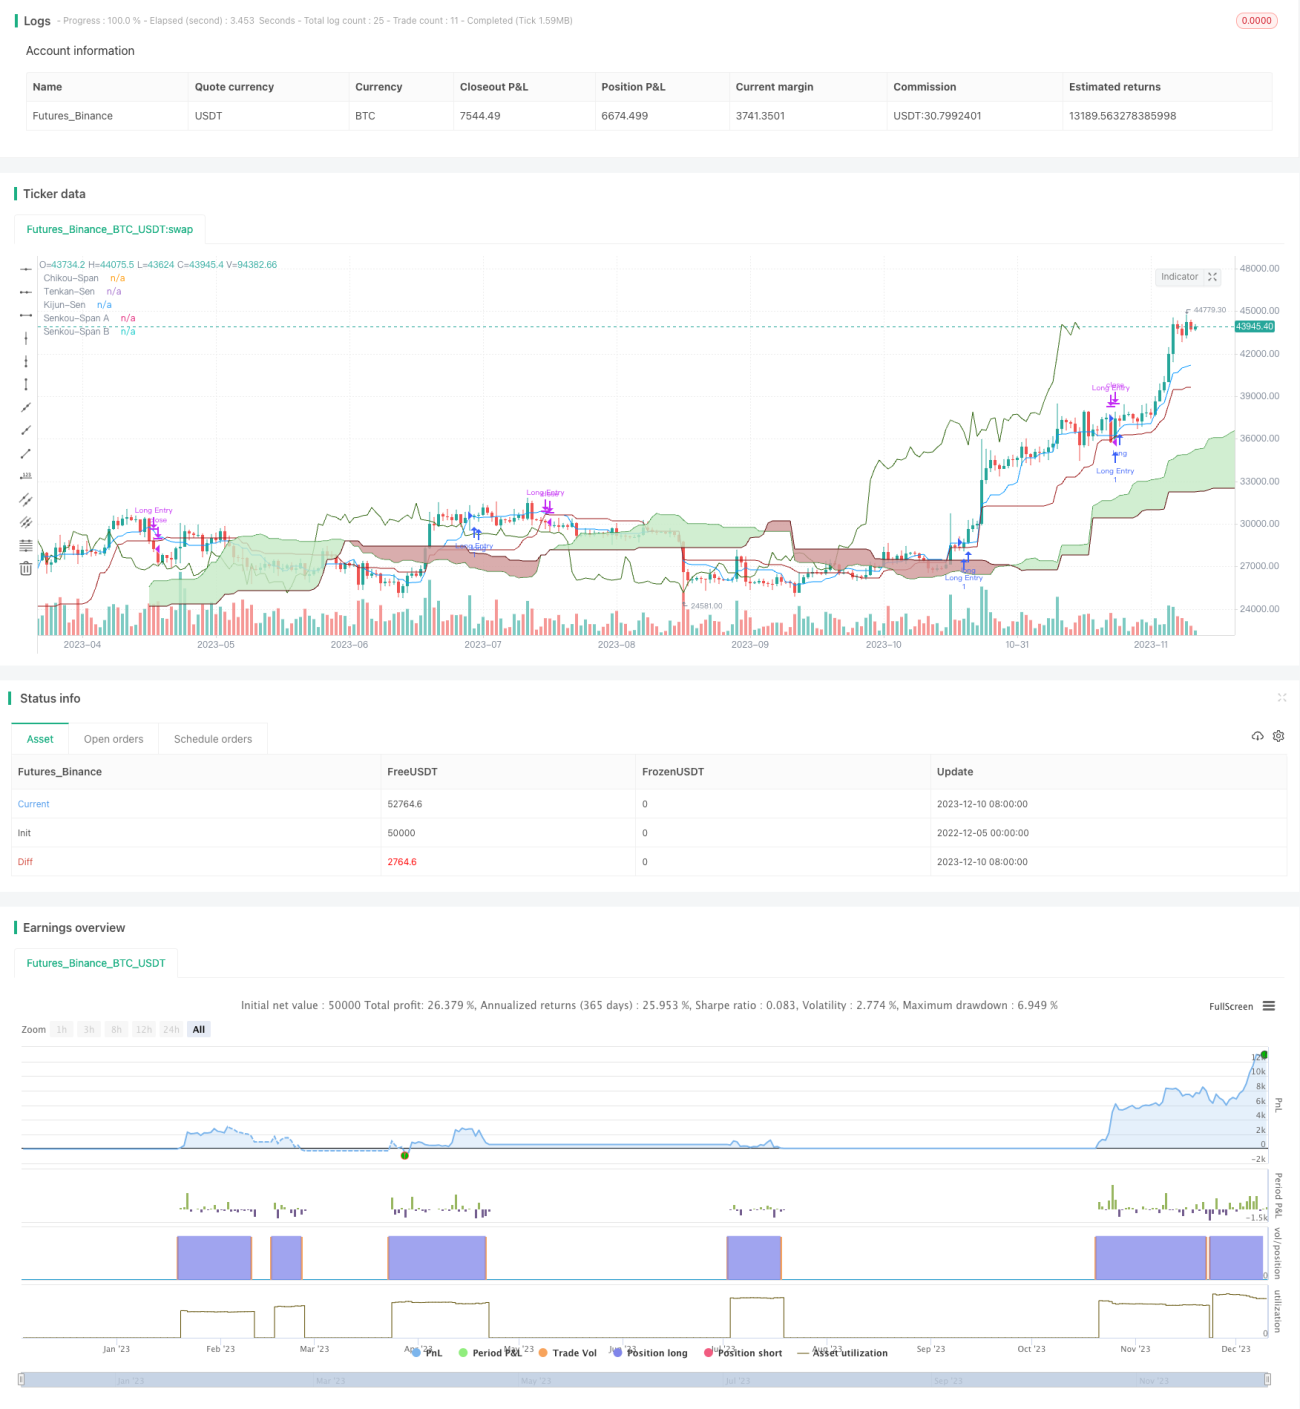
Đây là một chiến lược giao dịch chứng khoán chỉ có nhiều đầu dựa trên chỉ số Ichimoku Kinko Hyo. Chiến lược này sử dụng nguyên tắc cơ bản của sự cân bằng thoáng qua để đánh giá thời gian ra thị trường.
Nguyên tắc chiến lược
Chiến lược này đầu tiên tính toán các thành phần cân bằng ban đầu, bao gồm đường antenna ((Tenkan-Sen), đường chuẩn ((Kijun-Sen), đường dẫn ((Senkou Span A) và đường trì hoãn ((Senkou Span B)).
Thêm vào thị trường khi đáp ứng các điều kiện sau:
- Đường trung bình ngắn hạn trên đường trung bình dài hạn, thuộc tín hiệu Gold Forks
- Các nhà đầu tư đang tìm kiếm các giải pháp để tăng giá cổ phiếu của họ.
- Dưới đây là một biểu đồ màu đỏ cho thấy xu hướng tăng trưởng trong tương lai.
- Giá ở khoảng cách dưới 2 lần ATR so với đường kim loại, cho thấy giá không cao, phù hợp với chiến lược theo dõi kim loại
- Giá thấp hơn 3 lần ATR so với đường viền cơ sở, cho thấy giá không cao, phù hợp với chiến lược theo dõi
- Đường bầu trời và đường chuẩn đều nằm trên bản đồ đám mây, cho thấy xu hướng tăng cân bằng
Khi các điều kiện sau đây được đáp ứng, một lệnh hòa sẽ được thực hiện:
- Đường trung bình ngắn hạn đi qua đường trung bình dài hạn, thuộc tín hiệu dead fork
- Giá giảm so với biểu đồ mây, cho thấy giá cổ phiếu mất đi sự hỗ trợ
- Hoặc lợi nhuận vượt quá 30%, theo chiến lược ngăn chặn
- Hoặc thua lỗ hơn 3%, theo chiến lược dừng lỗ
Phân tích lợi thế
- Sử dụng chỉ số cân bằng trực quan để xác định xu hướng giá cổ phiếu, độ chính xác cao
- Kết hợp với ATR để kiểm soát đợt dừng chân và giảm giá, tránh mua quá mức
- Xác định nhiều tín hiệu và tránh các tín hiệu giả
- Chiến lược bổ sung có thể tăng lợi nhuận
Phân tích rủi ro
- Các tín hiệu cân bằng có thể bị chậm trễ và cần được kết hợp với các chỉ số khác
- Thiết lập tham số ATR sai có thể dẫn đến quá mua quá bán
- Chiến lược bồi thường có thể làm tăng rủi ro mất mát
- Cần xác định các tham số bằng tay, các tham số khác nhau cho các cổ phiếu khác nhau
Hướng tối ưu hóa
- Có thể kết hợp các chỉ số khác như MACD, KDJ để xác nhận tín hiệu
- Bạn có thể tăng điểm dừng và giảm điểm dừng.
- Các tham số ATR có thể được tự động tối ưu hóa dựa trên dữ liệu lịch sử
- Có thể nghiên cứu sự khác biệt của các tham số của các cổ phiếu trong các ngành khác nhau để xây dựng một hồ tham số
Tóm tắt
Đây là một chiến lược giao dịch chứng khoán rất thực tế, sử dụng xu hướng đánh giá cân bằng ngay lập tức, kiểm soát rủi ro ATR để theo đuổi phương pháp dừng giảm để kiếm lợi nhuận. Ưu điểm của chiến lược này rõ ràng, hiệu quả sẽ tốt hơn sau khi tối ưu hóa tham số và tối ưu hóa chỉ số tổ hợp, phù hợp với giao dịch trực tiếp.
- 1