Chiến lược đột phá đường trung bình động Triple Supertrend
Tổng quan
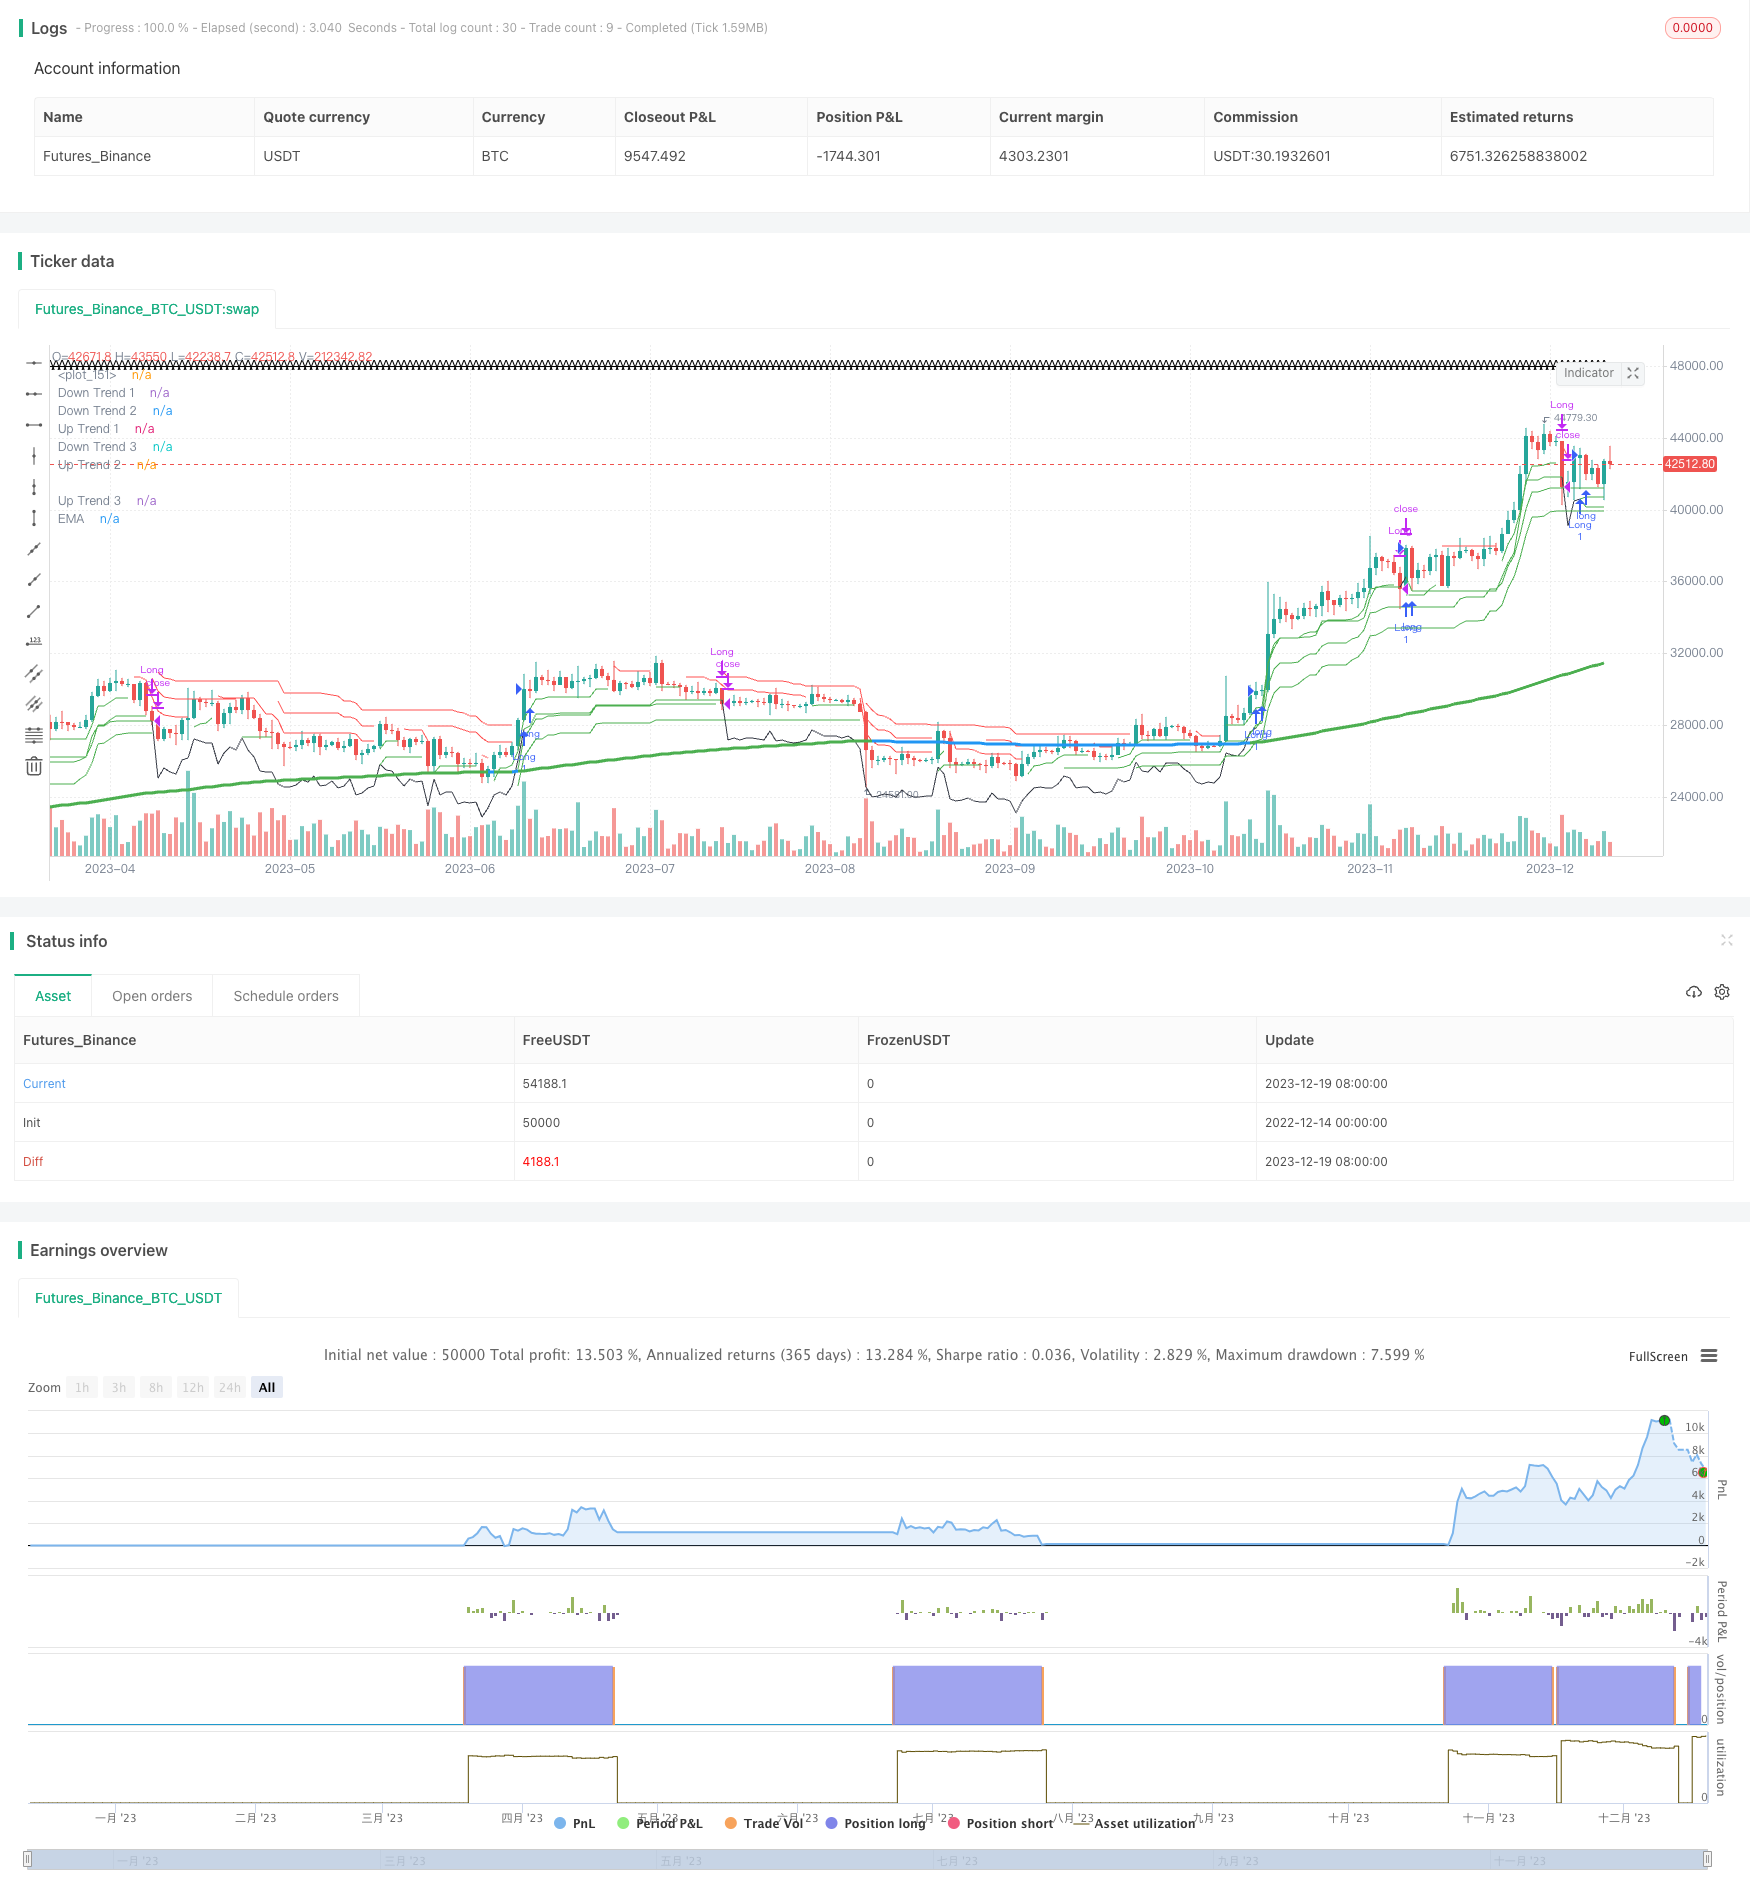
Chiến lược phá vỡ đường trung bình vượt quá xu hướng ba là một chiến lược phổ biến hơn sử dụng đường trung bình vượt quá xu hướng với nhiều tham số khác nhau và EMA của xu hướng để xác định hướng xu hướng và giao dịch. Ý tưởng chính của chiến lược này là xây dựng nhiều đầu khi có ít nhất hai đường trung bình vượt quá xu hướng ở trên đường EMA của xu hướng lớn và xây dựng nhiều đầu khi có ít nhất hai đường trung bình vượt quá xu hướng ở dưới đường EMA của xu hướng lớn.
Nguyên tắc chiến lược
Chiến lược này được sử dụng để xác định vị trí mua và bán bằng cách thiết lập một đường trung bình siêu xu hướng với ba tham số khác nhau và một EMA xác định hướng của xu hướng lớn:
Cài đặt ba đường trung bình siêu xu hướng supertrend1, supertrend2 và supertrend3, màu xanh lá cây cho xu hướng tăng và màu đỏ cho xu hướng giảm.
Thiết lập một đường trung bình di chuyển trơn EMA ematrend để xác định xu hướng lớn, khi ba đường trung bình siêu xu hướng đều cao hơn đường EMA này được xác định là đường giao dịch nhiều đầu của đường giao dịch lớn, ngược lại được xác định là đường giao dịch trống.
Khi có ít nhất hai đường trung bình siêu xu hướng hiển thị cùng một lúc ở vị trí đa đầu của đĩa lớn, nó sẽ được coi là tín hiệu đa đầu khi giá trị định hướng nhỏ hơn 0; khi có ít nhất hai đường trung bình siêu xu hướng hiển thị cùng một lúc ở vị trí trống của đĩa lớn, nó sẽ được coi là tín hiệu trống khi giá trị định hướng lớn hơn 0.
Tiếp theo, khi tín hiệu xuất hiện, hãy mở thêm / bỏ trống.
Thiết lập điều kiện dừng lỗ. Trong đó, dừng cố định được thiết lập là tỷ lệ lợi nhuận rủi ro, tức là tỷ lệ lỗ là 3; dừng di động được thiết lập là giảm một ATR.
Khi điều kiện dừng lỗ hoặc dừng lại được kích hoạt, vị thế sẽ bị xóa.
Phân tích lợi thế
Chiến lược này có những ưu điểm sau:
Sử dụng ba đường trung bình siêu xu hướng kết hợp với xu hướng để đánh giá EMA, có thể nhận ra hiệu quả tín hiệu xu hướng.
Các quy tắc phán đoán điều kiện đa không gian rõ ràng, dễ hiểu và thực hiện.
Thiết lập dừng di động và dừng cố định, kiểm soát rủi ro hiệu quả.
Có thể điều chỉnh các tham số siêu theo nhu cầu, tối ưu hóa chiến lược.
Phân tích rủi ro
Chiến lược này cũng có những rủi ro:
Thiết lập siêu tham số không đúng có thể dẫn đến việc bỏ lỡ cơ hội giao dịch tốt. Bạn có thể thử nghiệm các tham số khác nhau về chu kỳ ATR, nhân ATR, chu kỳ EMA.
Tỷ lệ thất bại trong đột phá có thể được giảm bằng cách điều chỉnh các tham số siêu.
Cài đặt dừng lỗ hoặc dừng lỗ quá thoải mái sẽ làm tăng khả năng thua lỗ. Khu vực dừng lỗ nên được thu hẹp thích hợp.
Dữ liệu phản hồi dễ gây ra vấn đề quá phù hợp. Cần chú ý đến thử nghiệm đa chu kỳ đa thị trường.
Hướng tối ưu hóa
Chiến lược này có thể được tối ưu hóa theo các khía cạnh sau:
Kiểm tra kết hợp siêu tham số tối ưu. Có thể kết hợp kiểm tra các chu kỳ khác nhau của ATR, nhân ATR, chu kỳ trung bình EMA để tìm tham số tối ưu.
Thêm các loại giao dịch. Bạn có thể thêm các loại khác nhau như cổ phiếu, tiền kỹ thuật số để xác minh hiệu quả của chiến lược.
Kết hợp với các chỉ số khác để lọc tín hiệu. Ví dụ, bạn có thể thêm các chỉ số như RSI, MACD để tránh đọc sai tín hiệu xu hướng.
Tối ưu hóa cơ chế dừng lỗ. Có thể thử nghiệm theo dõi dừng lỗ, hoặc dừng lỗ dựa trên thay đổi ATR / tỷ lệ dao động.
Tóm tắt
Chiến lược phá vỡ đường trung bình vượt quá xu hướng ba là một chiến lược theo dõi xu hướng đơn giản và thực tế. Nó kết hợp nhiều đường trung bình vượt quá xu hướng cùng với EMA đánh giá xu hướng để khám phá cơ hội và kiểm soát rủi ro hiệu quả. Bằng cách tối ưu hóa tham số và tối ưu hóa quy tắc, có thể đạt được hiệu quả tốt hơn. Chiến lược này dễ hiểu và đáng để học hỏi.
/*backtest
start: 2022-12-14 00:00:00
end: 2023-12-20 00:00:00
period: 1d
basePeriod: 1h
exchanges: [{"eid":"Futures_Binance","currency":"BTC_USDT"}]
*/

// @version=5
// author=theasgard and moonshot-indicator (ms)
// year 2021
//
// This is a well knowen strategy by using 3 different Supertrends and a trend-defining EMA,
// feel free to play around with the settings, a backtest on 8h ETHUSDT pair brought some good results using
// the 233EMA and investing 75% of a 10k start capital
//
// the idea is to have at least 2 supertrnds going green above the trend-EMA to go long and exit by turning
// 2 supertrends red (idea: 1 supertrend in red could initialize a take profit)
// shorts work vice versa
// The EMA shows in green for uptrends and in red for downtrends, if it is blue no Signal will be taken because
// the 3 supertrends are not all above or below the trendline(EMA)
//
// Update 1:
// Fixed a minor input error
// Added ATR stoploss, and commented out the percentage stop loss
// Added time window to backtest
// Added exit on risk/revard is met
// This version is only buy...wait for next update adding shorts

strategy("ms hypertrender", overlay=true)

// set up 3 supertrendlines and colour the direction up/down
atrPeriod1 = input(10, "ATR Length 1")
factor1 = input.float(1.0, "ATR Factor 1", step = 0.01)
[supertrend1, direction1] = ta.supertrend(factor1, atrPeriod1)
upTrend1 = plot(direction1 < 0 ? supertrend1 : na, "Up Trend 1", color = color.green, style=plot.style_linebr)
downTrend1 = plot(direction1 < 0? na : supertrend1, "Down Trend 1", color = color.red, style=plot.style_linebr)

atrPeriod2 = input(11, "ATR Length 2")
factor2 = input.float(2.0, "ATR Factor 2", step = 0.01)
[supertrend2, direction2] = ta.supertrend(factor2, atrPeriod2)
upTrend2 = plot(direction2 < 0 ? supertrend2 : na, "Up Trend 2", color = color.green, style=plot.style_linebr)
downTrend2 = plot(direction2 < 0? na : supertrend2, "Down Trend 2", color = color.red, style=plot.style_linebr)

atrPeriod3 = input(12, "ATR Length 3")
factor3 = input.float(3.0, "ATR Factor 3", step = 0.01)
[supertrend3, direction3] = ta.supertrend(factor3, atrPeriod3)
upTrend3 = plot(direction3 < 0 ? supertrend3 : na, "Up Trend 3", color = color.green, style=plot.style_linebr)
downTrend3 = plot(direction3 < 0? na : supertrend3, "Down Trend 3", color = color.red, style=plot.style_linebr)

//set up the trend dividing EMA and color uptrend nutreal downtrend
len = input.int(233, minval=1, title="Trend-EMA Length")
src = input(close, title="Source")
offset = input.int(title="Offset", defval=0, minval=-500, maxval=500)

//general Bull or Bear Trend? Visualized by ema
ematrend = ta.ema(src, len)
generaluptrend = supertrend1 > ematrend and supertrend2 > ematrend and supertrend3 > ematrend
generaldowntrend = supertrend1 < ematrend and supertrend2 < ematrend and supertrend3 < ematrend
emacolor = if generaluptrend
    color.green
else if generaldowntrend
    color.red
else
    color.blue
plot(ematrend, title="EMA", color=emacolor, linewidth=3, offset=offset)

// Bullish? min 2 supertrends green
bullish = (direction1 < 0 and direction2 < 0) or (direction1 < 0 and direction3 < 0) or (direction2 < 0 and direction3 < 0) and generaluptrend
extremebullish = direction1 < 0 and direction2 < 0 and direction3 < 0 and generaluptrend //all 3 green

// Bearish? min 2 supertrends red
bearish = (direction1 > 0 and direction2 > 0) or (direction1 > 0 and direction3 > 0) or (direction2 > 0 and direction3 > 0) and generaldowntrend
extremebearish = direction1 > 0 and direction2 > 0 and direction3 > 0 and generaldowntrend //all 3 red

// Open Long
//plotchar(((bullish and not bullish[1]) or (extremebullish and not extremebullish[1])) and (emacolor==color.green)? close : na, title = 'Start Long', char='▲', color = #80eb34, location = location.belowbar, size = size.small)

// TP 10% Long
TP10long = ((generaluptrend and bullish[1]) or (generaluptrend and extremebullish[1])) and (direction1 > 0 or direction2 > 0 or direction3 > 0)
//plotchar(TP10long and not TP10long[1]? close : na, title = 'TP on Long', char='┼', color = #ffd000, location = location.abovebar, size = size.tiny)

// Exit Long
//plotchar(extremebearish and not extremebearish[1] or bearish and not bearish[1]? close : na, title = 'Close all Longs', char='Ꭓ', color = #ff0037, location = location.abovebar, size = size.tiny)
stopsupertrendup = if supertrend1 < supertrend2 and supertrend1 < supertrend3
    (supertrend1)
else if supertrend2 < supertrend1 and supertrend2 < supertrend3
    (supertrend2)
else if supertrend3 < supertrend1 and supertrend3 < supertrend2
    (supertrend3)
lowestLows = ta.lowest(low, 1)
// Open Short
//plotchar(((bearish and not bearish[1]) or (extremebearish and not extremebearish[1])) and (emacolor==color.red)? close : na, title = 'Start Short', char='▼', color = #0547e3, location = location.abovebar, size = size.small)

// TP 10% Short
TP10short = ((generaldowntrend and bearish[1]) or (generaldowntrend and extremebearish[1])) and (direction1 < 0 or direction2 < 0 or direction3 < 0)
//plotchar(TP10short and not TP10short[1]? close : na, title = 'TP on Short', char='┼', color = #ffd000, location = location.belowbar, size = size.tiny)

// Exit Short
//plotchar(extremebullish and not extremebullish[1] or bullish and not bullish[1]? close : na, title = 'Close all Shorts', char='Ꭓ', color = #ff0037, location = location.belowbar, size = size.tiny)
stopsupertrenddown = if supertrend1 > supertrend2 and supertrend1 > supertrend3
    (supertrend1)
else if supertrend2 > supertrend1 and supertrend2 > supertrend3
    (supertrend2)
else if supertrend3 > supertrend1 and supertrend3 > supertrend2
    (supertrend3)
highestHighs = ta.highest(high,1)
// Set stop loss level with input options (optional)
//longLossPerc = input.float(title="Long Stop Loss (%)",
//     minval=0.0, step=0.1, defval=1) * 0.01

//shortLossPerc = input.float(title="Short Stop Loss (%)",
//     minval=0.0, step=0.1, defval=1) * 0.01

// Determine stop loss price
//longStopPrice  = strategy.position_avg_price * (1 - longLossPerc)
//shortStopPrice = strategy.position_avg_price * (1 + shortLossPerc)

openlong = (extremebullish and not extremebullish[1]) and (emacolor==color.green)//(((bullish and not bullish[1]) or
openshort = (extremebearish and not extremebearish[1]) and (emacolor==color.red)//(((bearish and not bearish[1]) or
exitlong = lowestLows<(stopsupertrendup - ((stopsupertrendup / 100) * 0.1)) //(extremebearish and not extremebearish[1] or bearish and not bearish[1]) or TP10long or
exitshort = highestHighs>(stopsupertrenddown - ((stopsupertrenddown / 100) * 0.1)) //(extremebullish and not extremebullish[1] or bullish and not bullish[1]) or TP10short
//strategy.entry("buy", strategy.long, when=openlong)
//strategy.entry("sell", strategy.short, when=openshort)

//strategy.close("buy", when=exitlong)
//strategy.close("sell", when=exitshort)

// Submit exit orders based on calculated stop loss price
//if (strategy.position_size > 0)
//    strategy.exit(id="Long Stop", stop=longStopPrice)

//if (strategy.position_size < 0)
//    strategy.exit(id="Short Stop", stop=shortStopPrice)

backtest_timeframe_start = input(defval = timestamp("01 Apr 2016 13:30 +0000"), title = "Backtest Start Time")
USE_ENDTIME = input(false,title="Define the ending period for backtests (If false, will test up to most recent candle)")
backtest_timeframe_end = input(defval = timestamp("19 Mar 2021 19:30 +0000"), title = "Backtest End Time")
TARGET_PROFIT_MODE = input(false,title="Exit when Risk:Reward met")
REWARD_RATIO = input(3,title="Risk:[Reward] (i.e. 3) for exit")
// Trailing stop loss {
TSL_ON = input(true,title="Use trailing stop loss")
var entry_price = float(0)
ATR_multi_len = 26
ATR_multi = input(2, "ATR multiplier for stop loss")
ATR_buffer = ta.atr(ATR_multi_len) * ATR_multi
plotchar(ATR_buffer, "ATR Buffer", "A", location = location.top)
risk_reward_buffer = (ta.atr(ATR_multi_len) * ATR_multi) * REWARD_RATIO
take_profit_long = low > entry_price + risk_reward_buffer
take_profit_short = low < entry_price - risk_reward_buffer
var trailing_SL_buffer = float(0)
var stop_loss_price = float(0)
stop_loss_price := math.max(stop_loss_price, close - trailing_SL_buffer)
// plot TSL line
trail_profit_line_color = color.green
if strategy.position_size == 0  or not TSL_ON
    trail_profit_line_color := color.black
    stop_loss_price := close - trailing_SL_buffer
plot(stop_loss_price,color=trail_profit_line_color)
// }

if true
    buy_condition = openlong
    exit_condition = exitlong
    //ENTRY:
    if buy_condition
        if strategy.position_size == 0
            entry_price := close
            trailing_SL_buffer := ATR_buffer
            stop_loss_price := close - ATR_buffer

        msg = "entry"
        if strategy.position_size > 0
            msg := "pyramiding"
        strategy.entry("Long",strategy.long, comment=msg)

    //EXIT:
    // Case (A) hits trailing stop
    if TSL_ON and strategy.position_size > 0 and close <= stop_loss_price
        if close > entry_price
            strategy.close("Long", comment="take profit [trailing]")
        else if close <= entry_price
            strategy.close("Long", comment="stop loss")
    // Case (B) take targeted profit relative to risk
    if strategy.position_size > 0 and TARGET_PROFIT_MODE
        if take_profit_long
            strategy.close("Long", comment="take profits [risk:reward]")
    // Case (C)
    if strategy.position_size > 0 and exit_condition
        if take_profit_long
            strategy.close("Long", comment="exit[rsi]")