Chiến lược giao dịch đa khung thời gian dựa trên chỉ báo biến động và chỉ báo ngẫu nhiên
Tổng quan
Chiến lược này kết hợp chỉ số biến động VIX và chỉ số ngẫu nhiên RSI, thông qua sự kết hợp của các chỉ số trong các chu kỳ thời gian khác nhau, để đạt được mức cân bằng lỗ hổng phá vỡ mua và mua quá mức bán quá mức. Chiến lược có nhiều không gian tối ưu hóa và có thể thích ứng với các môi trường thị trường khác nhau.
Nguyên tắc chiến lược
Tính toán chỉ số biến động VIX: lấy giá cao nhất và giá thấp nhất trong 20 ngày gần đây để tính toán biến động. Khi biến động cao hơn đường ray, nó biểu thị thị trường hoảng loạn; Khi thấp hơn đường ray, nó biểu thị thị trường hài lòng.
Tính toán RSI ngẫu nhiên: tính toán các biến động trong 14 ngày gần đây, khi RSI cao hơn 70 là vùng mua quá mức, khi RSI thấp hơn 30 là vùng bán quá mức.
Kết hợp hai chỉ số, làm nhiều hơn khi biến động cao hơn đường ray hoặc phần trăm cao nhất; Hàm bằng khi RSI cao hơn 70.
Lợi thế chiến lược
- Nó kết hợp nhiều chỉ số để đánh giá tổng hợp thời điểm thị trường.
- Các chỉ số khác nhau trong chu kỳ thời gian được xác nhận với nhau, giúp cải thiện tính chính xác của quyết định.
- Các tham số điều chỉnh có thể được tối ưu hóa cho các loại giao dịch khác nhau.
Phân tích rủi ro
- Thiết lập tham số không đúng có thể dẫn đến nhiều tín hiệu giả.
- Chỉ số đơn vị tháo lỏng dễ bị bỏ qua bởi sự đảo ngược giá.
Lời khuyên tối ưu hóa
- Thêm thêm các chỉ số xác minh, chẳng hạn như đường trung bình, đường viền, và các chỉ số khác để xác định thời gian nhập học.
- Thêm thêm các chỉ số vị thế bằng phẳng, chẳng hạn như hình dạng đường K đảo ngược.
Tóm tắt
Chiến lược này sử dụng chỉ số VIX để đánh giá thời điểm và mức độ rủi ro của thị trường, kết hợp với chỉ số RSI để lọc các điểm giao dịch bất lợi của việc mua quá mức và bán quá mức, do đó mua vào thời điểm hiệu quả và dừng lỗ kịp thời. Chiến lược có nhiều không gian tối ưu hóa và có thể thích ứng với môi trường thị trường rộng hơn.
/*backtest
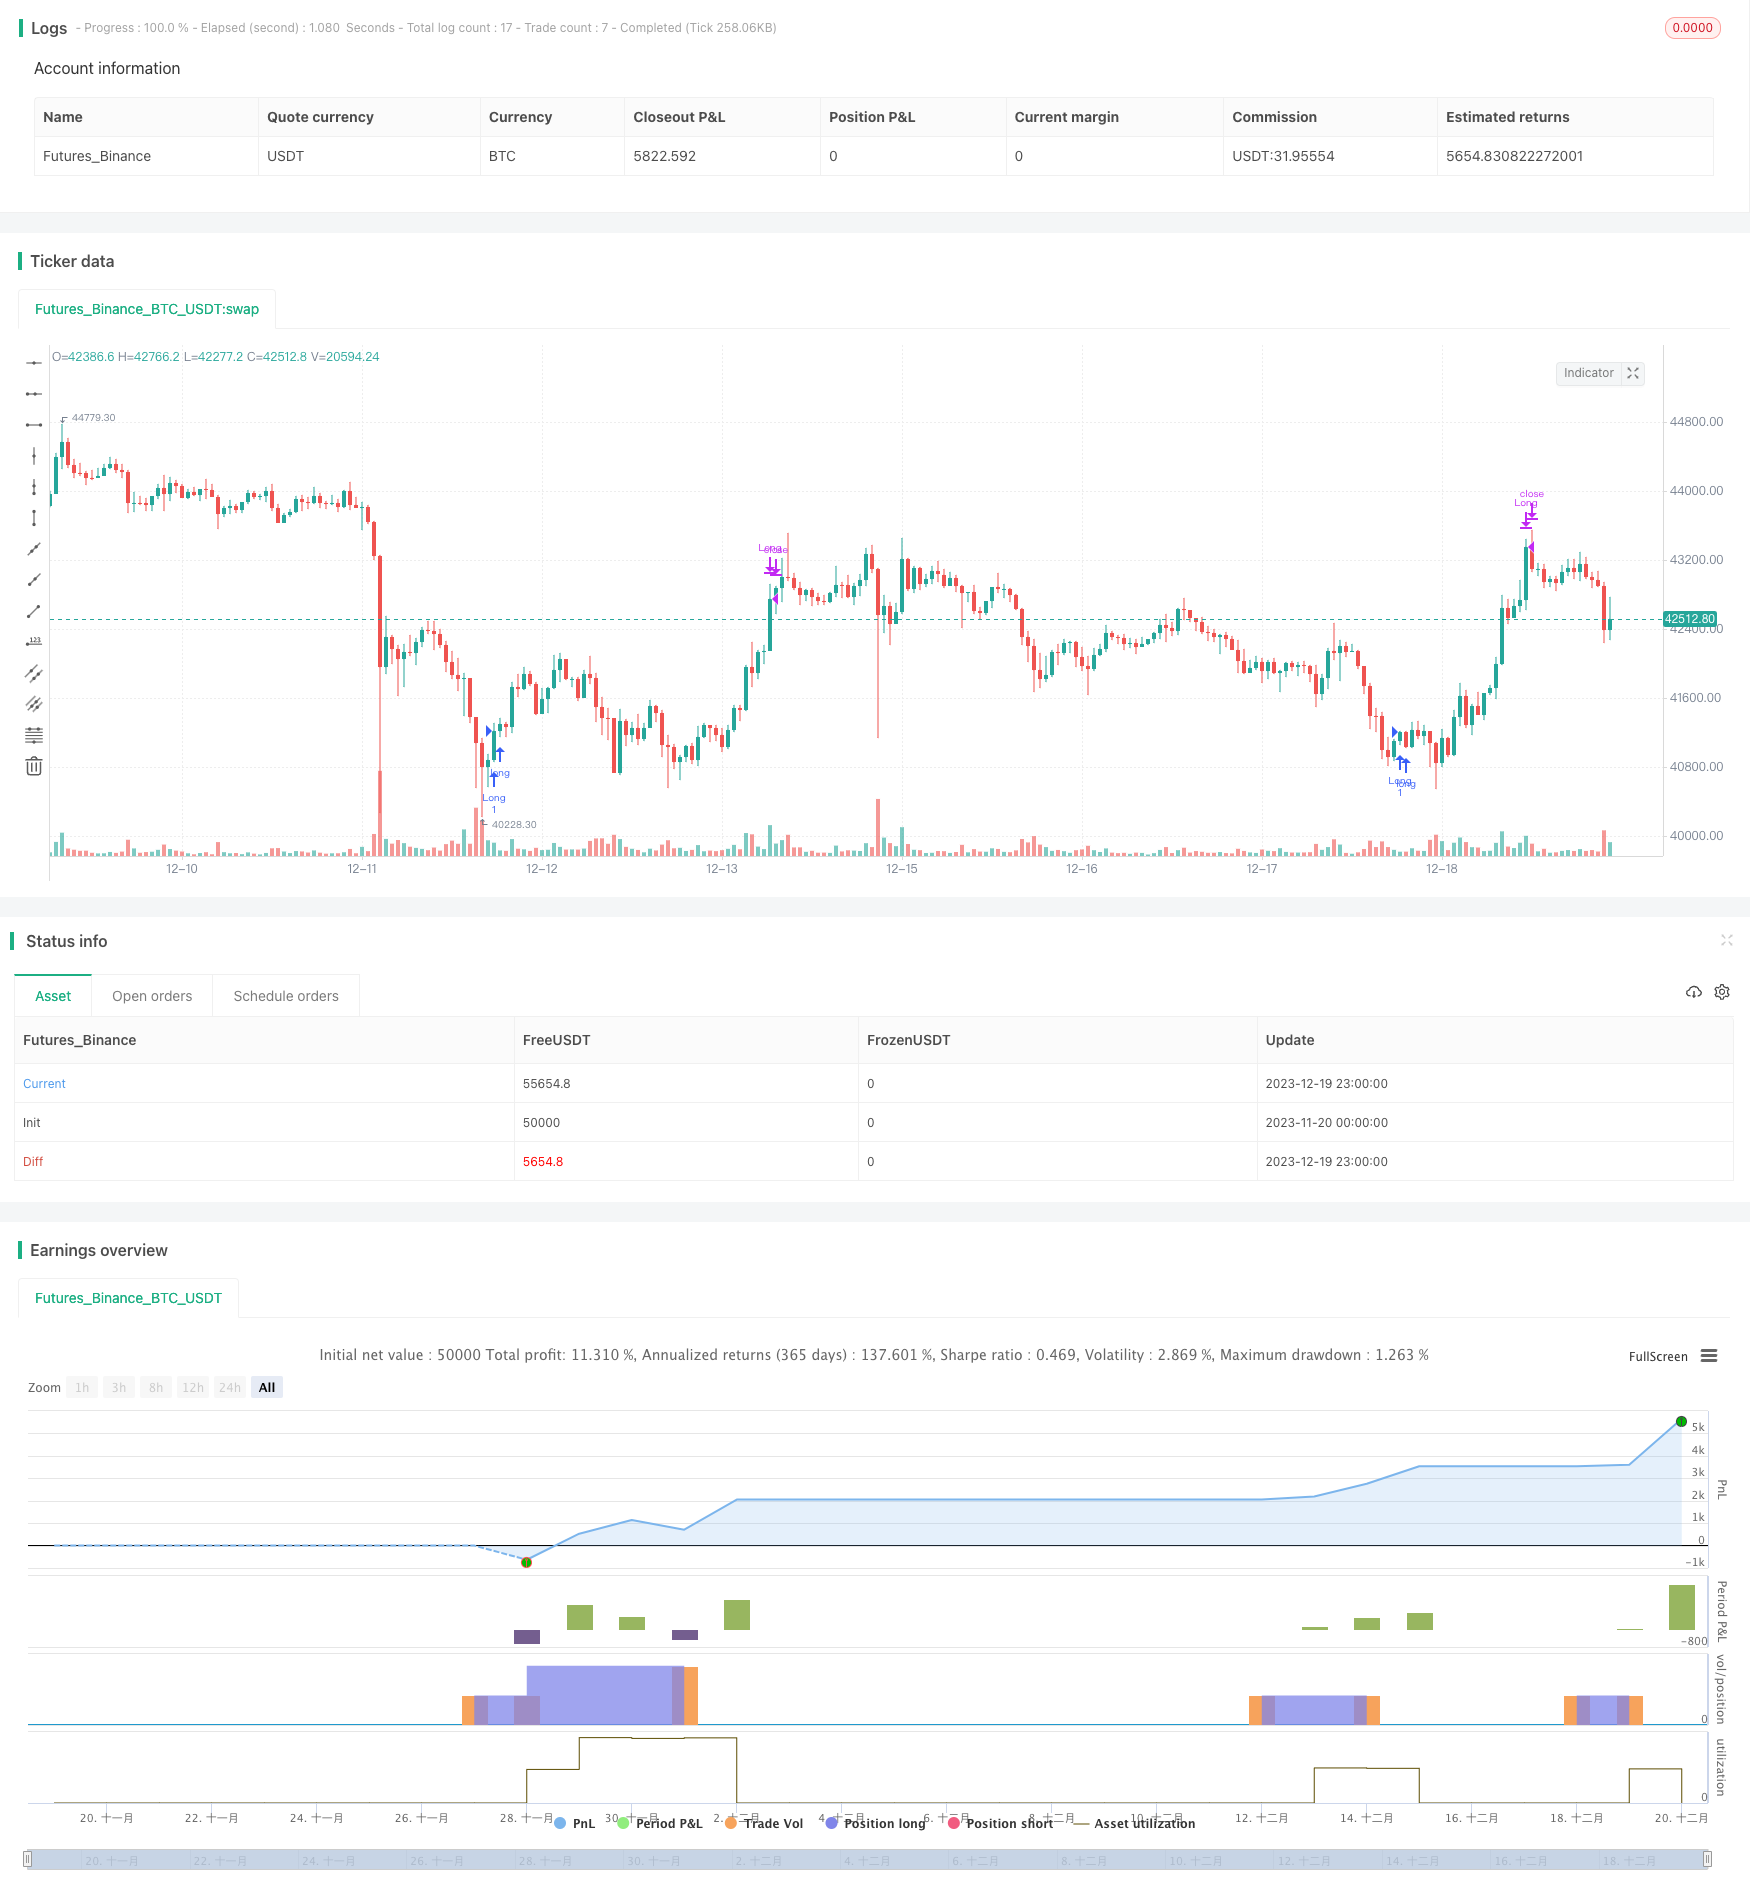
start: 2023-11-20 00:00:00
end: 2023-12-20 00:00:00
period: 1h
basePeriod: 15m
exchanges: [{"eid":"Futures_Binance","currency":"BTC_USDT"}]
*/
//@version=5
// This source code is subject to the terms of the Mozilla Public License 2.0 at https://mozilla.org/MPL/2.0/
// © timj
strategy('Vix FIX / StochRSI Strategy', overlay=true, pyramiding=9, margin_long=100, margin_short=100)
Stochlength = input.int(14, minval=1, title="lookback length of Stochastic")
StochOverBought = input.int(80, title="Stochastic overbought condition")
StochOverSold = input.int(20, title="Stochastic oversold condition")
smoothK = input(3, title="smoothing of Stochastic %K ")
smoothD = input(3, title="moving average of Stochastic %K")
k = ta.sma(ta.stoch(close, high, low, Stochlength), smoothK)
d = ta.sma(k, smoothD)
///////////// RSI
RSIlength = input.int( 14, minval=1 , title="lookback length of RSI")
RSIOverBought = input.int( 70 , title="RSI overbought condition")
RSIOverSold = input.int( 30 , title="RSI oversold condition")
RSIprice = close
vrsi = ta.rsi(RSIprice, RSIlength)
///////////// Double strategy: RSI strategy + Stochastic strategy
pd = input(22, title="LookBack Period Standard Deviation High")
bbl = input(20, title="Bolinger Band Length")
mult = input.float(2.0 , minval=1, maxval=5, title="Bollinger Band Standard Devaition Up")
lb = input(50 , title="Look Back Period Percentile High")
ph = input(.85, title="Highest Percentile - 0.90=90%, 0.95=95%, 0.99=99%")
new = input(false, title="-------Text Plots Below Use Original Criteria-------" )
sbc = input(false, title="Show Text Plot if WVF WAS True and IS Now False")
sbcc = input(false, title="Show Text Plot if WVF IS True")
new2 = input(false, title="-------Text Plots Below Use FILTERED Criteria-------" )
sbcFilt = input(true, title="Show Text Plot For Filtered Entry")
sbcAggr = input(true, title="Show Text Plot For AGGRESSIVE Filtered Entry")
ltLB = input.float(40, minval=25, maxval=99, title="Long-Term Look Back Current Bar Has To Close Below This Value OR Medium Term--Default=40")
mtLB = input.float(14, minval=10, maxval=20, title="Medium-Term Look Back Current Bar Has To Close Below This Value OR Long Term--Default=14")
str = input.int(3, minval=1, maxval=9, title="Entry Price Action Strength--Close > X Bars Back---Default=3")
//Alerts Instructions and Options Below...Inputs Tab
new4 = input(false, title="-------------------------Turn On/Off ALERTS Below---------------------" )
new5 = input(false, title="----To Activate Alerts You HAVE To Check The Boxes Below For Any Alert Criteria You Want----")
sa1 = input(false, title="Show Alert WVF = True?")
sa2 = input(false, title="Show Alert WVF Was True Now False?")
sa3 = input(false, title="Show Alert WVF Filtered?")
sa4 = input(false, title="Show Alert WVF AGGRESSIVE Filter?")
//Williams Vix Fix Formula
wvf = ((ta.highest(close, pd)-low)/(ta.highest(close, pd)))*100
sDev = mult * ta.stdev(wvf, bbl)
midLine = ta.sma(wvf, bbl)
lowerBand = midLine - sDev
upperBand = midLine + sDev
rangeHigh = (ta.highest(wvf, lb)) * ph
//Filtered Bar Criteria
upRange = low > low[1] and close > high[1]
upRange_Aggr = close > close[1] and close > open[1]
//Filtered Criteria
filtered = ((wvf[1] >= upperBand[1] or wvf[1] >= rangeHigh[1]) and (wvf < upperBand and wvf < rangeHigh))
filtered_Aggr = (wvf[1] >= upperBand[1] or wvf[1] >= rangeHigh[1]) and not (wvf < upperBand and wvf < rangeHigh)
//Alerts Criteria
alert1 = wvf >= upperBand or wvf >= rangeHigh ? 1 : 0
alert2 = (wvf[1] >= upperBand[1] or wvf[1] >= rangeHigh[1]) and (wvf < upperBand and wvf < rangeHigh) ? 1 : 0
alert3 = upRange and close > close[str] and (close < close[ltLB] or close < close[mtLB]) and filtered ? 1 : 0
alert4 = upRange_Aggr and close > close[str] and (close < close[ltLB] or close < close[mtLB]) and filtered_Aggr ? 1 : 0
//Coloring Criteria of Williams Vix Fix
col = wvf >= upperBand or wvf >= rangeHigh ? color.lime : color.gray
isOverBought = (ta.crossover(k,d) and k > StochOverBought) ? 1 : 0
isOverBoughtv2 = k > StochOverBought ? 1 : 0
filteredAlert = alert3 ? 1 : 0
aggressiveAlert = alert4 ? 1 : 0
if (filteredAlert or aggressiveAlert)
strategy.entry("Long", strategy.long)
if (isOverBought)
strategy.close("Long")